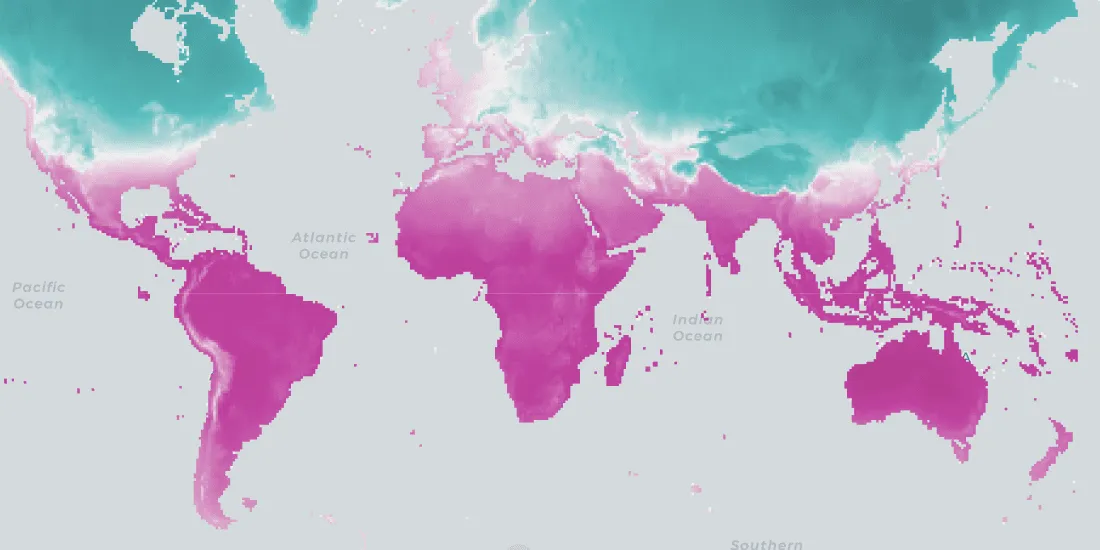
We are pleased to announce the release of a new version of CARTO Spatial Features, including new variables for urbanity level, elevation, & climatology
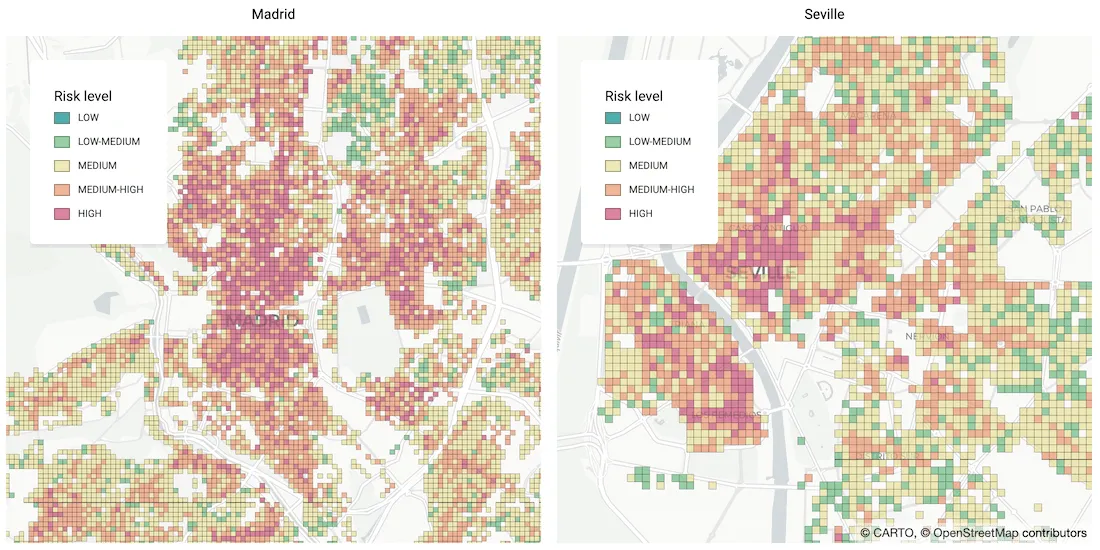
As many parts of the world enter into recession following the Coronavirus pandemic, read how Spatial Data Science can help identify areas with a greater risk