

Mapping Segregation - MIT's Atlas of Inequality


This week The Atlas of Inequality a joint project from MIT Media Lab's Human Dynamics Group and the Department of Mathematics at Universidad Carlos III de Madrid was launched. The project explores behavioral patterns and investigates segregation an ongoing and large-scale issue and how it is impacted and exacerbated by personal choices and decisions.
Tackling Inequality and Segregation
The team behind The Atlas is led by MIT and Universidad Carlos III de Madrid's Esteban Moro and MIT's Alex Pentland. Guided by the understanding that we, as a society, tend not to interact outside of our respective bubbles. The Atlas of Inequality team's research seeks to visualize and inform viewers as to the places in their lives where they are actively segregated.
In his recent TEDx talk, Moro notes not only the negative impacts on health and education, and the crime rates faced by segregated lower-income communities, but also the interpersonal costs on individuals and the creative costs for companies. He notes that on average, an individual interacts personally or professionally with only 5000 people in their life. Because of our habits and behaviors we tend to exacerbate segregation, leaving the large majority of those 5000 individuals very similar to ourselves.
In his talk, Moro defines the positive impacts, not just for people but for communities and companies as a whole, that come from increasing diversity in our day-to-day interactions. It is his hope that The Atlas of Inequality can serve as a tool that doesn't just educate users on how diverse their interactions (and the venues, shops, and restaurants they visit) are, but also as a guide, showing viewers that more diverse options and experiences are right next door.
The Map - Data and How It Was Built
The Atlas of Inequality uses aggregated and anonymized location data from Cuebiq from October 2016 through March 2017 provided through their Data for Good Program, to examine human mobility patterns, reflecting roughly 3% of the population of the Boston metropolitan area as a sample. Using the anonymized data, the Atlas team pinpointed home locations as the most frequent location between 8 PM and 4 AM. They then estimate income using the median household income level of the surrounding census block group for those home locations.
By matching this data with visits to approximately 30,000 locations, they created a diversity index, visualizing segregation as a function of how many visitors are coming from each of four distinct income buckets.
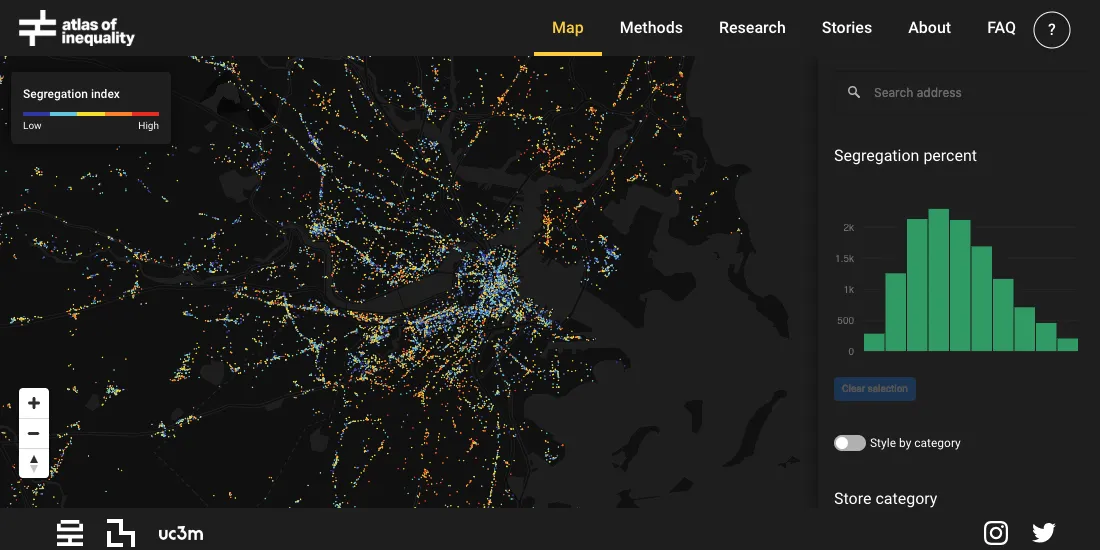
The Atlas has a built-in interactive category widget that allows users to quickly filter by location categories, allowing users to look at inequality specifically at restaurants or art venues for example. There is also a button that allows for on-the-fly styling by category.
The histogram to the top right of the maps shows distribution of the segregation percentage across all locations that are currently visualized in the viewport of the map. This histogram also acts as a filter, so users can take a look at all locations landing at a specific segregation level.
The Atlas also has informational tabs that share resources, walk through methodology, answer frequently asked questions, and more.
What's next for the Atlas?
At the moment, The Atlas of Inequality represents segregation in the Boston metropolitan area. Its creators hope that it can act as a handy tool to help people and businesses to make the small behavioral changes that can, over time, reduce segregation in our daily lives, popping social bubbles and leading to greater outcomes for all.
They hope to continue to expand the project and provide a similar resource to more metropolitan areas where segregation continues to be an issue that stunts economic growth and limits the opportunities of low income communities.
Want to build your own Location Intelligence application?
Schedule some time with our experts!


