

ATTOM in CARTO: School District Boundary Maps


Location location location. A mantra often repeated in the real estate industry since home values are inextricably linked to their location. Home values of course are driven by supply and demand with prices in the UK recently jumping due to pent up demand following the easing of lockdown restrictions.
Recently we looked into research by Howsy examining how those buying or renting a new home may be attracted to properties that allow them to walk to work or use micromobility options and consequently where demand may be increasing. Other factors influencing demand and the values of home prices include:
- Homes near the ocean rivers lakes or parks
- Homes with sweeping panoramic views of cityscapes mountains greenbelts or golf courses
- Commercial buildings close to residential property
- Homes close to railroad tracks overpasses airports and busy intersections
- Levels of crime
- Toxic emissions from industrial plants impacting air quality and lower home values
For many of these we already have a wealth of public and premium datasets available within our Spatial Data Catalog to enrich your own data and analysis.
Homebuyers with children are often concerned about their children's education and will pay more for a home that is located in a school district with high test scores and a good reputation.
Today we are pleased to announce that we will be utilizing ATTOM Data Solutions comprehensive school districts and attendance zones datasets in the US and Canada within our Data Observatory.
ATTOM is a leading provider of boundary-based spatial data offering the largest database ever compiled for school boundaries. Their school boundary solutions cover the entire US and include 13 462 district boundaries and 67 274 school boundaries.
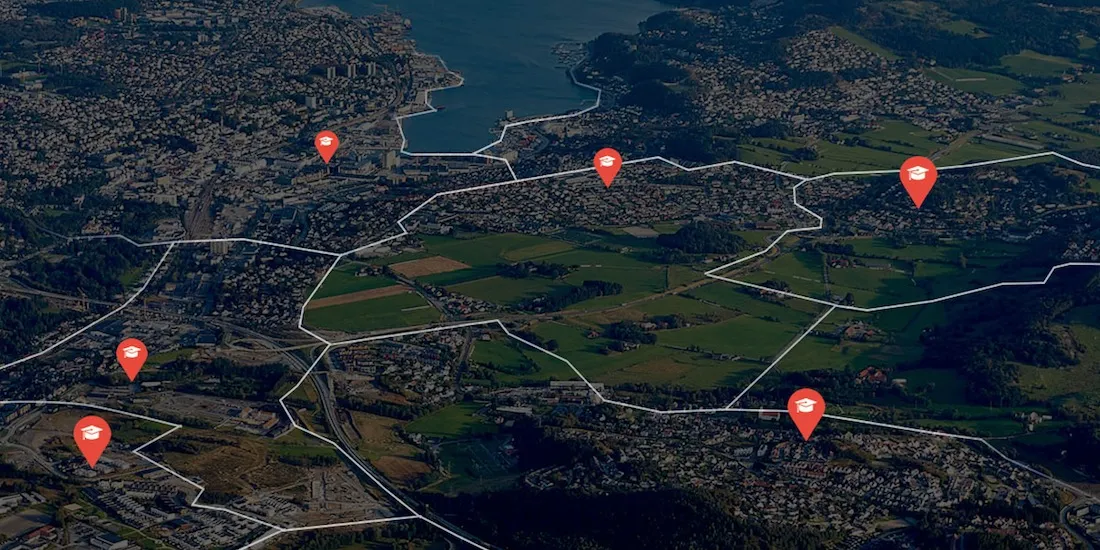
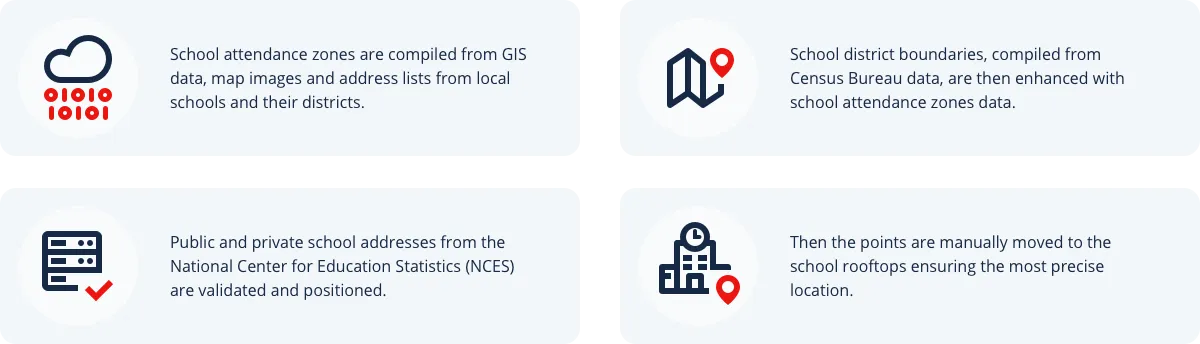
How School Attendance Zone Boundary Works
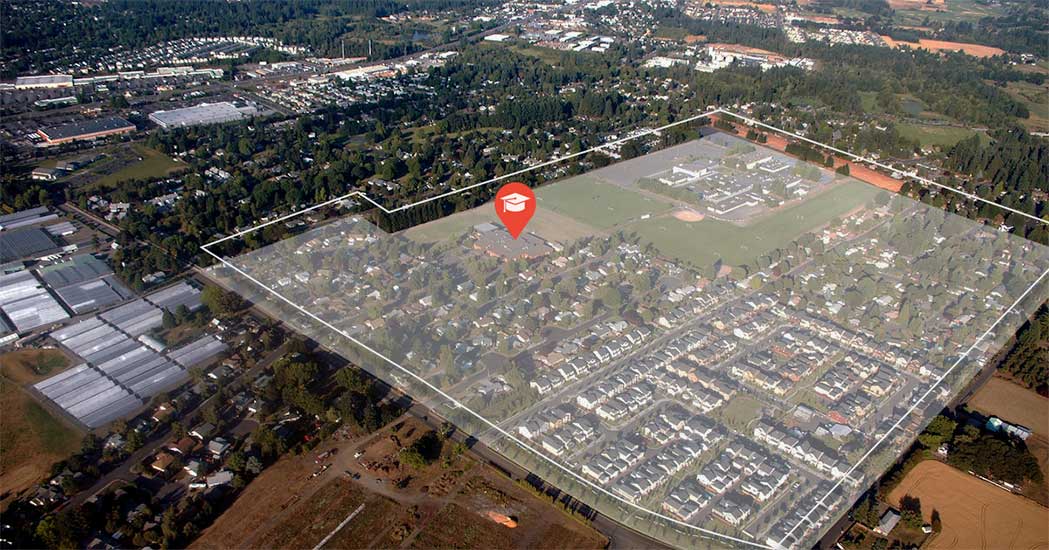
School attendance zones are the geographic area around a school that defines where students need to live in order to attend.
Benefits of School Boundary Data
- Ease of AccessThe largest database for up-to-date and accurate boundaries data at your fingertips.
- Precision and AccuracyLongitude and latitude within the specific boundary are validated and positioned for precise location.
- Data-Driven Decision MakingMake informed decisions using data to understand school utilization and other planning objectives.
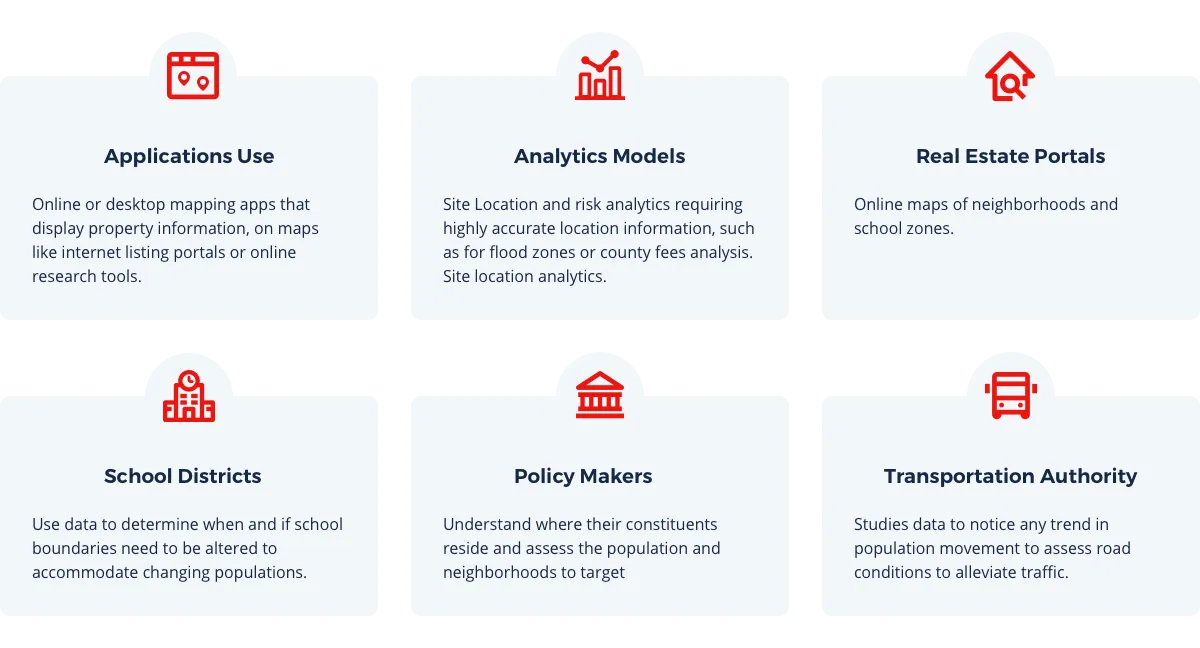
Use Cases
Get Started with Modern Up-to-Date Data Streams
Learn more about CARTO's location data streams and start incorporating data from ATTOM and other high-quality data sets into your models and spatial analyses today.
Want to get started?
 | This project has received funding from the European Union's Horizon 2020 research and innovation programme under grant agreement No 960401. |


