CARTO BigQuery Tiler Upgrade Gives Speed & Feature Boost


Improved tilesets for visualizing massive datasets
In our previous BigQuery Tiler blog post we provided a simple walk through of the steps required to connect BigQuery to CARTO for visualizing volume datasets. In today’s post we focus on the value of this BigQuery integration for Developers Data Engineers and Data Scientists and share details of some of our latest tileset features.
Since we launched CARTO BigQuery Tiler Beta we have seen lots of interest in its usage and many of our partners are developing some powerful spatial applications. Check out this Thinking Machines' Healthcare analysis for example.
Also the team from Google Cloud gave a great demonstration at our recent Spatial Data Science Conference.
We are really encouraged by these early testimonials. Being able to create tilesets directly from BigQuery and visualize massive datasets at speed is a game-changer. Here are some of the reasons why:
- Your data is already hosted in BigQuery so you don’t need to export it out upload it to a new service create virtual instances or use desktop software to create tilesets. You can access your data securely from a single source.
- You won't need to learn a new scripting language to create tilesets or complicated commands. If you know SQL why not just use SQL?
- You want the tilesets to be generated in a matter of minutes not hours. The time it takes to download your data upload it to a new service and compute it….well it can take a long time. Compare that to processing 1.4 billion points in just under 8 minutes using SQL!
- If your data is changing every hour you might be dreading creating a complex ETL process that extracts data every hour; or paying thousands of dollars for external computing. With CARTO BigQuery Tiler you can simply schedule the query execution in BigQuery. It’s both easy and cost-effective!
- You want to use the BigQuery computing resources you have paid for without incurring additional fees for creating tilesets.
CARTO BigQuery Tiler is the fastest most convenient and most cost effective way of generating Tilesets for the web. This is a bold statement but we truly believe it!
And as of today we are adding even more possibilities and performance improvements. More specifically
- Support for different types of tilesets
- A new set of documentation
- Integrated with the rest of CARTO
- And a new online viewer!
That’s a lot of new enhancements to talk about. So let's get started!
Support for a new type of tileset: Simple Tileset
So far you have been able to create a PointAggregationTileset. Now we have added another foundational type of tileset we are calling SimpleTileset for the support of non aggregated spatial features and that includes points polygons or lines.
Point Aggregations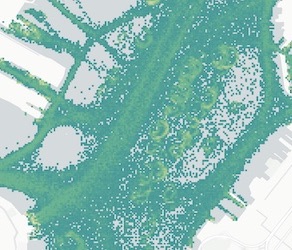 | Simple Tileset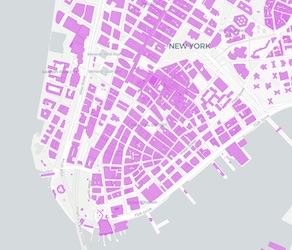 |
You can use point aggregations for datasets that contain large amounts of point data when you want to explore its density so effectively you are creating a gridded map that changes at each zoom level.
But with Simple Tilesets you can encode separate features not an aggregation. Now how can you encode millions of points in a single tile? You don’t have to! We'll provide you with strategies to limit the number of features per tile. As you zoom in you will be able to see all the original features from your dataset.
This new type of tileset dramatically increases the number of visualizations you can create with BigQuery Tiler.
For example the following query would create a tileset containing all the block groups in the US and their population:
CALL cartobq.tiler.CreateSimpleTileset(
'''
(
  SELECT
    d.geoid
    d.total_pop
    g.geom
  FROM `carto-do-public-data.usa_acs.demographics_sociodemographics_usa_blockgroup_2015_5yrs_20142018` d
  JOIN
`carto-do-public-data.carto.geography_usa_blockgroup_2015` g
  ON d.geoid = g.geoid
) _input
'''
–Name and location where the Tileset will be stored.
 ‘PROJECT.DATASET.usa_blockgroup_population’
–Options on how to generate the Tileset
 ‘’’{
     “zoom_max”: 14
     “max_tile_size_kb”: 3072
     “properties”:{
         “geoid”: “String”
         “total_pop”: “Number”
      }
}’’’);
This query equates to around 5 million tiles (from zoom levels 0 to 14) and takes just under 10 minutes to be generated! Check out the map below for a visualization of the resulting tileset:
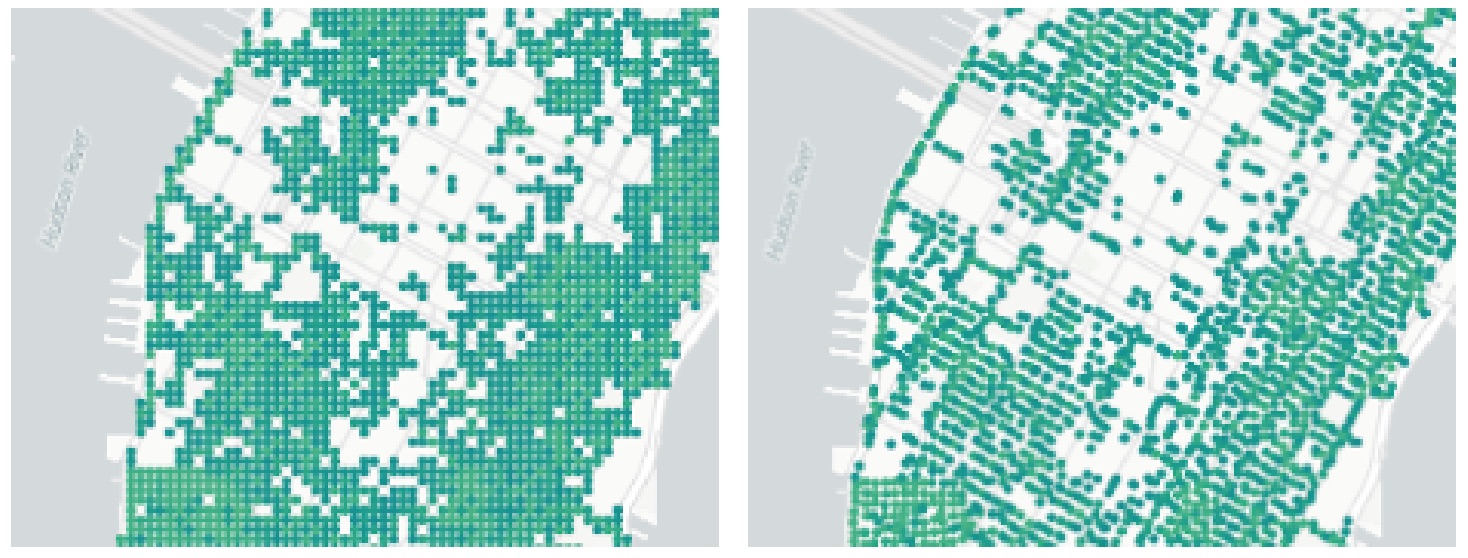
Additionally for point aggregation methods we are enabling more complex formulas defined in SQL and new modes for selecting the position of geometries within a cell. Check out the difference of using the centroid of the cell (image on the left) compared to a random feature on the tile (image on the right). In our view a much better looking visualization with a higher degree of fidelity.
New Documentation
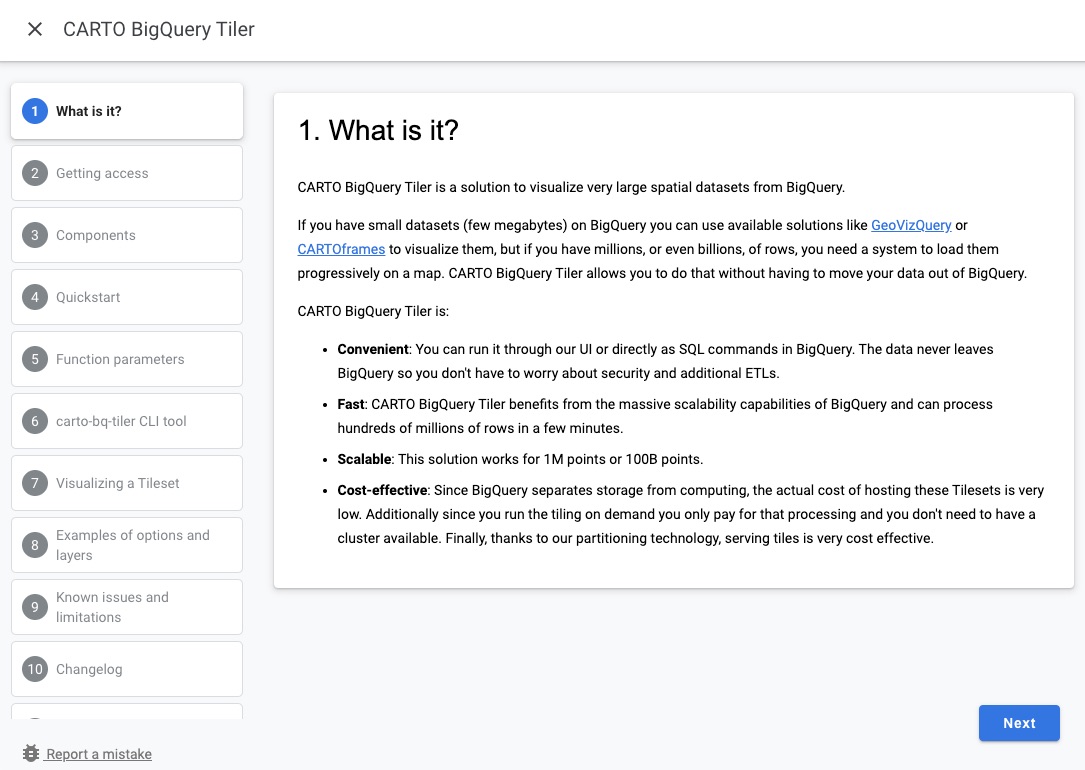
As we keep adding more capabilities the quality of documentation becomes more and more important. We are therefore making use of the great Open Source tool Google Codelabs. We will eventually migrate content to our official documentation center but we think this a significant improvement from the previous version. Click on the following link to check it out https://codelabs.carto.com/bigquery
Integrated with the rest of CARTO
This also means that from now on you need to have a CARTO account to use our publishing service of tiles coming from BigQuery. If you are part of our Beta program mailing list we will reach out about it. If you have yet to join our BigQuery Tiler Beta Program click here to join!
Coming soon: a fully revamped web viewer
Leveraging our recently announced CARTO for deck.gl we are working on a next-generation tool for visualizing tilesets generated with CARTO BigQuery Tiler. It will make use of declarative language in deck.gl to enable more advanced visualization capabilities and visual exploration of your tilesets.
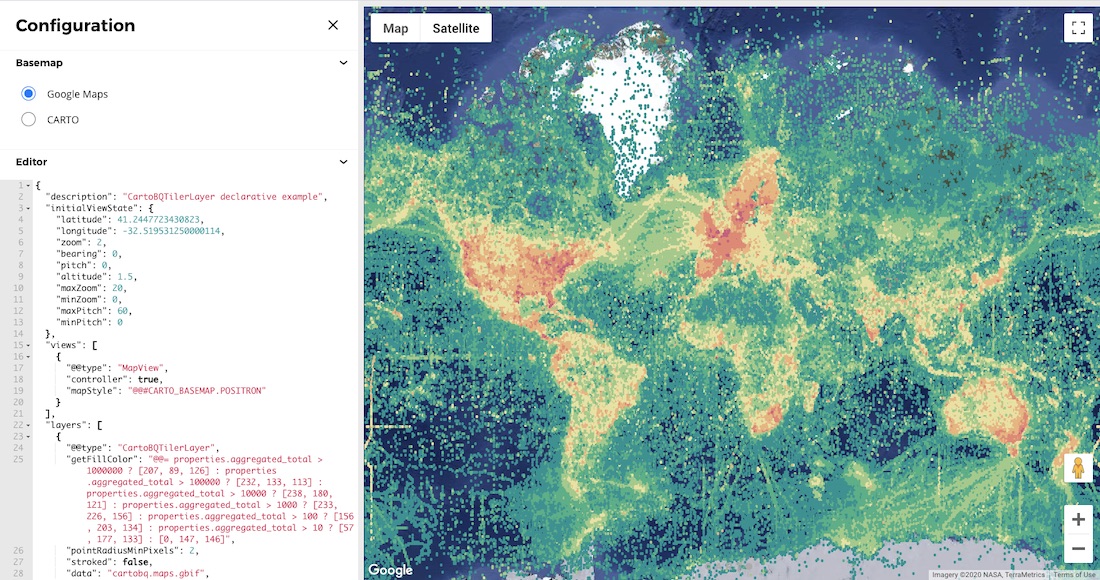
It will also allow you to share the styling of the map or even embed the result on an external website. And as a final enhancement it will support Google Maps as your basemap.
We are just getting started
As you can see there is a lot of ongoing effort being put in to enable our so-called Cloud Native Spatial Analysis. We now have a solid foundation for utilizing next-generation data warehouses for Spatial Analysis and we would love to hear what you think about BigQuery Tiler. In fact we are setting up meetings and demos to listen to your feedback and answer any questions you may have. Please reach out to your CARTO Customer Success Manager if you are interested in talking part in one of these sessions.
Want to start using the new viewer with your BigQuery Tiler tilesets?
 | This project has received funding from the European Union's Horizon 2020 research and innovation programme under grant agreement No 960401. |