

Census Oddities


U.S. Census data and boundaries are used in a lot of different projects, but sometimes we've encountered some unexpected and - frankly - odd results from forays into census data. So we wanted to share some tips we learned while making sense of these census oddities so you can be prepared for when they come up in your spatial analysis.
Geographies on the move
All the data from the U.S. Census and the American Community Survey rely on geographies, but these human-drawn boundaries are ever changing. There are two types geographic boundaries used by the Census Bureau.
- Legal boundaries, like state and county measures, are defined by law and used for administrative purposes.
- Statistical boundaries, like census tracts, census blocks, and metropolitan areas are defined by the Census Bureau and used primarily for the collection and presentation of data.
You can find the vast majority of these available on our Spatial Data Catalog. which you can subscribe to for cloud-native analysis! Make sure you sign up for a free 14-day trial to take advantage of this!
These boundaries are intended to be relatively stable and consistent, but mistakes and changes do occur. (Check out this site for the highlights of geographical changes every year!) Sometimes places get renamed. Sometimes locations are annexed or absorbed by another area. And sometimes the boundaries of an area are resurveyed and geocoded, shifting its measures ever so slightly.
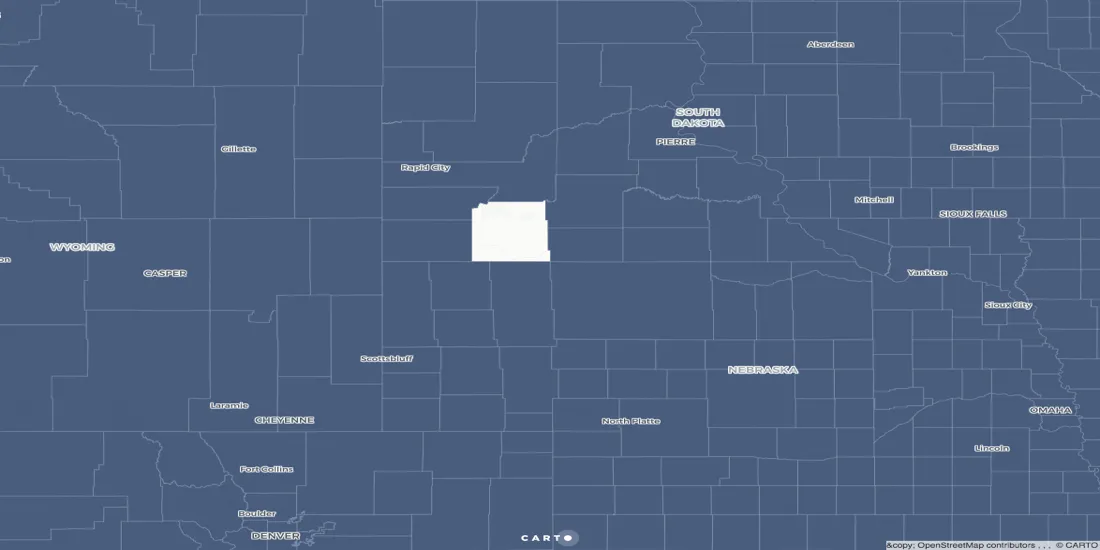
When matching the vintage of your geographies with the vintage of your data, keep an eye out for these changes because trying to join based on finicky FIPS and geoid codes can return odd looking maps like the one above with a gaping hole in the middle of the country. The reason for this oddity is that South Dakota changed the county name from Shannon County to Oglala Lakota County!
The reason shoreline-clipping exists
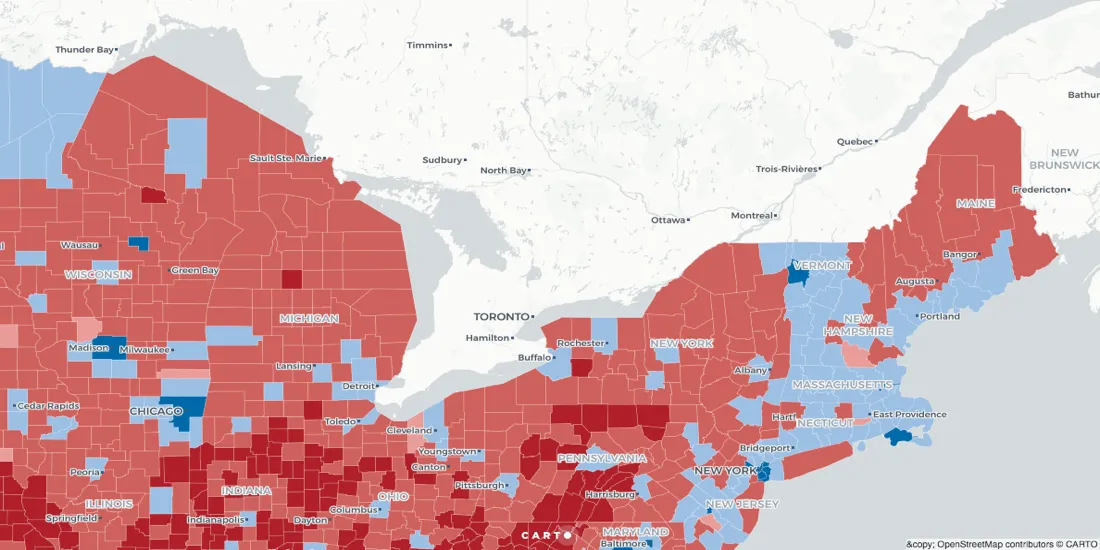
Census boundaries enriched with data are produced with TIGER (Topologically Integrated Geographic Encoding and Referencing), which is limited for visualization purposes due to shoreline clipping - where data boundaries extend to the administrative shoreline, approximately 3 miles "out" from the physical shorelines. For instance, Long Island, New York doesn't look like an island and the Great Lakes look like they've been absorbed by Michigan.
For a long time here at CARTO, we debated the merits of providing users access in our Data Observatory to non-clipped boundaries. Besides rare instances where users would be counting the number of people living in houseboats, we couldn't imagine why non-clipped boundaries would be necessary. (Anyone interested in reading our extensive conversations on this topic can learn more by following this Github issue.)
At one point, I decided to email the U.S. Census Bureau about the subject, and received a comprehensive response on the reason for shoreline clipped boundaries, which is that the Census Bureau, as a federal agency, has a responsibility to main the legal boundaries for all geographic entities in the United States, and they maintain boundaries out to 3 miles offshore for this purpose. But, in terms of statistical data dissemination, there is no need for offshore areas.
Why is there no data here?
If you try making United States total population map at the county-level with the latest 1-year data from the American Community Survey Estimate, you’re going to notice some holes in your map.
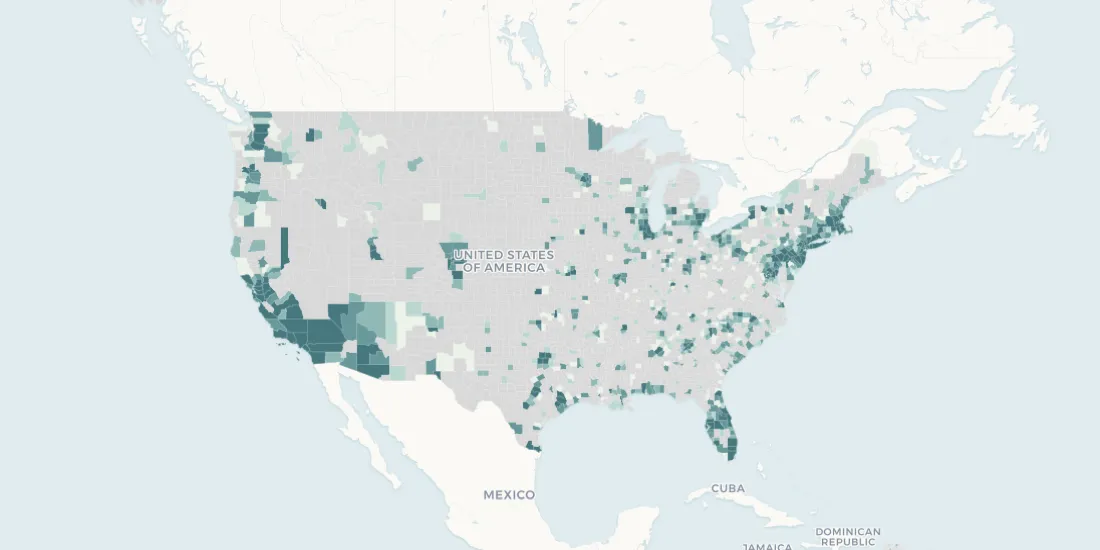
What happened to all those gray counties? Did the U.S. Census forget to count there? Obviously not. There's a pattern in the map where counties without new data are mostly located in rural areas, and because these areas didn't have a size-able enough population were actually omitted from the survey. Over the course of the year, the Census Bureau isn't able to survey enough people in these rural counties so the Bureau can't release reliable estimates. Generally speaking, 1-year American Community Survey estimates are published for areas with populations greater than 65 000 people. (There are more rules for data suppression related to quality standards that could be the reason for holes in your map that you can review here).
So this means when mapping total population at the county-level you'll need to use data from the latest 5-year estimates. With the American Community Survey data, it's always a trade-off between data current and sample reliability, but consulting this handy table can help you figure out the best survey to use!
What is MOE?
MOE stands for Margin of Error, and it is probably one of the most overlooked dimensions of the Census and American Community Survey. Since these resources provide data from a sample size rather than from the entire population, we need to consider the margin of error (MOE) in the sample size. The MOE reported for ACS data shows a 90% confidence interval in the measurement. For example, if you have a sample of 3,021 people who responded as being enrolled students and the MOE is plus/minus 913 people then you can say with 90% confidence that the number of enrolled students is between 2,930 and 3,932 people.
The MOE can help determine whether the difference between two measures is statistically significant or even when adding together measurements from several different areas. The ACS has some resources for understanding MOE and how to use it here and if you're curious about sample sizes, then check out this helpful overview.
Why doesn't anyone live here?
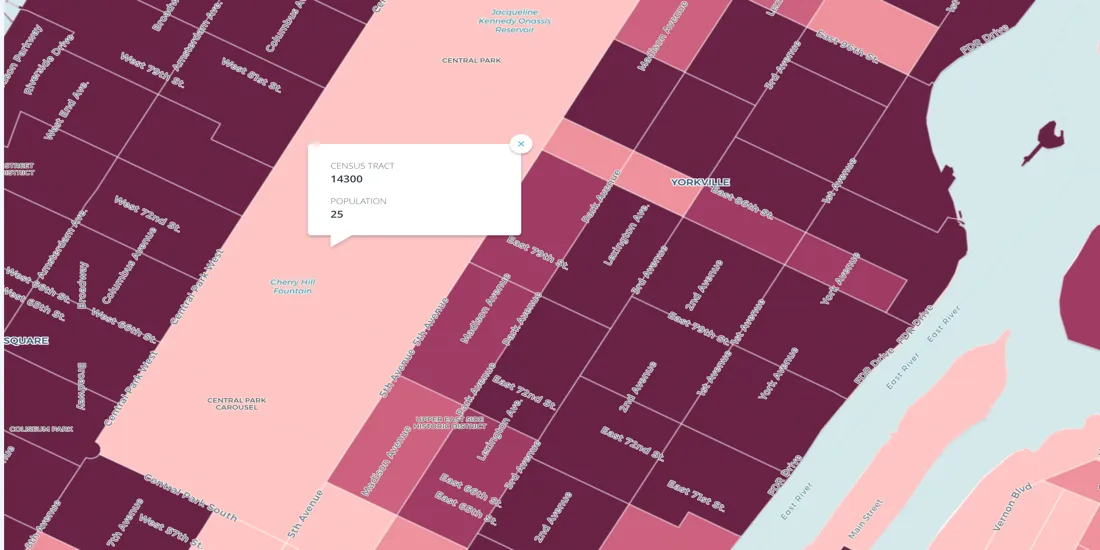
According to the map above, there are 25 people living in Central Park. But why? We have no idea. This is a true census oddity with no real explanation. As the Census Bureau recently told the New York Times "we are not certain but this could be either one of two possibilities: The self-described park residents were homeless or they were parks department employees living in some sort of caretaker facility."
At the same time, there are a lot of places with population counts of zero. Just for fun, here are all the census blocks in the United States with population counts of zero.
Proceed with caution
The moral of this story is that you should probably proceed with caution whenever using the ACS to make real-life decisions or represent groups of people and places. Every year the ACS helps “determine how more than $675 billion in federal and state funds are distributed ” but you have to remember that the ACS is not a perfect count of all people everywhere. The U.S. Census Bureau states that the “strength of the ACS is in estimating characteristic distributions” including percentages, means, medians, and rates over time as opposed to estimates of population totals. When you interpret results of analysis using Census data remember that although this data is important for understanding trends and patterns the data is not the entire truth of what is happening in reality. We hope this post has been helpful with some of the more common census data oddities that you might encounter!


