Data journalism & street reporting at The New York World


Which are the blocks in New York City that had the most New York Police Department stops in 2011?
Columbia Journalism School's The New York World has published this week a nice feature combining data journalism and street reporting that offers a new insight on this issue.
Here you can read the piece by Alice Brennan: The NYPD’s hottest stop-and-frisk spots. And this is the interactive map using CartoDB. It shows the number of incidents recorded for every block in NYC throughout 2011.
We emailed the team behind the project to gather info about their work and the use of CartoDB for data journalism.
One of the goals was to show the analysis of the data alongside personal interviews of people living in hotspots or involved in any New York Police Department stop says data journalist Michael Keller.
Reporter Alice Brennan and Keller worked together to clean the data. Brian Abelson a graduate student at Columbia University's applied statistics program Quantitative Methods for the Social Sciences helped to identify the hotspots.
Keller also worked on the map code — at the bottom of the map there's the full list of contributors including Mike Sullivan deputy editor at The New York World who worked on the map and the interface.
The Spanish elections map from CartoDB available here was used as a template for the mouseovers. To mashup the stop-and-frisk counts with the census blocks data Keller did a ST_Intersects query. You can check here for the PostGIS documentation about this function.
The data is fetched from CartoDB through the SQL API and displayed using CartoDB library for Leaflet.
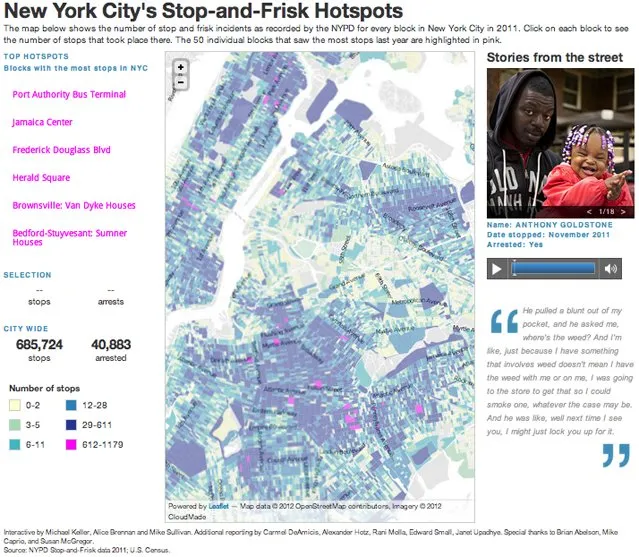
The resulting map shows 685 724 stops throughout the city and allows users to visually browse all the data. Hovering over each block reveals the number of stops that took place there. The top 50 hotspots are highlighted in pink with the top six hotspot blocks listed on the left by their general location. Clicking on each of the top six will show the number of arrests for that block along with the number of stops.
Personal stories and reporting give a new compelling perspective of the data. We love the approach. Great work!