Where should Erewhon open its next store? We asked PlacePulse



Visit counts tell you how many people walk into a store, but they don’t tell you what kind of places those visitors come from, how far they’re willing to travel, or where else you might find similar customers.
At the Spatial Data Science Conference 2026 in New York, we explored these questions in a hands-on workshop using PlacePulse Embeddings and visitor data from Erewhon, the upscale organic grocery chain with 13 stores across Los Angeles. Note Erewhon was used solely as an example for demonstration purposes and was not involved in the analysis or its conclusion.
We wanted to understand the geography of Erewhon’s customers and see how this information could help answer two practical business questions: where should the chain focus its next marketing campaigns, and where could it open its next store?
This post walks through the analysis, the insights we uncovered, and how you can reproduce the workflows yourself.
New to PlacePulse Embeddings? PlacePulse is CARTO’s geospatial foundation model, built in collaboration with Applied Geographic Solutions (AGS). It represents every location in the United States as a 256-dimensional embedding that captures its structural characteristics, which lets you perform tasks such as similarity search, clustering, and predictive modeling. If you’re new to PlacePulse, we recommend starting with our introductory post, where we explain how the embeddings are built and the kinds of problems they solve.
A closer look at Erewhon’s customer geography
We started by looking at where Erewhon’s customers come from. Using visitor data from Advan, we calculated a 60% trade area for each of the chain’s 13 stores. For each location, we ranked origin H3 cells by visit count and selected the smallest set of cells accounting for 60% of its visitors.
The map reveals some striking differences. The obtained catchment area varies greatly in shape and size. The Glendale area is compact, the Ventura Blvd site is large and disconnected, and the Calabasas location has a near linear catchment area spanning about 20 miles along a major freeway.
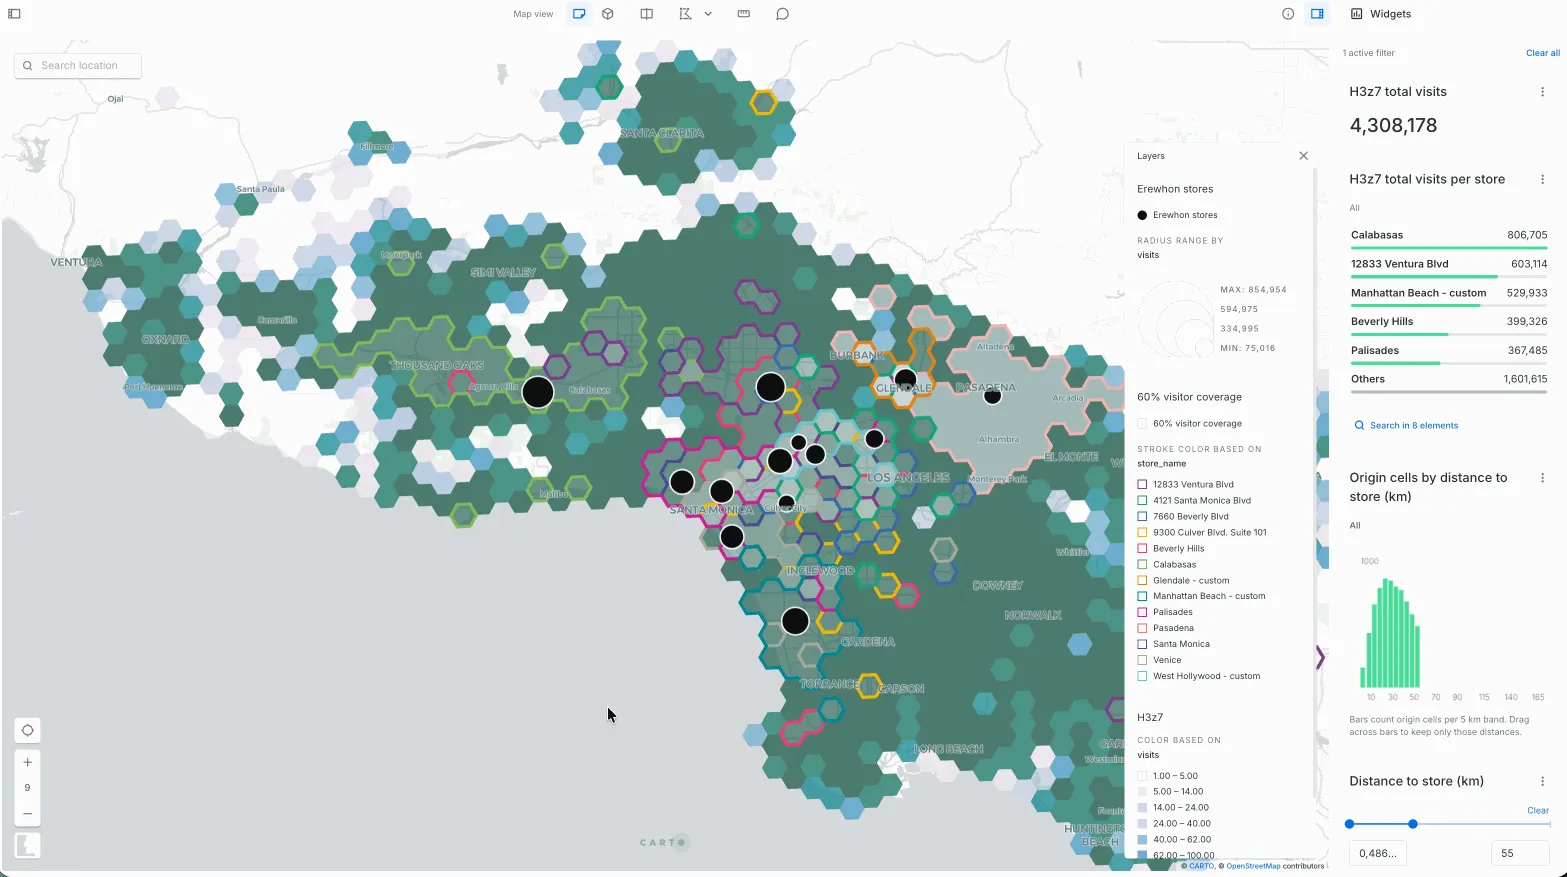
Erewhon's stores and 60% trade areas. Open in full screen here.
Clearly, not all Erewhon stores serve customers in the same way. But what explains these differences? Are stores attracting customers from different types of neighborhoods, and can we identify common characteristics among those places?
To investigate this, we combined the visitor data with PlacePulse Embeddings, which capture the characteristics of every H3 cell through 256 dimensions derived from 2,288 AGS attributes, including demographics, business mix, income, mobility, and more.
What kind of places do Erewhon’s visitors come from?
The differences in trade areas raise another question: are Erewhon’s stores attracting customers from different types of places? To investigate this, we turned to PlacePulse Embeddings.
We clustered the embeddings of all visitor-origin H3 cells into five groups, based on the characteristics of each location. The algorithm didn’t use geographic coordinates or visit counts, yet the resulting clusters form five geographically almost-contiguous regions across Los Angeles: the Westside, the San Fernando Valley, the Calabasas and Agoura Hills corridor, Downtown and the east, and a more distant outer ring.
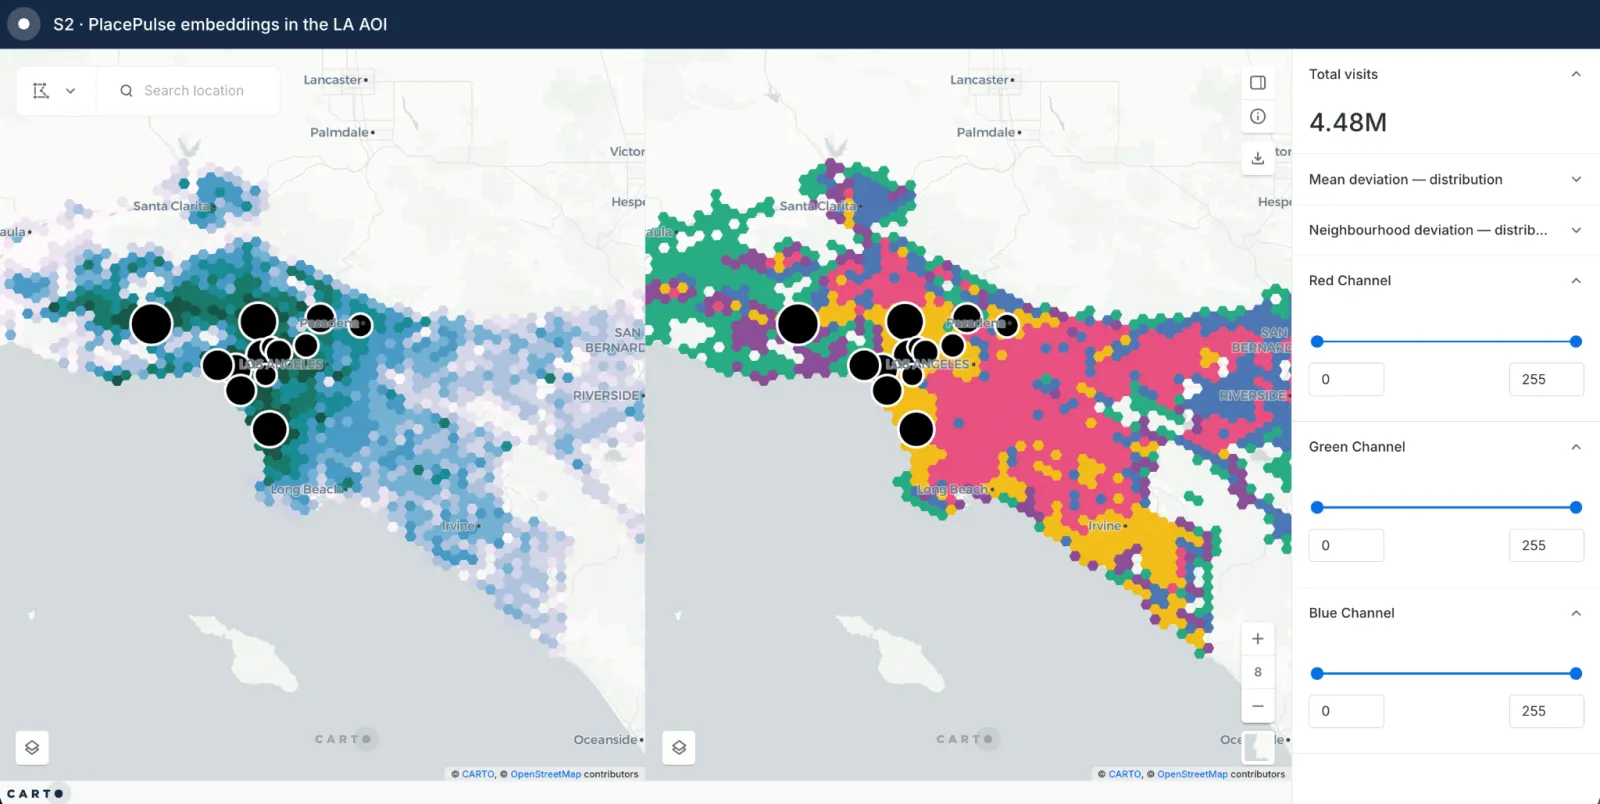
PlacePulse Embeddings, deviation scores, and origin clusters. Open in full screen here.
The clusters reveal interesting differences in customer travel behavior. Visitors from the dense Westside cluster (segment 4, yellow) travel a median distance of 2.9 miles, while visitors from the outer ring (segment 3, blue) travel a median of 15.5 miles. Interestingly, the Westside cluster is the smallest geographically, yet it accounts for 2.61 million of the chain’s 4.57 million visits. This suggests that a relatively compact area of Los Angeles is responsible for a substantial share of Erewhon’s business.
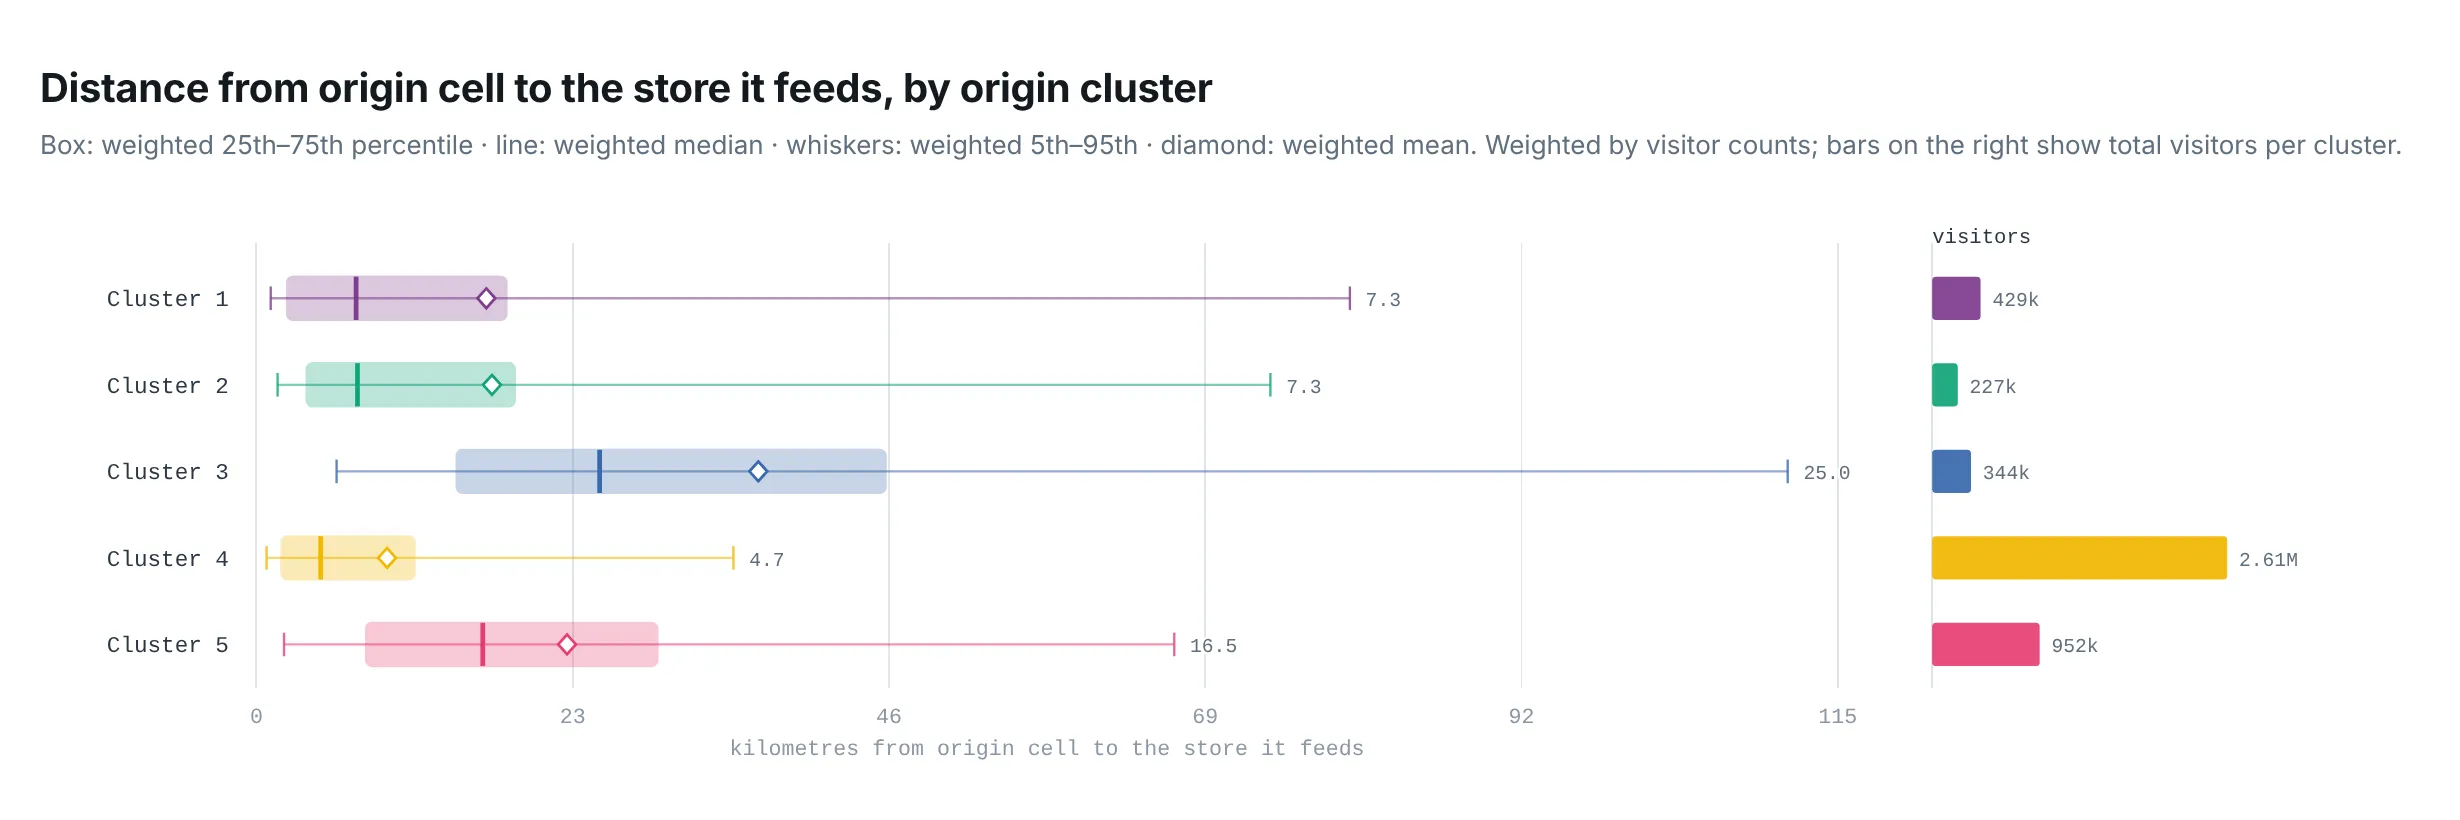
We then looked at how these five clusters contribute to visits at each of Erewhon’s 13 stores. The results reveal both a consistent pattern and an important exception. Most stores draw the majority of their visitors from two clusters, segments 4 (yellow) and 5 (pink), which together account for most visits across the chain’s locations.
The Palisades and Calabasas stores, however, display a distinctly different pattern, attracting a much larger share of visitors from segments 1 (purple), 2 (green), and 3 (blue). This points to a different customer geography, particularly around the Calabasas location.
The communities along the coast between Pacific Palisades and Malibu, as well as the affluent areas around Thousand Oaks and Agoura Hills, share more similarities with one another than with the Westside of Los Angeles. Calabasas therefore stands out as a store serving a particularly distinct customer base, rather than simply drawing from the same customer geography as the chain’s other locations.
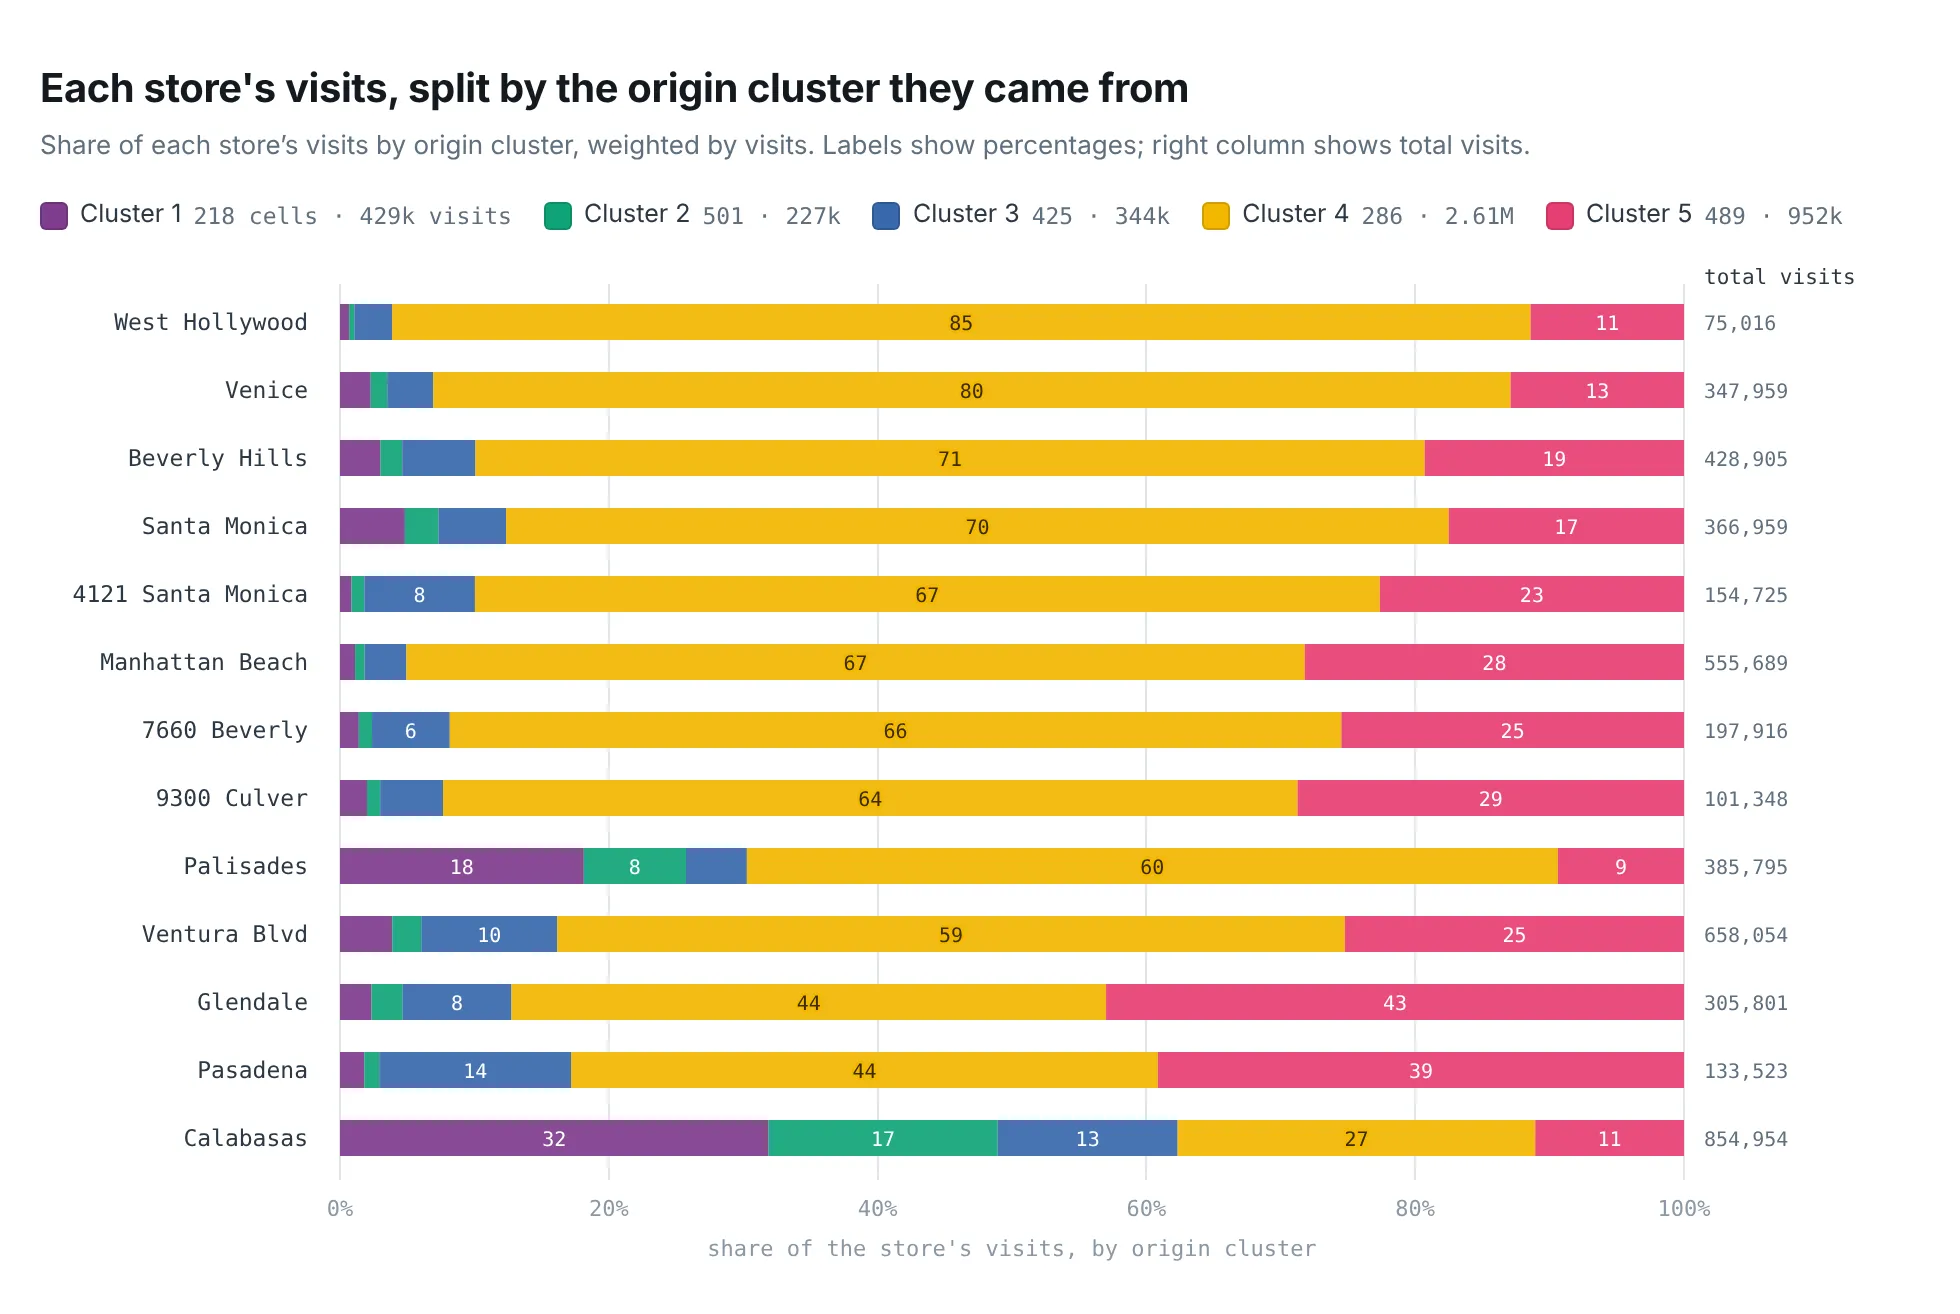
This distinction is particularly relevant for expansion, as Calabasas shows that Erewhon can succeed in markets with a different customer profile, opening up opportunities beyond its traditional Westside customer base.
Marketing expansion: where should Erewhon advertise?
Once we understood where Erewhon’s visitors come from, we used PlacePulse Embeddings to identify other places that could be promising targets for marketing.
For each H3 cell, we calculated a target score based on two factors: how similar its PlacePulse embedding is to Erewhon’s existing customer profiles, and how many visits it already sends to the stores. A high score identifies places that resemble the areas Erewhon already attracts customers from, but contribute relatively few visits today.
We grouped the results into five score categories, ranging from “1 Lowest” to “5 Act Here.” The map highlights the highest-scoring areas in red.
Importantly, these areas already show an existing connection to Erewhon, as most of the top-scoring areas are represented in the visitor statistics. This suggests that expansion is most likely to succeed in areas that share similar characteristics (or embeddings) with locations where Erewhon already attracts customers, but where the brand does not yet have a physical presence. As seen in the map below, this points to a potential expansion opportunity southward into Orange County.
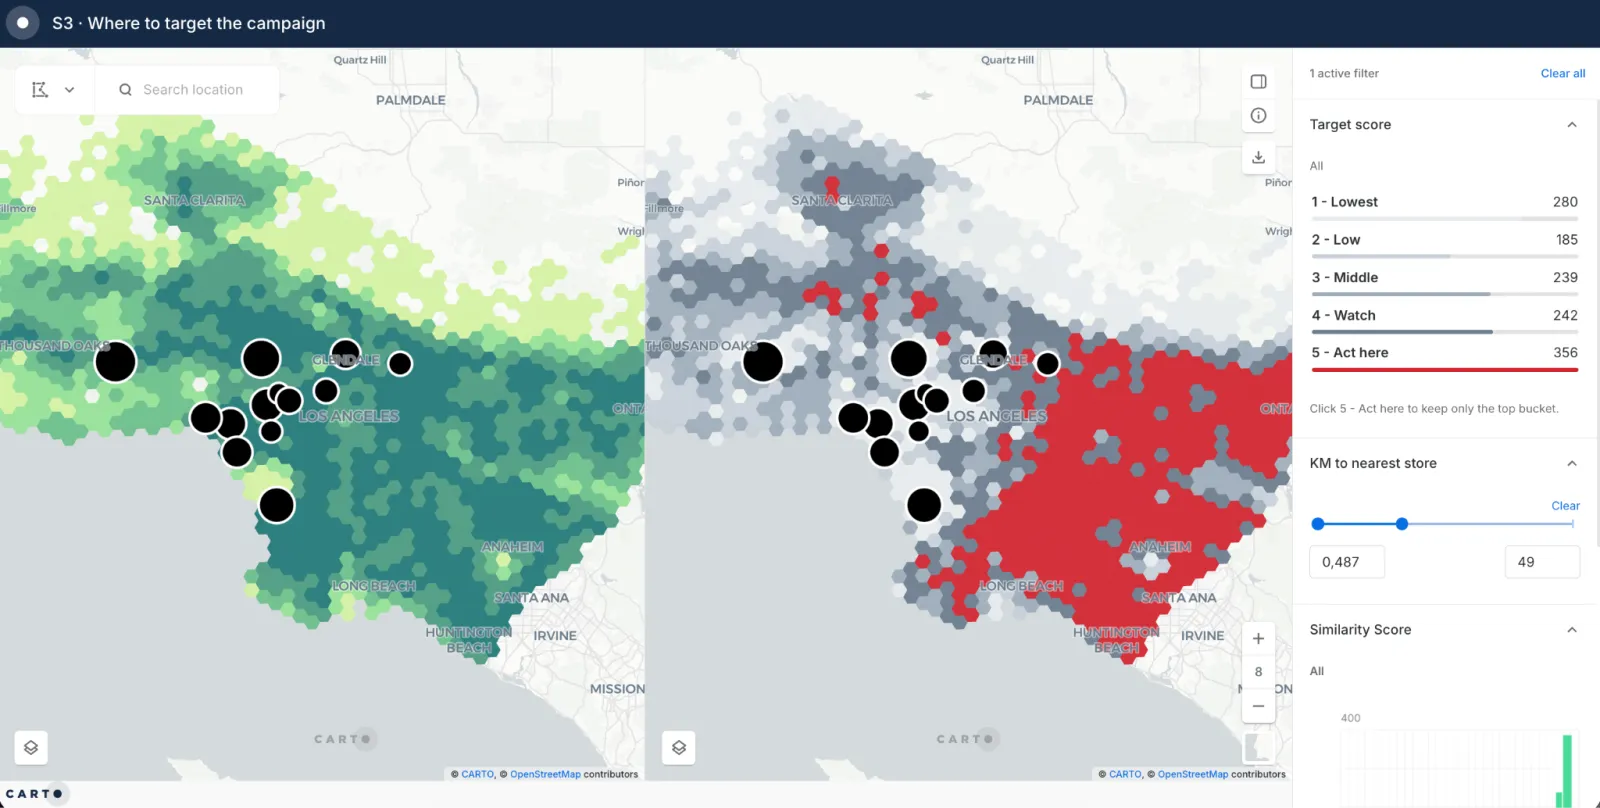
Marketing expansion score. Open in full screen here.
Retail expansion: what would a new store be worth?
Beyond identifying new marketing areas, we wanted to explore the bigger expansion question: how much visitation could Erewhon expect from its planned new stores in Costa Mesa and Thousand Oaks?
To estimate this, we trained a random forest model to predict the number of visits an H3 cell would send to a store. The model uses different predictors for each cell: its PlacePulse Embeddings, which captures the characteristics of the surrounding area, and its distance to the target store. We trained it on the visitor patterns of Erewhon’s existing stores, then applied it to the areas around the proposed Costa Mesa and Thousand Oaks locations.
The two locations have similar predicted visit volumes, although the spatial distribution of demand differs. In Thousand Oaks, predicted visits are spread more evenly across the surrounding area, while in Costa Mesa they are concentrated in fewer cells. More importantly, the Thousand Oaks store falls solidly within the existing catchment area of the Calabasas location, making heavy cannibalization highly likely as it would draw a substantial portion of the existing customer base along the US 101 freeway corridor.
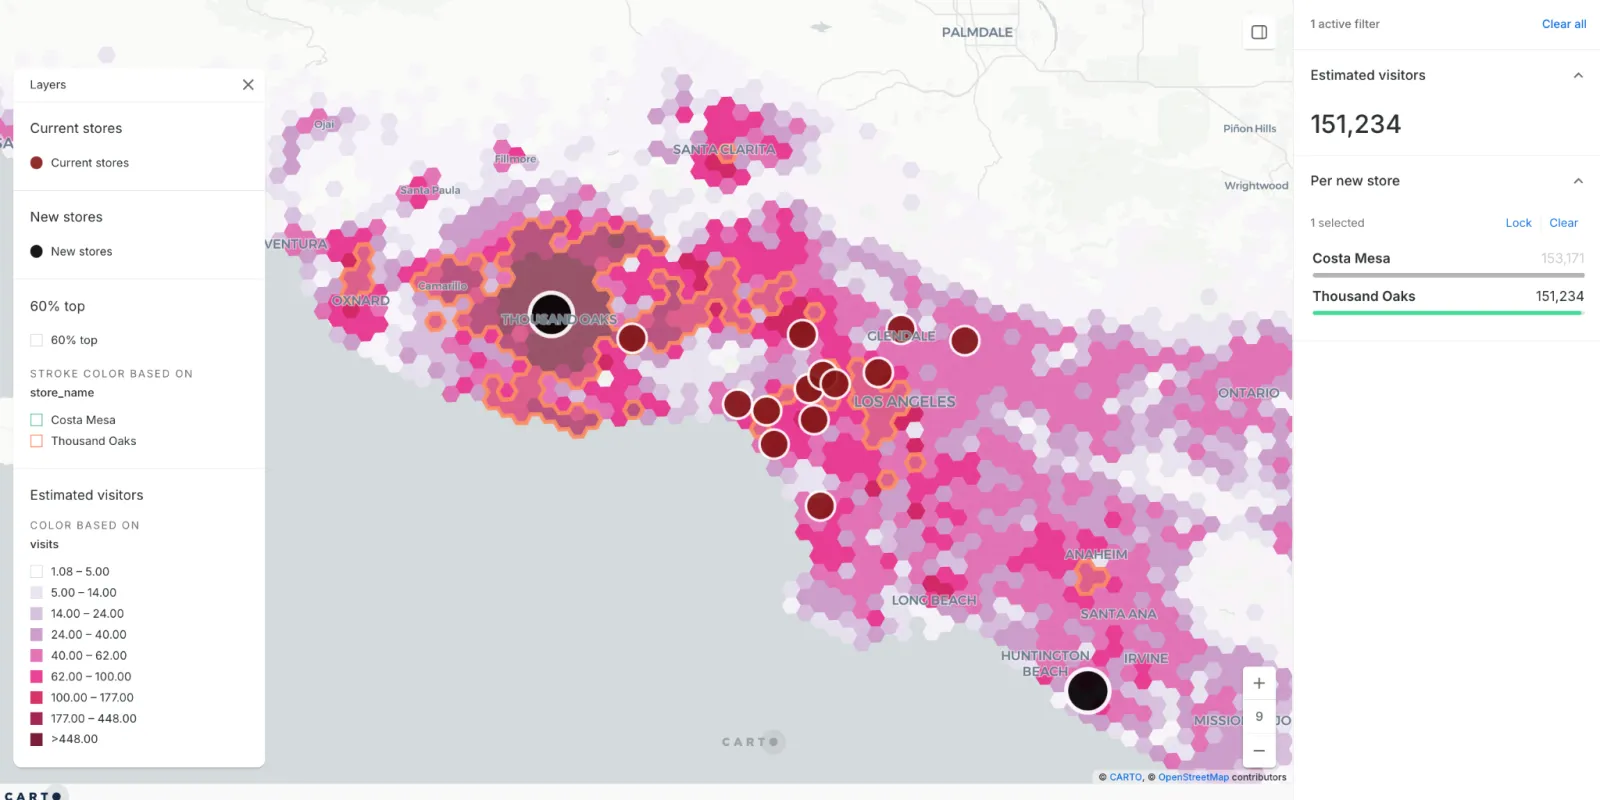
Predicted visits for potential stores in Costa Mesa and Thousand Oaks. Open in full screen here.
From workflow to shareable report with Claude
Once the analysis was complete, we connected the CARTO MCP Server to Claude to explore the results in plain language. From there, we created four CARTO Builder maps and generated a final report, bringing the analysis together in a format that is easy to explore, share, and communicate. The result is a reporting workflow that connects the underlying analysis with maps and narrative insights, making it easier to move from analytical results to actionable findings.
With CARTO for Agents, the same analysis runs from the chat agent a team already uses. Instead of switching between tools, writing queries, or building visualizations by hand, anyone on the team can ask questions of the data, generate maps, and turn the results into a report.
Run the workshop yourself
Everything from the workshop is publicly available in the SDSC26 NY workshop repository, including the slides, full report, and three workflows as SQL files that you can import into CARTO.
The input tables are available in the public BigQuery dataset cartobq.docs, so there’s no need to upload your own data.
To reproduce the analysis:
- Install the Analytics on Embeddings and the BQ ML extension packages in CARTO Workflows.
- Import the workflows into CARTO.
- Configure your output tables.
- Run the analysis and explore the results.
To learn more about PlacePulse and how to use geospatial foundation models in your own projects, check out:
- Turning geospatial foundation models into decisions using CARTO Workflows
- From embeddings to spatial insights: five new tools in CARTO Workflows
Ready to explore what PlacePulse can reveal about your own customers and markets? Start a free trial and test it on your own!
Frequently Asked Questions
How can PlacePulse Embeddings explain where a retailer's customers come from?
PlacePulse Embeddings describe every H3 cell through 256 dimensions derived from 2,288 AGS attributes, including demographics, business mix, income and mobility. Clustering the embeddings of the cells that send visitors to a chain’s stores groups those origins by the kind of place they are, without using coordinates or visit counts. In the Erewhon example, this produced five almost-contiguous regions across Los Angeles with very different travel distances and visit shares.
How do you find new areas to target with marketing using PlacePulse?
For each H3 cell, you calculate a target score based on how similar its PlacePulse embedding is to the existing customer profiles and how many visits it already sends to the stores. High scores identify places that resemble where customers already come from but contribute relatively few visits today. For Erewhon, the highest-scoring areas pointed south into Orange County.
How can you estimate visits for a new store location?
In the workshop, a random forest model was trained on the visitor patterns of existing stores to predict how many visits each H3 cell would send to a store, using the cell’s PlacePulse Embeddings and its distance to the store as predictors. Applied to candidate sites in Costa Mesa and Thousand Oaks, it predicted similar visit volumes, but showed Thousand Oaks sits inside the Calabasas store’s catchment, making heavy cannibalization likely.
Can I reproduce the Erewhon PlacePulse analysis myself?
Yes. The SDSC26 NY workshop repository includes the slides, full report and three workflows as SQL files to import into CARTO, and the input tables are in the public BigQuery dataset cartobq.docs. You install the Analytics on Embeddings and BQ ML extension packages in CARTO Workflows, import the workflows, configure your output tables and run the analysis.