Finding the Next EV Charging Hotspots with PlacePulse Embeddings


New to PlacePulse Embeddings? PlacePulse is CARTO’s geospatial foundation model, built in collaboration with Applied Geographic Solutions (AGS). It represents every location in the United States as a 256-dimensional embedding that captures its structural characteristics, which lets you perform tasks such as similarity search, clustering, and predictive modeling. If you’re new to PlacePulse, we recommend starting with our introductory post, where we explain how the embeddings are built and the kinds of problems they solve.
As electric vehicle adoption accelerates, utilities, charging networks, and automakers face a growing challenge: deciding where to build the next generation of charging stations.
One intuitive approach is to prioritize areas where EV adoption is already high. While this can help serve existing demand, it may also reinforce today’s infrastructure patterns and miss places where demand is likely to emerge next.
The bigger opportunity is to identify places that resemble today’s successful EV charging markets but still have relatively limited charging infrastructure. Doing that requires understanding the broader character of a place (its built environment, amenities, demographics, and surrounding context) rather than relying on a small set of individual variables. This is exactly the kind of problem PlacePulse Embeddings are designed to solve.
Looking beyond existing charging stations
Places with strong EV adoption often share a mix of similar socioeconomic, housing, mobility, and land-use characteristics. Prior research has linked EV adoption to factors such as income, education, home ownership, housing type, urban/rural location, and access to charging. In practice, these patterns may show up through:
- higher household incomes,
- higher educational attainment,
- greater home ownership,
- urban or large metropolitan locations,
- multi-vehicle households,
- and many other structural attributes.
Traditionally, building a model around these characteristics requires collecting dozens or even hundreds of datasets, deciding which variables matter, cleaning them, and engineering features before any analysis can begin.
PlacePulse Embeddings replace that entire process with a single representation of place. Each neighborhood (H3 resolution-7 cell) is encoded as a 256-dimensional vector that summarizes its demographic, economic, commercial, and environmental characteristics, making it immediately usable for downstream machine learning tasks.

Finding EV charging infrastructure gaps with PlacePulse Embeddings
Instead of asking “How many chargers are there?”, we ask a slightly different question: How many chargers would we expect to find, given the characteristics of this neighborhood?
To answer it, we trained a regression model using PlacePulse Embeddings as the primary representation of place, and observed public EV charging stations as the target outcome. Charging station locations are derived from the U.S. Department of Energy’s Alternative Fuels Data Center, maintained by NREL.
The model learns the relationship between a neighborhood’s structural profile and the amount of charging infrastructure it typically supports. Once trained, it estimates the expected number of charging stations for every H3.
The interesting signal comes from comparing the prediction with reality.
- Where the observed number of charging stations is lower than expected, the area may represent an opportunity for future investment.
- Conversely, neighborhoods where charging infrastructure already exceeds expectations may represent mature or saturated markets.
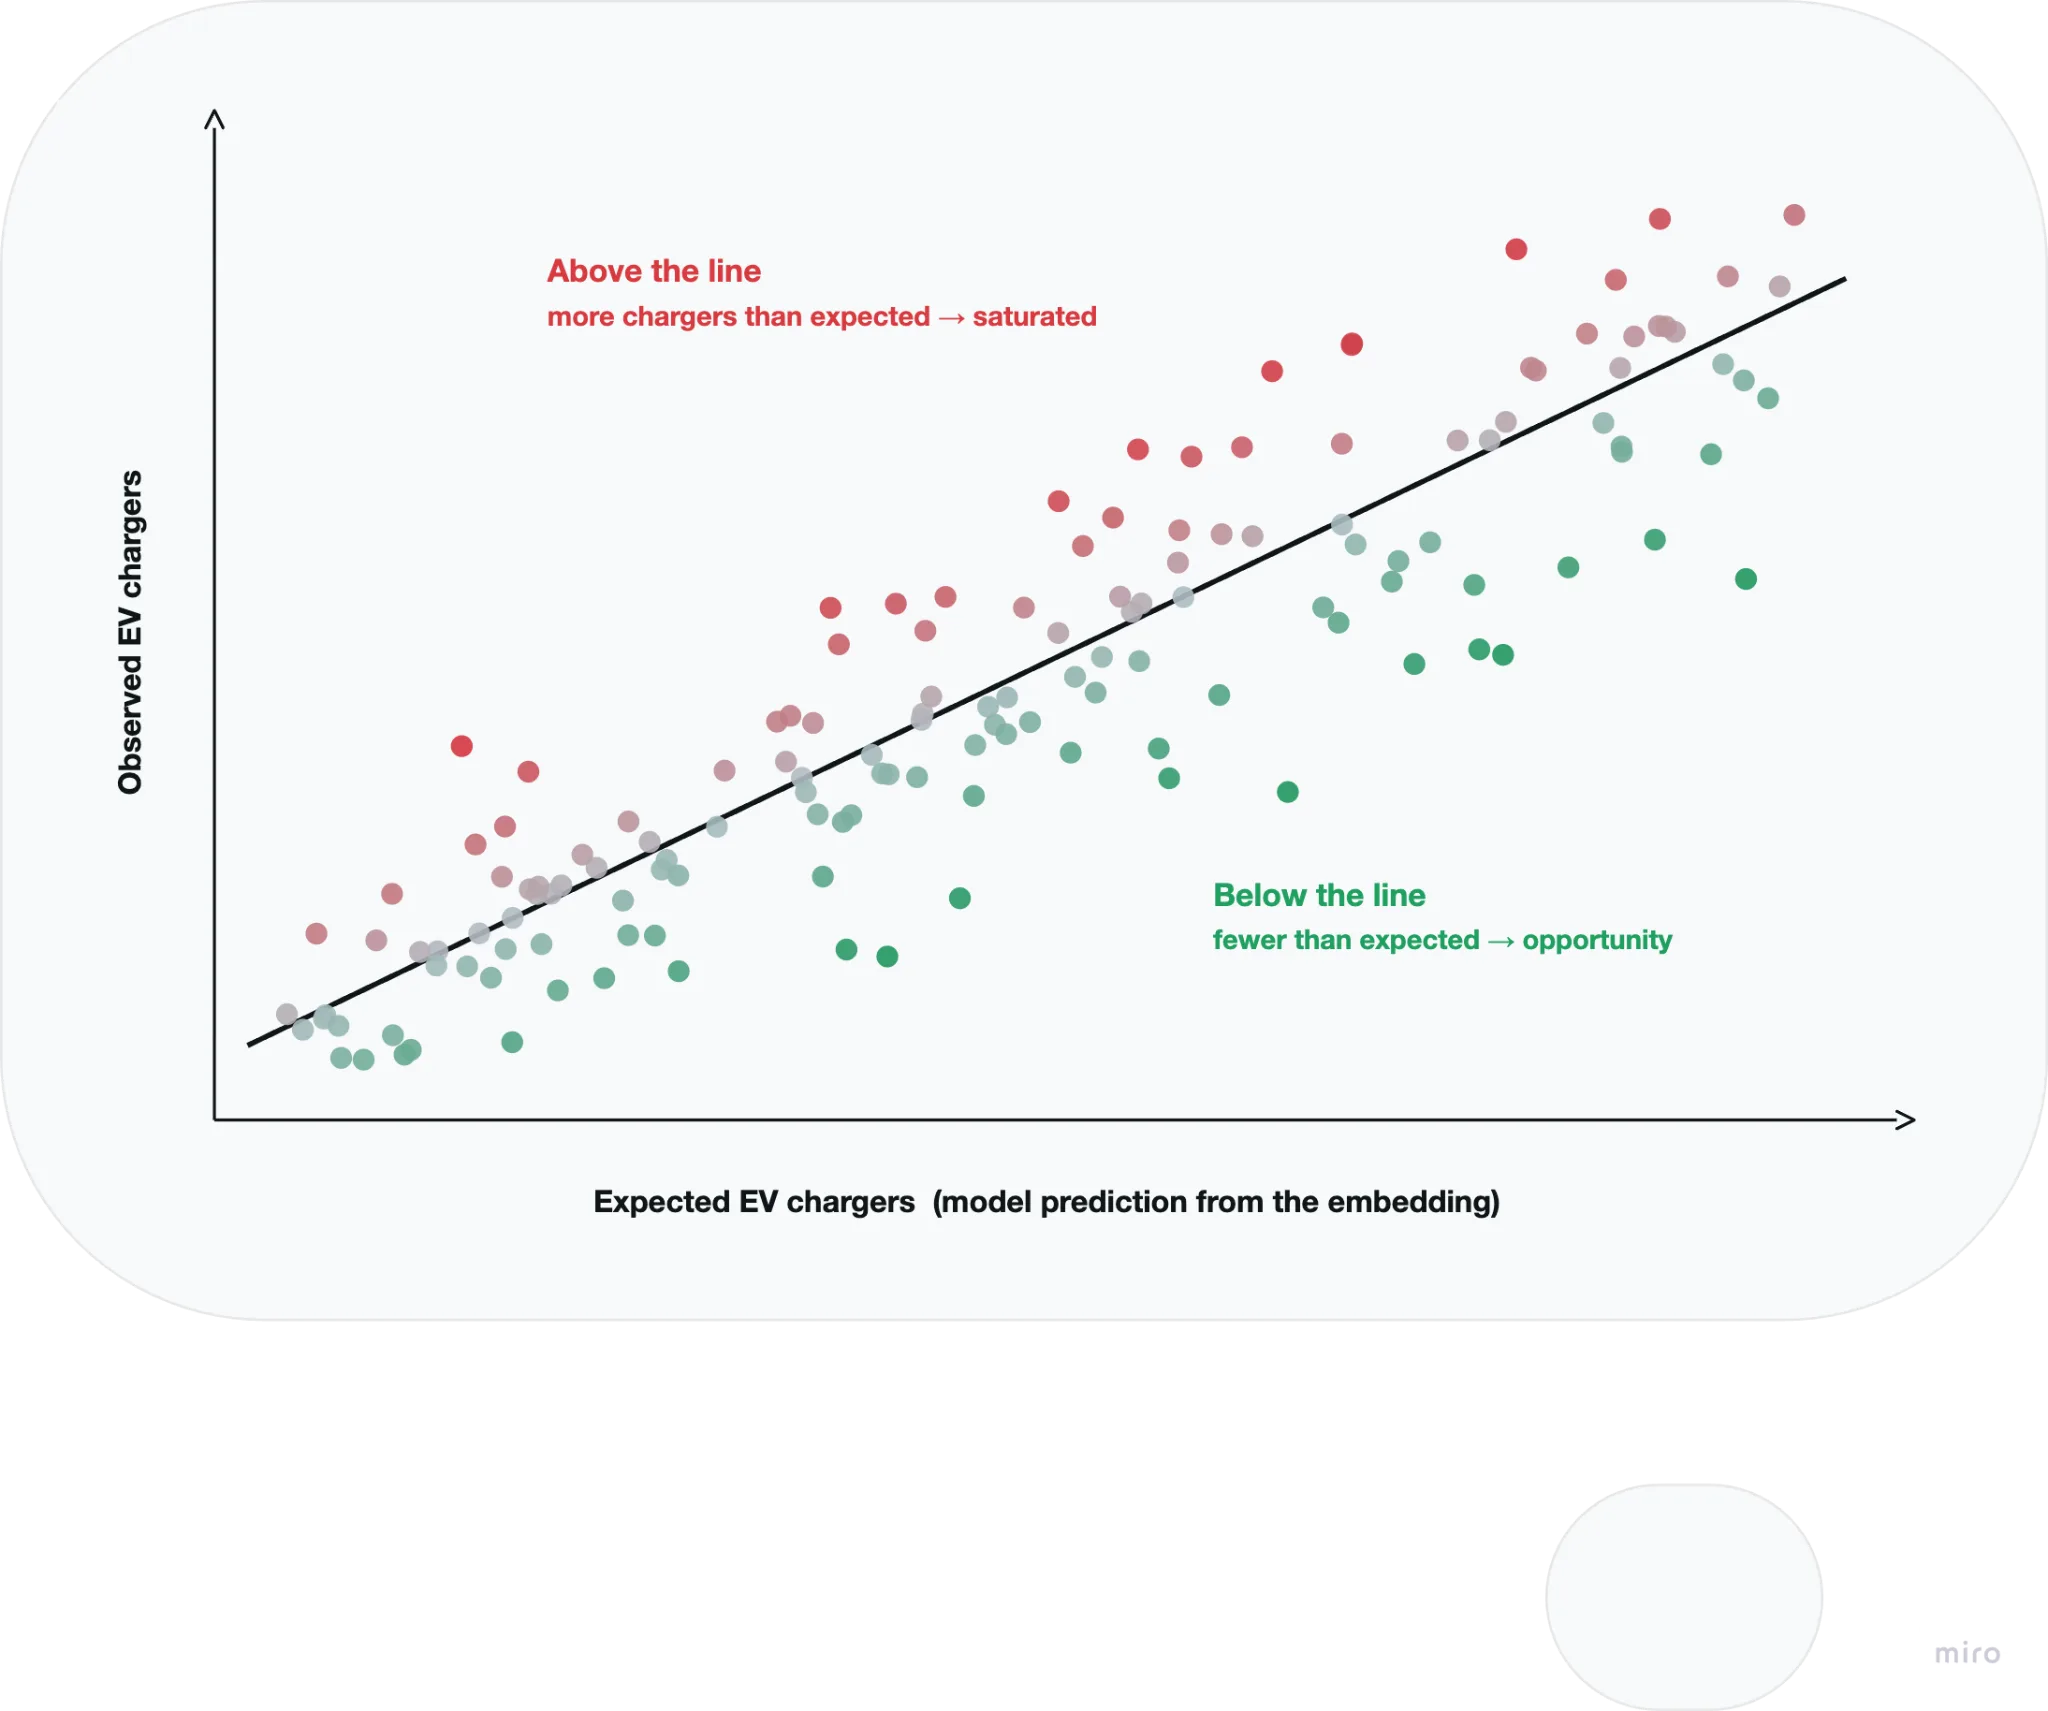
Thus, this approach highlights places where infrastructure and neighborhood characteristics are out of balance: this difference effectively becomes an opportunity score. Access this map to explore the results, where red cells on the left represent potentially oversaturated locations, while green cells are areas for potential expansion. These green areas may currently have few or no EV chargers, but their underlying structural characteristics resemble places that typically support more charging infrastructure.
Under-served and over-served area scores around Phoenix, AZ. Open it in full screen here.
Building the analysis workflow in CARTO
This entire analysis can be reproduced end-to-end inside CARTO. Using the Composite Score Supervised component in CARTO Workflows, PlacePulse Embeddings can be used directly as model features. After the model is trained, predictions can be generated at local or national scale and compared with observed charging infrastructure to identify areas where charger availability is lower than expected.
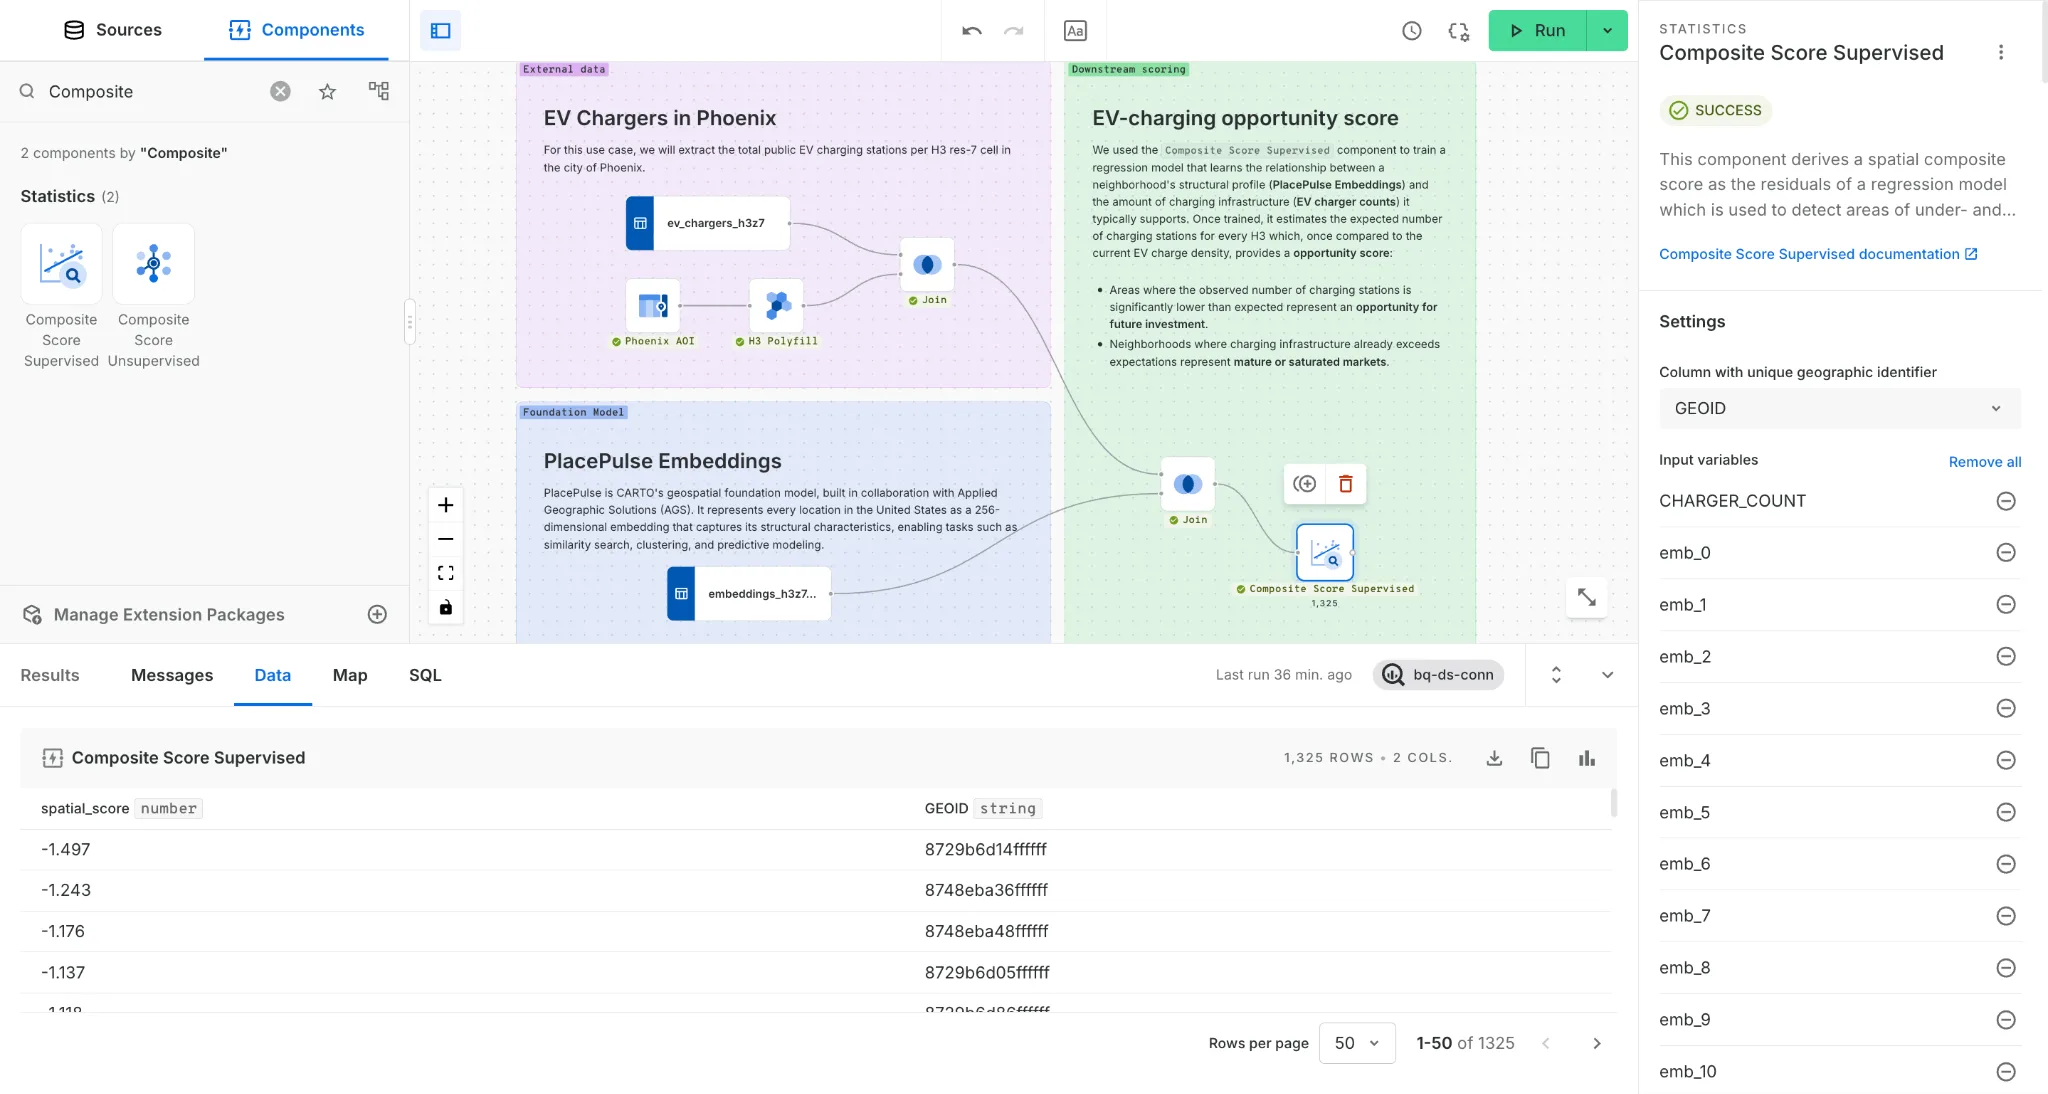
The result is a faster, reproducible, and easy-to-use pipeline for detecting potential EV charging infrastructure gaps at scale. It combines CARTO’s cloud-native analytics with the capabilities of a geospatial foundation model, so analysts can work at any scale and start from a single embedding that already captures the multidimensional profile of place. This is while running the full workflow, from modeling to visualization, all without leaving the cloud.
Using PlacePulse Embeddings beyond this EV charging hotspots example
While this example focuses on charging infrastructure, the workflow is much more general. Any spatial variable that depends on the structural characteristics of a place can be modeled in the same way. The same PlacePulse Embeddings can be reused to estimate broadband coverage, retail performance, health outcomes, infrastructure demand, or many other variables without rebuilding the underlying representation of place.
Ready to explore what PlacePulse Embeddings can reveal about your own data? Request early access and we’ll help you get started.