

40 Brilliant Open Data Projects Preparing Smart Cities for 2018


More and more local government agencies are turning to open data and Location Intelligence to optimize current services while also preparing more sustainable solutions in light of anticipated obstacles stemming from increased urban migration climate change and an aging population.
This form of city planning has invariably been described as smart intelligent responsive resilient and more recent senseable. But how do these initiatives use open data to address the concerns of residents? In answering this question we discovered projects whose originality left us speechless and dedication to social justice inspired.
We assembled a similar list last March for 2017 which you can find here.
The speed at which local officials in both urban and suburban areas are working with open location data to aid decision making required us to update our original list. We're delighted to see even more citizen centric smart city projects leveraging the tools and techniques of Location Intelligence.
The list is assembled both to recognize individual accomplishments and promote more work with open data! Again examples are categorized by service type and alphabetically listed because projects democratizing access to open data should be celebrated equally!
- Navigating Open Data Sources
- Transparency and Accountability
- Performance Management
- Transportation and Infrastructure
- Resilient City Planning
- The IoT of Smart Cities
- Civic Engagement
Want to leverage open data in this way?
Navigating Open Data Sources
Building an open data portal is expensive and returns on this investment can be difficult to measure. To ensure citizen engagement with open data portals city officials and third party partners are designing constituent-centric interfaces and applications. Here are our favorite web and mobile applications designed to help citizens navigate open data.
Check My Barangay
Check My Barangay a Making All Voices Count project is the latest project in President Aquino's commitment to ending corruption and poverty across the Philippines. Like several other entries on this list Check My Barangay signals a concerted effort from local governments to expand successful open data and smart city projects to more rural and suburban areas or in this case to Barangays the smallest governing unit in the Philippines. Citizens can now monitor budgeting and planning at a more granular level helping to increase citizen engagement and transparency simultaneously!
The National Address Base
France's National Address Base an open source database spearheaded by the General Secretariat for Modernization of Public Action (SGMAP) is a truly collaborative project. The database not only uses available open data from civil services and state agencies across France including IGN La Poste Etalab and OpenStreetMap France but it also invites citizens to contribute more accurate location data in an effort to improve emergency response times facilitate more efficient public/private partnerships and allow for more spatial analysis of under-utilized areas. All we can say: Aux armes citoyens!.
Open Data Barometer (ODB)
There's a lot of talk about the promise of open data projects but do they actually deliver? That is the question for the Open Data Barometer (ODB) a World Wide Web Foundation project rating governments across 115 jurisdictions on their open data project's readiness implementation and impact. The recent release of the ODB's fourth edition whose report found an overall lack of improvement in open data projects when compared with last year is a much needed call to action concerning the important work that remains to be done using open data.
** Open Government Partnership (OGP)**
The Open Government Partnership is a policy platform soliciting pledges from governments around the world to promote open and transparent governance. Began in 2011 by eight founding countries the OGP today includes 75 government members and 15 subnational governments from whom *2 500* commitments have been solicited promising more open and accountable governance. If the most recent Open Data Barometer reminded us of mistakes made in 2016 then the Open Government Partnership revives our hope for the 2017!
Urban Data Platform
The European Commission's Urban Data Platform is an open source tool facilitating data sharing and comparative research across the European Union. The platform's interactive data visualizations provide users with ample information on a range of topics that can be explored at both local and regional levels. Check it out!

Transparency and Accountability
Among the objectives for smart city projects is the goal to improve efficiency and these open data projects help citizens cut through bureaucratic red tape faster than ever.
America's Growing News Deserts
Many Americans are still trying to figure out what happened during the 2016 presidential election including the editors of the Columbia Journalism Review (CJR). In "America's Growing News Deserts " CJR editors initially built a data visualization identifying local newspaper offices across the country with data provided by Alliance for Audited Media (AAM). However as readers soon pointed out many more local newspapers nationwide had closed following the AAM's 2015 report. In response the editors turned to their fellow Americans to crowdsource more accurate location data related to subsequent closures across the country. A reminder that we really are stronger together.
Elapedia App
The Elapedia app a free Spanish-language app resulting from a joint venture between the Center for International Private Enterprise (CIPE) and the Governance Consultants aims to increase transparent corporate governance among the Pacific Alliance. The app makes use of public data from Latin American companies providing confidence to potential investors as well as transparency on public-private partnerships. "The Elapedia App is intended to promote transparency and accountability " states Andrew Wilson CIPE managing director "levels the playing field and encourages the disclosure or elimination of conflicts of interest."
Gender Digital Inclusion Map
EQUALS a global initiative promoting digital gender equality is amplifying women in tech around the world with its Gender Digital Inclusion Map. In collaboration with the United Nations Information and Communication Technologies (ITU) agency this open data project focuses on UN Sustainable Development Goal 5in its objective to close the gender digital divide by 2030.
Participatory Budgeting Map
Similar to Check My Barangay the Participatory Budgeting Project believes that community members should be involved in deciding how best to allocate public funding. The data visualization highlights current and past projects and conveys pertinent information about upcoming events. A great resource for keeping citizens engaged and informed.
Refugee Influx Trend
Built with open data from The UN Refugee Agency (UNHCR) the Uganda Refugee Response Portal provides a granular view of the impact that refugee migration has had upon Uganda. This is not only an important project using open data to raise awareness of this ongoing humanitarian crisis but also a brilliant demonstration of the granular insights to be found using spatial analysis.
Confused about how to get started?
Request a live personalized demo
Performance Management
Local governments have adopted and adapted the service industry's motto "The customer is always right " with the help of open data. Check out the examples below to see how open data ensures that the constituent is always right!
Child Welfare Digital Services Project
The Child Welfare Digital Services Project is not only a smart city project addressing social problems but it is also a pilot program for more agile open data practices. Unlike the state's past "predictive waterfall" approach an "adaptive agile" approach involves continuous planning based upon data analytics spatial analysis and machine learning. We're excited to see more open data projects addressing social issues by moving beyond a "one size fits all" model while addressing the specific needs of specific individuals.
Denver Peak Academy
Denver Colorado has officially leaned in to data-driven government with mobile and web apps like pocketgov denver but these projects are only as strong as the team behind the scenes. Denver Peak Academy is a training program for city employees to learn new tools and resource allowing the city to achieve "peak performance" in many of its open data smart city projects! Check out their blog to learn more!
Poverty in NYC
The Mayor's Office for Economic Opportunity (NYC Opportunity) built the Poverty in NYC map as a resource with which to better target and launch anti-poverty initiatives. Using open data from the New York City portion of the American Community Survey (ACS) as well as additional variables added by the Poverty Research Team this project further's the city's goal of making equity a core component of local government. A great example of open data being used to address social inequality. Check it out!
Savvy Citizen Alerts
What's novel about Management Science Associates (MSA) mobile app Savvy Citizen Alerts is its suburban focus on townships like Richland Pennsylvania that are looking to increase engagement with constituents by leveraging location data and smart devices like their urban counterparts. Glad to see more attention paid to rural areas when it comes to open data projects!
Smart Dublin
Did you hear the news? The Irish are going green thanks to Dublinked Ireland's open data platform for smart city project. The Dublin City Council has also prioritized projects that make use of sensors to enhance mobility energy and various operations throughout the city to help reduce the city's carbon footprint.
RTC Accident Prediction
The Regional Transportation Commission of Southern Nevada (RTC) is partnering with Waycare to combat traffic congestion using artificial intelligence. Instead of responding to traffic incidents that cause delays along state highways Nevada's Department of Transportation (NDOT) along with the state's Center for Advanced Mobility (NCAM)will pilot a program that uses predictive analytics to anticipate traffic congestion in order to provide commuters with alternate routes. We look forward to seeing how this first of its kind open data project turns out in the coming months.
Open Planetary Maps
This entry takes an admittedly long-term view when it comes to open data as it uses satellite imagery to map Mars. The project is only in its initial stages but we're already excited to see what kind of information it yields about the cities of tomorrowland.
Transportation and Infrastructure
Transportation and infrastructure form a city's lifeline which explains why open data advocates have focused heavily on these two areas. The projects below make use of open data and in some cases are literally changing what it means to be data-driven.
BlindSquare
Initiatives like Smart Cities For All have helped draw attention to the need for more inclusive smart city projects like BlindSquare. Using data from Foursquare and OpenStreetMap this navigation app provides audio directions for visually impaired residents to move around their cities more easily.
Connect 305
Similar to major metropolitan cities like New York Chicago and London the Mayor's Office of Miami-Dade County Florida in partnership with organizations including AT&T Cisco and Intel is launching Connect 305 a connectivity project that will install 305 Wi-Fi Kiosks across the county. The large scale of this undertaking is intended to better prepare the city for anticipated infrastructural pressures increased demand for city services and other operational issues due to rise in urban population resulting from climate change.
East Coast Greenway Map
The East Coast Greenway Alliance recently launched this web app that not only facilitates tourism but also promotes environmental conservation across 15 states and more than 450 cities and towns along the United States eastern seaboard. The interactive data visualization allows visitors to map the best hiking trails and bike routes all along the greenway starting at any entry. Check it out!
Unmanned Traffic Management (UTM) Initiative
The Kansas Department of Transportation (KDOT) is taking to the skies with aerial drones to help local officials manage traffic congestion. In a first of its kind partnership KDOT and AirMap are working together to use drones across the state to optimize disaster recovery emergency response time agriculture construction and much more. We're excited to see how this project evolves throughout 2018!
Map Matching
Mapzen is innovating data-driven navigation with its newest mobility services offering Map Matching. With this mobility app users can enter their destination's coordinates and be matched not only with a route snapped on to an OpenStreetMap but also be provided with an enriched routes signaling pre-selected attributes such as speed limits and freeway exit signs. A great use of open data to confront mobility issues!
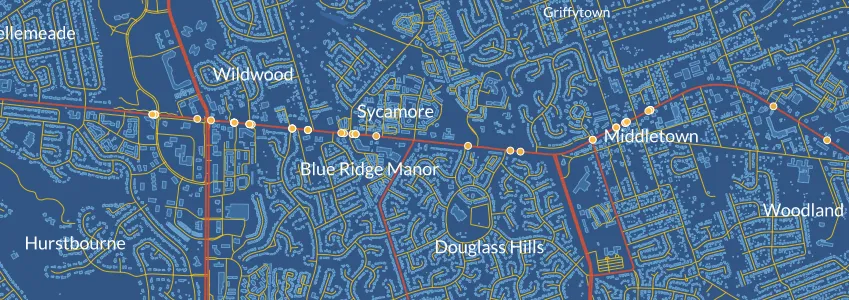
Turnaround: Fixing New York City's Buses
The Bus Turnaround Coalition with support from the TransitCenter and the Riders Alliance is using open data to raise awareness about the state of New York City's bus system. Although nearly 2.5 million rider take the bus each day and despite an ever-growing residential population the city has not made the necessary updates to the system to maintain optimal service. As such the Bus Turnaround Coalition has assigned each route a report card using MTA Bus time data reflecting speed accuracy and ridership volume among other factors to help local official prioritize their response.
WECC Environmental Data Viewer
The Western Electricity Coordinating Council (WECC) is a nonprofit organization maintaining a massive electric system across the Western Interconnection a geographic area comprised of two Canadian provinces 14 U.S. states and Northern Baja Mexico. The WECC Environmental Data Viewer is an interactive data visualization of the area built with open data provided by participating government agencies which was spearheaded by Nevada's State Historic Preservation Office the Utah Department of Heritage and Arts but also includes open data from participating state including Wyoming Colorado and Washington. A great web mapping application providing access to environmental and cultural risk classification across the Western Connection to facilitate regional expansion projects across city state regional and even national borders.
Who Owns What (W.O.W.) Boston
This Analyze Boston project began with one main question: was it possible to see a "renter class" becoming an "owner class" in the city of Boston? But once Alex Dillon and Joana Abreu started mapping Boston Property Assessment data they soon realized that visualizing one simple relationship--who owns what--provided insights into patterns and trends shaping the entire city. A great reminder of the insights that can be extracted by examining location with spatial analysis!
Missing spatial data?
Check out our Spatial Data Catalog with over 5 000 datasets!
Resilient City Planning
Climate change has helped accelerate the rate of urban migration. The examples below highlight cross-sector partnerships using open and public data to better prepare cities around the world to confront the challenges ahead.
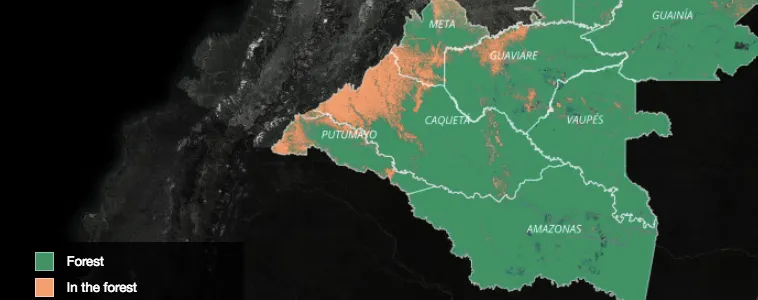
InfoAmazonia Colombia
The InfoAmazonia Colombia platform is a transparency tool to help Colombian officials reduce forest clearing to zero net levels by 2030 as part of the country's Amazon Vision Program. The platform uses open data from satellite information the Institute of Hydrology Meteorology and Environmental Studies (IDEAM) and data crowdsourced from data journalists. This transparency platform alerts citizens to new construction projects threatening the Amazon's ecosystem helping ensure smarter healthier alternatives for cities and rain forests alike.
EnergyBlock
Copenhagen Solutions Lab is pioneering sustainability efforts with its latest smart city project. EnergyBlock will use sensors to monitor energy production levels as well as local food production in rooftop greenhouses and gardens across Copenhagen's "Nordvest" area. The data from these sensors will be shared via Copenhagen's open data portal in an attempt to showcase renewable energy sources available within existing urban areas.
Juntos Santiago
Santiago Salud is using gamification to tackle Santiago’s obesity problem. Chile ranks fifth highest in obesity among nations worldwide leading Mayor Felipe Alessandri and his office to propose Juntos Santiagos a competitive game rewarding teams of school-aged children collectively showing signs of healthier diets and more exercise. The project a 2016 winner of the Bloomberg's Mayor's Challenge will crowdsource data from participating teams and share the results in an going effort to promote a healthier more active style of living to school age children.
Open Agriculture Initiative (OpenAg)
Open Agriculture is the latest project coming from the MIT Media Labaiming to create an open-sourced food technologies ecosystem for a healthier smarter tomorrow. Like EnergyBlock OpenAg seeks to find smarter uses of urban areas in order to increase local food production within Food Data Centersthat will help the reduce carbon imprint left from global food transportation.
Smart Fintry
Like previous entries included on this list like Savvy Citizen Alerts and Check My Barangay Smart Fintry is bringing urban innovation to more suburban areas like Scottland's Stirlingshire Village. In fact the village's open data portal and interactive energy dashboard hold the distinct honor of being the United Kingdom's first "smart" village as local officials experiment with new ways of delivering electricity to the village from nearby renewable sources.
Baltimore Open Air Project
This project is using open data insights to combat environmental racism drawing upon citizen scientists to help place sensors throughout Baltimore Maryland. In partnership with researchers at Johns Hopkins University citizens and scientists alike are placing throughout the city WeatherCube calibrated sensors that will post daily findings related to the city's temperature humidity ozone and nitrogen dioxide in an effort to reduce air pollution. A great project aiming to bridge the city's digital divide while ensuring a healthier city for all residents.
Want to give this a go?
Sign up for a totally free account
The IoT of Smart Cities
Recent efforts to improve smart city grids and networks has led to the creation of sensor networks capable of monitoring a range of issues impacting residential living conditions. The Internet of Things (IoT)has enabled local officials to connect various devices throught the city to this type of sensor network which some are calling Smart City 2.0.
Bike Ridership Data
The San Francisco Municipal Transportation Agency (SFMTA) tracks biker ridership volumes at key intersections throughout the city to support efforts to promote various modes of transportation beyond motor vehicles. To accommodate the anticipated 100 000 additional residents in the Bay Area by 2040 the need to address traffic congestion is not only a matter of avoiding gridlock but also of reducing air pollution and improving the health of the city in general. Another example of open data projects making cities healthier and smarter.
Public Works Traffic
The city of Louisville Kentucky has launched an open data portal as part of its "open by default" approach to smart local governance. More recently the city has implemented a smart traffic management system across the Metro area aimed at fighting traffic congestion through the city the Public Works traffic team is leveraging open data on commute behaviors and building interactive data visualizations to discover viable alternate solutions to a host of issues from traffic congestion to increasing citywide connectivity without using expensive fiberoptic cable. Check it out!
SacPark
Many of our entries have addressed traffic congestion issues but the city of Sacramento California has recently debuted a new solution on how best to handle the volume of cars looking to park each day. SacPark a web and mobile app built with Parking Panda software relies on a network of citywide sensors providing real-time data updates to users on parking availability inside city garages and along parking meters throughout Sacramento.
Want to see how this might apply for your project?
Request a free no pressure demo!
Civic Engagement
Access to open data has helped bridge the information gap between elected officials and their constituents. But what else can citizens do with open data to improve their neighborhoods communities and cities? Well as the examples below demonstrate a lot!
City Maps from Tourists Feelings
We've shared stories about AirBnB in cities around the world such as New York Madrid and Barcelona and New Orleans but these projects tend to address the company’s impact on each city from a residential perspective. Beñat Arregi's new project instead maps cities from the perception of the visiting tourists using data available from Inside AirBnB. Check out what tourists think of your city's offering as each location is rated on a scale from 1-5 and plotted on an interactive data visualization.
Dismantling Structural School Segregation in Seattle
Sightline Institute an independent nonprofit promoting sustainability projects at the intersection of environmental activism and social justice has been publishing data-driven investigations of infrastructural issues across Seattle Washington. Whether examining past and present housing trends or a history of structural inequality that still contributes to school segregation Sightline research associates like Margaret Morales are using open data interactive maps and current research findings to keep Seattle citizens informed about their city. Check it out!
Museum Stat
Did you know open data could be used for philanthropic endeavors? Museum Stat the result of a collaboration between the Institute of Museum and Library Services and Drexel University is an online platform to support museums communities and researchers across the country using open data from the Museum Universe Data File (MUDF). This is a great resource bringing together various sectors to facilitate more outreach casemaking for grant writers and a tool to measure the impact of the arts on individual communities as well as the nation as a whole.
Surveillance under Surveillance
This interactive data visualization provides an answer to the question "Who watches the watchmen? " as it crowdsources data related to the location of surveillance technologies in cities around the world to build an interactive map disclosing this information. This project gives a whole new meaning to transparency. Check it out!
Trash City
How can your city plan in advance to minimize the impact of disruptions that seem to happen on an annual basis? That's the question at the heart of Trash City a story map exploring the chaos wrought upon Boston's city services each year when more than 160 000 college students move into dorms throughout beantown. Open data projects are great for optimizing day to day city operations but as this project demonstrates they can also help local officials anticipate annual events requiring increases in services. Leveraging data from housing rentals trash volume and pick up frequency and available data on 311 complaints Jim Haddadin built an interactive data map showcasing how this influx in city residents disrupts the lives of Bostonians while also reminding local officials to plan ahead.
Whose Heritage? Public Symbols of the Confederacy
The Southern Poverty Law Center (SPLC) published "Whose Heritage? Public Symbols of the Confederacy" in April 2017. But after the shocking events in Charlottesville Virginia this past August the report along with its interactive data visualization plotting each and every Confederate monument across the United States received renewed attention. Built with open data from federal databases including U. S. Geological Survey (USGS) the National Center for Education Statistics (NCES) the National Park Services and the National Register of Historic Places the SPLC's data visualization is a great example of peaceful powerful protest using open data. Check it out!
We hope you enjoyed this list and if we missed any noteworthy open data projects for smart cities then let us know on our Facebook Twitter or LinkedIn page!
Harnessing the Power of Location Intelligence for Cities
Watch our pre-recorded webinar about innovative smart city projects powered by Location Intelligence from Jaime de Mora our Global Sales Director!


