From embeddings to spatial insights: Five new tools in CARTO Workflows


Which locations stand out from the rest of your portfolio? Where does a neighborhood’s character change from one block to the next? And how can you capture the shared characteristics of several markets to find others like them?
Today, we’re adding five new components to CARTO Workflows to help you answer these questions with Geospatial Foundation Model embeddings.
Think of an embedding as a digital fingerprint of a place: a compact representation of its characteristics that you can use to compare and analyze locations. In our first release, we introduced tools to visualize these fingerprints, group similar places, find lookalikes, and detect changes over time.
This release builds on those capabilities. You can now identify unusual locations, explore differences between neighboring areas, and create profiles for the markets and territories your team works with. It all runs directly in your cloud data warehouse.
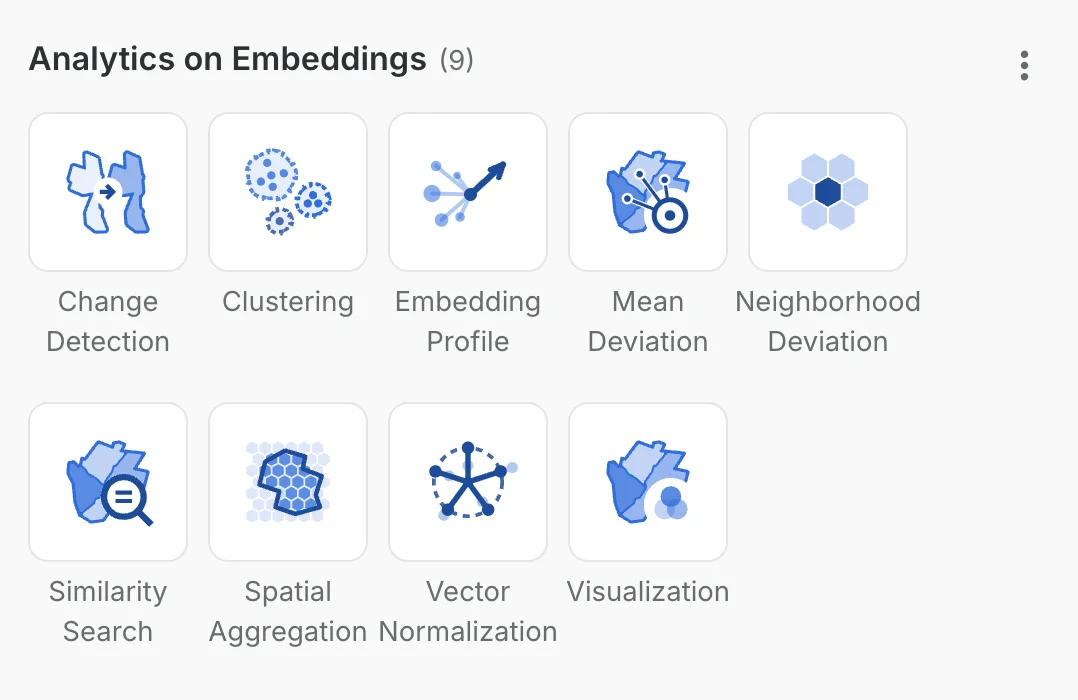
What’s new in the Analytics on Embeddings Extension Package
This release adds five new components to the Analytics on Embeddings Extension Package:
- Embedding Profile. Combines multiple embeddings into one optionally weighted profile vector per ID, ready for similarity search, clustering, or change detection.
- Mean Deviation. Scores each location against the mean embedding, globally, by group, or by period. Useful for finding anomalies or the most representative locations.
- Neighborhood Deviation. Measures the kernel-weighted dissimilarity between each grid cell and its k-ring neighbors (only valid for spatial-indexed geo-embeddings), highlighting boundaries, gradients, and local heterogeneity.
- Spatial Aggregation. Area-weighted aggregation of embeddings onto a target polygon set, with options for mean, max, min, standard deviation, or the embedding with the largest overlap. Use it to translate embeddings to the geographic support that suits a specific use case.
- Vector Normalization. Rescales vectors to unit length while preserving direction, making them suitable for Dot product similarity.
The Visualization component also gains a Color mapping parameter. Alongside the existing RGB mode, Bivariate cuts two components into terciles and crosses them into a nine-class map, with a categorical label from Low-Low to High-High and a matching two-hue palette.
Exploring the new embedding capabilities
These new capabilities open up a broader set of ways to work with geo-embeddings: from measuring how unusual a place is, to quantifying local heterogeneity, to summarizing embeddings at the geographic level your business actually operates on. Here are three examples that show what these operations make possible in practice.
Assessing a retail catchment area
Retail teams already use embeddings to compare candidate sites with their best-performing stores. Mean Deviation turns that question around: instead of comparing a location with a chosen reference, it measures how far it is from the average.
Take a brand with stores across a region. For each store, we defined its trade area as the area reachable within a 10-minute drive with the Create H3 Isochrones component, and described the (H3 resolution 7 cell) locations within it using PlacePulse Embeddings. Mean Deviation lets us look at these catchments in two ways. Against a global mean, the score shows which locations are most different from the brand’s overall customer profile. Against a mean per store, it shows how consistent each individual catchment is with its own store profile.
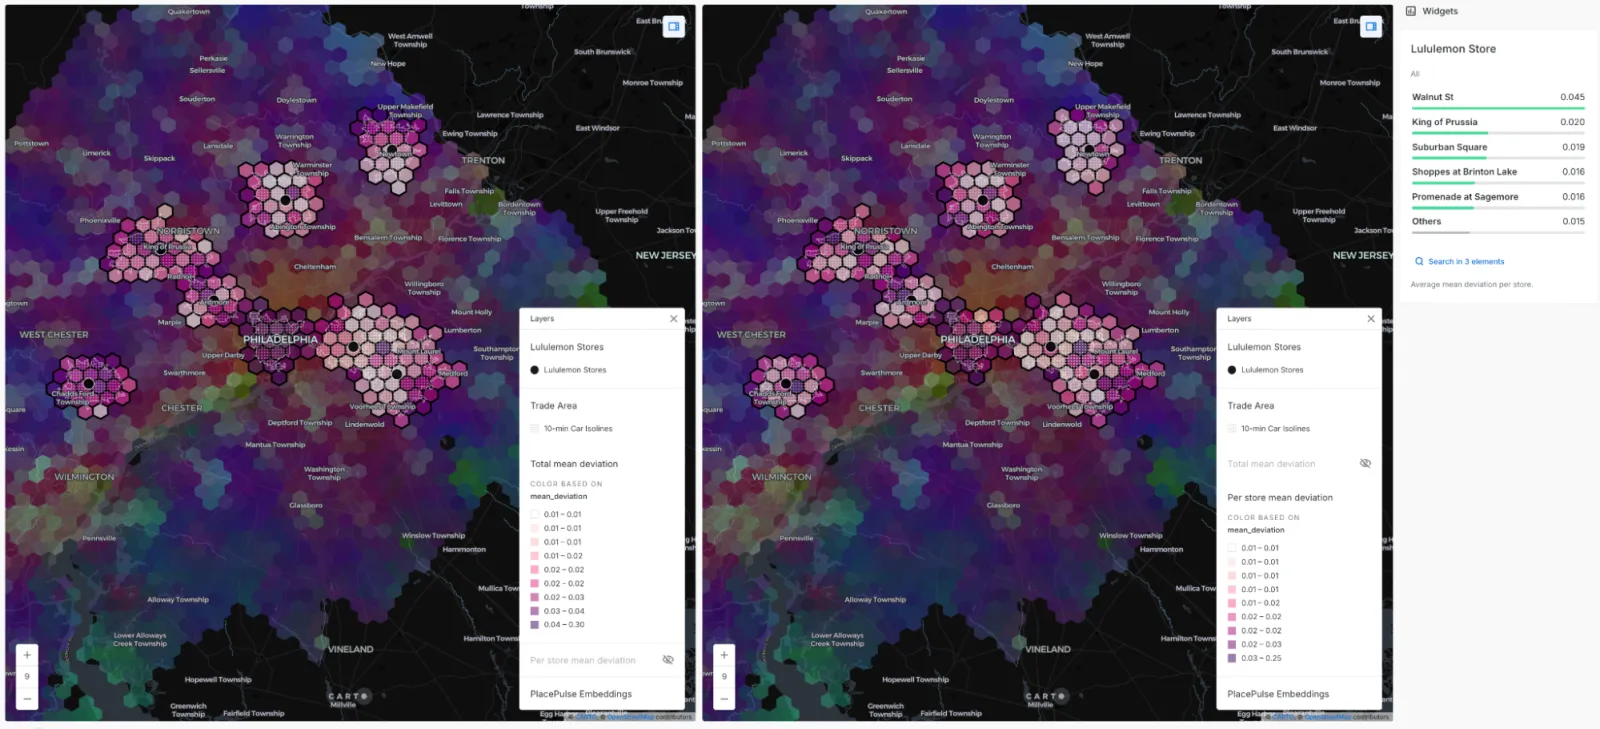
Illustrative example using simulated Lululemon trade areas in Philadelphia, scored against a global brand profile and against each store's own profile. Open it in full screen here.
Putting the two views together in the map above reveals something a single comparison can miss: two stores can both look typical for the brand while having very different internal catchment profiles. That distinction can help inform assortment, media planning, and decisions about how transferable a store’s performance is to other locations.
Mapping urban heterogeneity over time
Mean Deviation compares a location against an average. Neighborhood Deviation compares it against its immediate surroundings, which measures something else entirely: how mixed a place is.
We used the Satellite Embeddings component to extract H3 resolution 10 AlphaEarth embeddings across Madrid. We then applied Neighborhood Deviation to measure how different each cell is from its immediate k-ring neighbors, and used spatio-temporal Getis-Ord to statistically track how these patterns change over time.
The results highlight clear differences across the city. El Retiro scores high because vegetation, paths, roads, buildings, and water create a varied mix of neighboring cells. El Pardo scores low across its continuous forest, while central Madrid also scores low, but for the opposite reason: dense urban blocks produce a relatively uniform landscape. The temporal view adds another dimension. In Vallecas, heterogeneity increases over the years as new development introduces more variation into an area that was previously more uniform. We also used the new Bivariate color mapping to show the embedding composition and heterogeneity together.
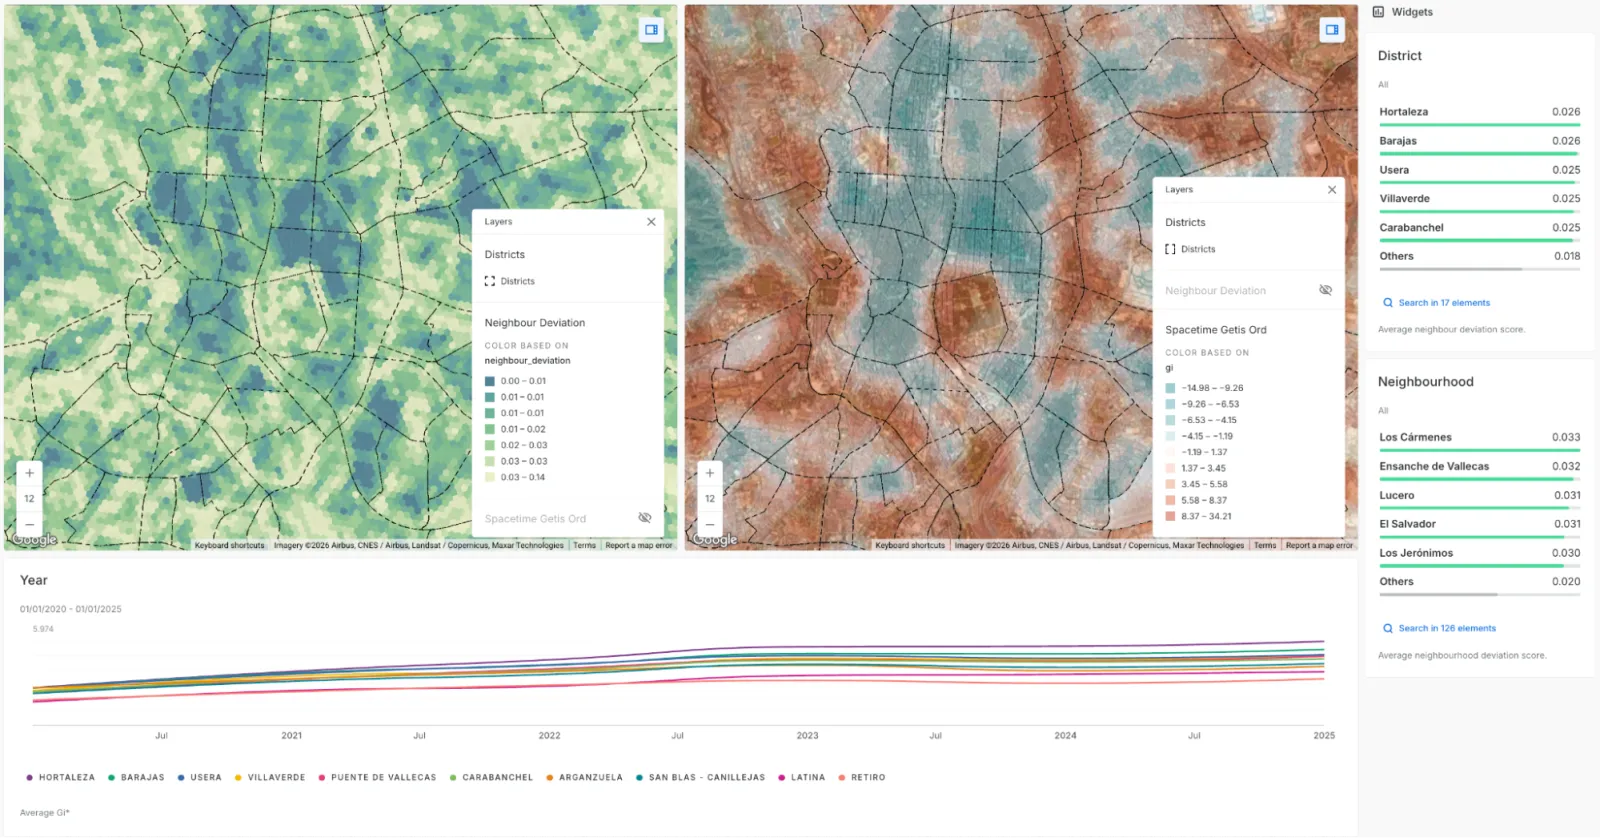
Urban heterogeneity across Madrid measured from AlphaEarth embeddings. Open it in full screen here.
For urban planners, this provides a way to measure and monitor how the physical character of an area changes, rather than relying only on individual land-use categories. It can help planners identify where development is changing the urban fabric and where interventions may need to preserve or introduce diversity.
Exploring new insurance markets
PlacePulse Embeddings are published on an H3 grid, while insurance portfolios are organized around ZIP codes. We first used Spatial Aggregation to bring the embeddings to the ZIP-code level, creating a market-level representation that could be compared across geographies.
Using a simulated insurance portfolio, we then selected the strongest policyholder markets in California and used Embedding Profile to create a single profile vector for these markets, weighted by per-capita emergency department visits (provided by Applied Geographic Solutions). This profile captures the characteristics of the markets where the insurer has its strongest presence.
Finally, we used Similarity Search to search across ZIP codes in New York and identify the 100 markets most similar to that California profile. The result is a shortlist of potential markets that resemble the insurer’s strongest existing markets, not just on one demographic variable, but across the multidimensional characteristics captured by the embeddings.
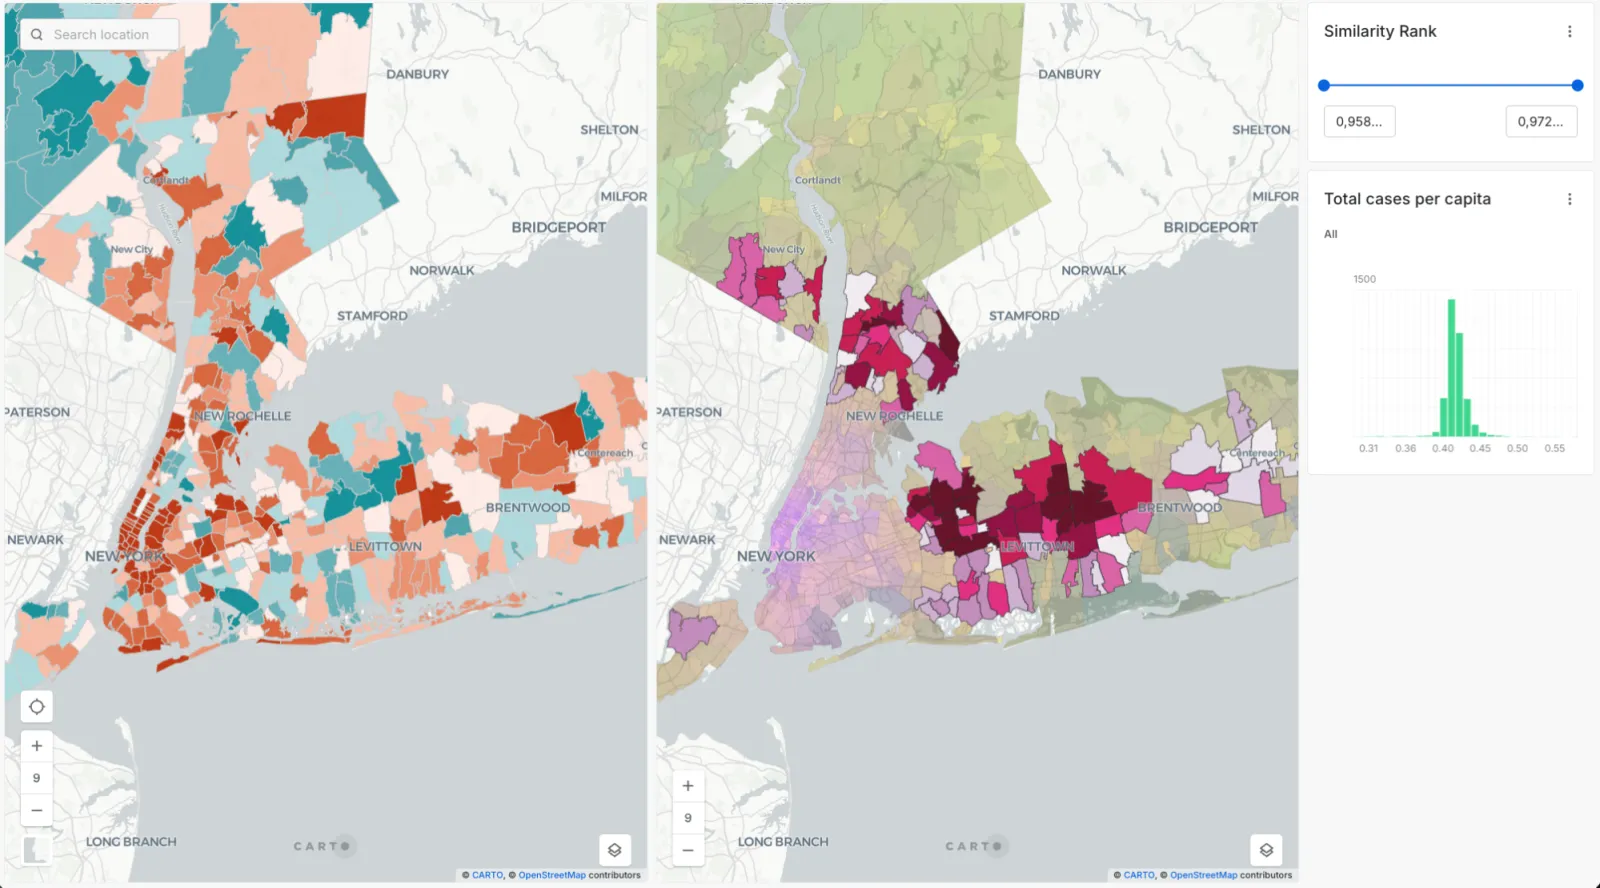
Illustrative example using simulated insurance portfolio data: ZCTA (Zip Code Tabulation Area) level PlacePulse embeddings used to find structural twins of reference insurance markets. Open it in full screen here.
By learning what the insurer’s strongest markets have in common, this workflow helps uncover new markets with similar potential and turn those insights into a more targeted expansion strategy. Combining the top 100 markets with per-capita data in New York adds local context, helping insurers prioritize opportunities and tailor policies to the characteristics of each market.
One more thing: unit-length vectors
Vector Normalization is the smallest of the new components, but it plays an important role in making the new capabilities work together. Several components in the extension can use the Dot product to measure similarity or distance.
For unit-length vectors, the Dot product is equivalent to Cosine similarity. This matters when working with large numbers of embeddings: instead of calculating vector magnitudes every time a similarity or distance is computed, you can normalize the vectors once and use the faster, simpler Dot product operation. The more comparisons you perform, the more useful this becomes.
Ask harder questions of your embeddings
Embeddings are only as useful as the operations you can run on them. With deviation scoring, aggregation across geographies, profile vectors, and bivariate mapping now in CARTO Workflows, the questions you can put to a foundation model go well beyond finding lookalikes. Have a look at the Analytics on Embeddings documentation to see the full parameter set for each component.
Want to see this on your own data? Request a demo.
Frequently Asked Questions
What is a Geospatial Foundation Model?
Unlike traditional models, which are built for a single purpose from a handful of carefully chosen datasets, foundation models are pre-trained on large amounts of data and can be adapted to many different tasks. Rather than producing a prediction directly, they learn a general representation of their inputs.
What is a geo-embedding?
A geo-embedding is a compact vector that acts as a digital fingerprint of a place, capturing its overall character. Places with similar demographics, economies, built environments or environmental conditions end up with similar vectors, while places that differ end up farther apart in the vector space.
What are PlacePulse Embeddings?
PlacePulse is a geospatial foundation model from CARTO and Applied Geographic Solutions (AGS). It encodes the structural profile of every US location into a single 256-dimensional vector, built from AGS demographic, economic, built-environment and climate data across 1.06 million H3 resolution 7 cells.
What are AlphaEarth Satellite Embeddings?
AlphaEarth Satellite Embeddings are a condensed, high-dimensional numerical representation of the Earth’s surface developed by Google DeepMind. They are derived from multi-source remote sensing data and capture key environmental patterns, which makes it possible to explore and compare locations across the Earth’s surface.
What is the Analytics on Embeddings Extension Package?
It is an extension package for CARTO Workflows that provides components to analyze, cluster, compare and visualize high-dimensional embeddings from spatial data, satellite imagery or any other geospatial source. It now includes Embedding Profile, Mean Deviation, Neighborhood Deviation, Spatial Aggregation and Vector Normalization alongside the existing components.
What is the Geospatial Foundation Models Extension Package?
It is a CARTO Workflows extension package for accessing embeddings from third-party open source geospatial foundation models, such as AlphaEarth Satellite Embeddings, so they can be used directly in your workflows.