

Geospatial AI and Analytics for Proactive, Safer Government


Geospatial data is everywhere. It flows from traffic sensors, connected vehicles, satellites, and mobile devices: a continuous, real-time picture of the world. State DOTs, city planning departments, and county agencies are sitting on more data than ever before. And they’re making critical decisions that impact millions of residents.
For many state and local agencies today, public responsibility moves faster than public data. Fragmented departments, siloed data storage, and shrinking budgets create the hurdles that turn data visibility into a big black hole. Governments are investing in cloud-based data warehouses and analytics tools, but geospatial too often sits outside that investment, locked in expensive desktop software or specialist queues. The bottleneck isn’t talent. It’s access and, increasingly, affordability.
The hidden cost of slow data
The cost isn’t always visible in budgets or headlines. But talk to GIS teams, agency directors, and communications leads across state and local government, and three patterns emerge consistently; patterns that prevent even well-resourced agencies from making the most of the data they already have:
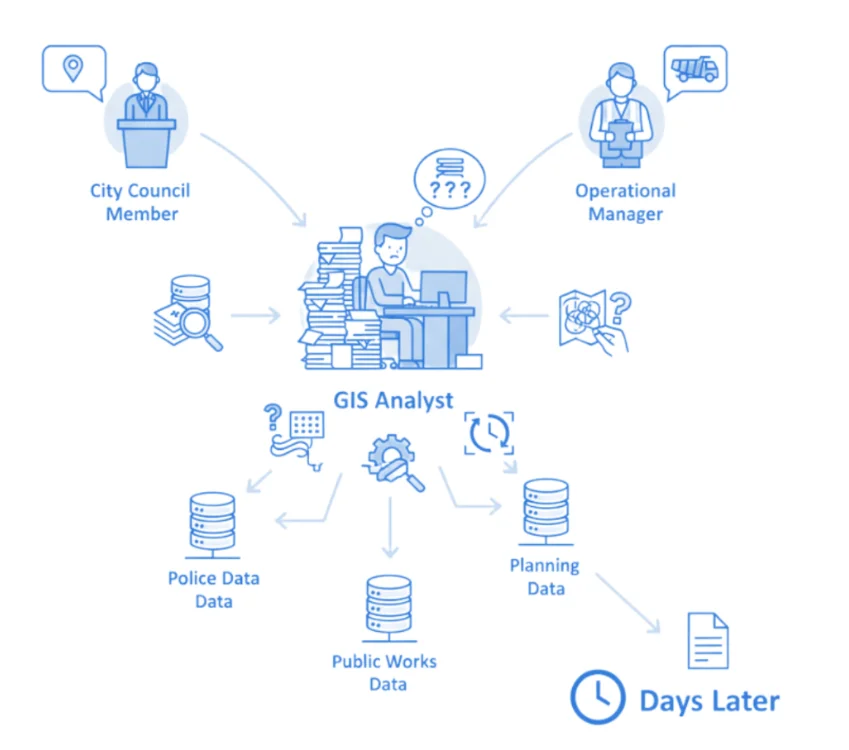
Public trust is fragile. When a headline breaks, agencies need to respond with data now, not in three days. Teams relying on outdated desktop tools are forced to react slowly, or not at all.
High-stakes decisions get delayed. Too many agency leaders today cannot self-serve on spatial insight. The request sits in a specialist’s queue, and by the time it comes back, the moment for action may have passed, or worse, a decision was made without it.
Expert capacity is being wasted. Skilled GIS analysts and data scientists are buried under a mountain of routine reporting. They’re reactive report-builders instead of the proactive strategists that high-stakes public sector decisions actually require. For agencies facing hiring freezes or flat headcount, that wasted capacity is a real, measurable cost.
The good news: three converging forces are making this pressing issue solvable.
Three trends reshaping what’s possible
The proliferation of remote sensors. Cameras, connected vehicles, IoT devices, and environmental monitors are generating a continuous stream of real-world location data at massive scale, creating what amounts to a hyper-localized digital twin of the physical world. For transportation planners and GIS managers, this means moving beyond periodic traffic counts and manual field surveys. Real-world conditions are now continuously observable, without deploying additional hardware.
Hyper-localization. Geospatial data is no longer just about broad regional patterns. It’s about what’s happening on a specific street segment, at a specific hour, with specific consequences for citizens. For city planners, that granularity means development impact assessments grounded in actual observed behavior. For project managers, it means pinpointing exactly where a problem is occurring and reporting on it in real time.
Generative AI. For the first time, AI enables non-technical users to ask questions of complex spatial datasets in plain language and get answers, without writing SQL or commissioning a custom map. For GIS managers, this is transformative: routine requests get answered by the people who asked them, freeing GIS teams to focus on the high-complexity analysis they were hired to do.
Together, these forces are opening the door to a fundamentally different model of state and local government operations: one that is predictive rather than reactive.
“With the enhancement of computer technology on the cloud, analytics is just becoming more and more powerful. It’s becoming more real-time. More streaming analytics is leading to many more possibilities and analytics use cases for the public good."
-Dilip Krishna, CTO of Sustainability at Deloitte
Want to see how spatial analytics is reshaping the public sector and beyond? Download the State of Spatial Analytics 2026 report for the latest trends, use cases, and insights from the field.

Proactive transportation planning and road safety
Roads are where the stakes of public sector decision-making become most visible. Every year, road crashes claim over 1 million lives and leave 50 million people injured, most of them preventable. Drivers in major cities lose more than 100 hours a year sitting in traffic. And transportation is responsible for roughly a quarter of all energy-related greenhouse gas emissions. For the state DOTs and city transportation departments tasked with managing road networks, these numbers aren’t background context. They’re the scorecard. And better location data is one of the most direct levers available to move them.
What makes road management particularly difficult is scale. A city or state DOT may be responsible for thousands of road segments, each with its own traffic patterns, infrastructure condition, and safety profile. Monitoring that network meaningfully has historically required expensive hardware, manual field surveys, or third-party data that arrives days after the fact. The result is a sector that spends far more time reacting to incidents than preventing them.
Google Roads Management Insights
One of the most significant recent developments in this space is Google’s Roads Management Insights (RMI), a product that gives road authorities direct access to Google’s first-party traffic data at scale. Built on the same Routes API that powers Google Maps, RMI lets agencies subscribe to tens of thousands of route segments, with data flowing into BigQuery at two-minute intervals for real-time use and retained for up to 10 years for historical analysis. Agencies like Colorado’s Department of Transportation have used RMI to monitor the I-70 corridor, with data accessible directly in BigQuery or pushed via Pub/Sub into existing traffic management systems.
Meeting that challenge requires two types of intelligence working in parallel.
Historic pattern analysis reveals where congestion consistently builds, where incidents cluster by time of day or weather conditions, and where infrastructure investments will have the greatest long-term impact. RMI’s 10-year data retention makes this kind of longitudinal analysis possible at a scale previously out of reach for most agencies.
Real-time situational awareness gives road managers visibility into developing situations as they happen. RMI’s two-minute interval updates let them see how traffic is backing up around a construction zone or incident and take action before a bad situation becomes dangerous.
When this data is stored in a cloud-scale data warehouse like BigQuery, it becomes analyzable at scale, combinable with other datasets (weather, crash records, school locations, utility infrastructure), and queryable by both humans and AI agents. Learn more about the geospatial AI capabilities announced at Google Cloud Next ‘26.
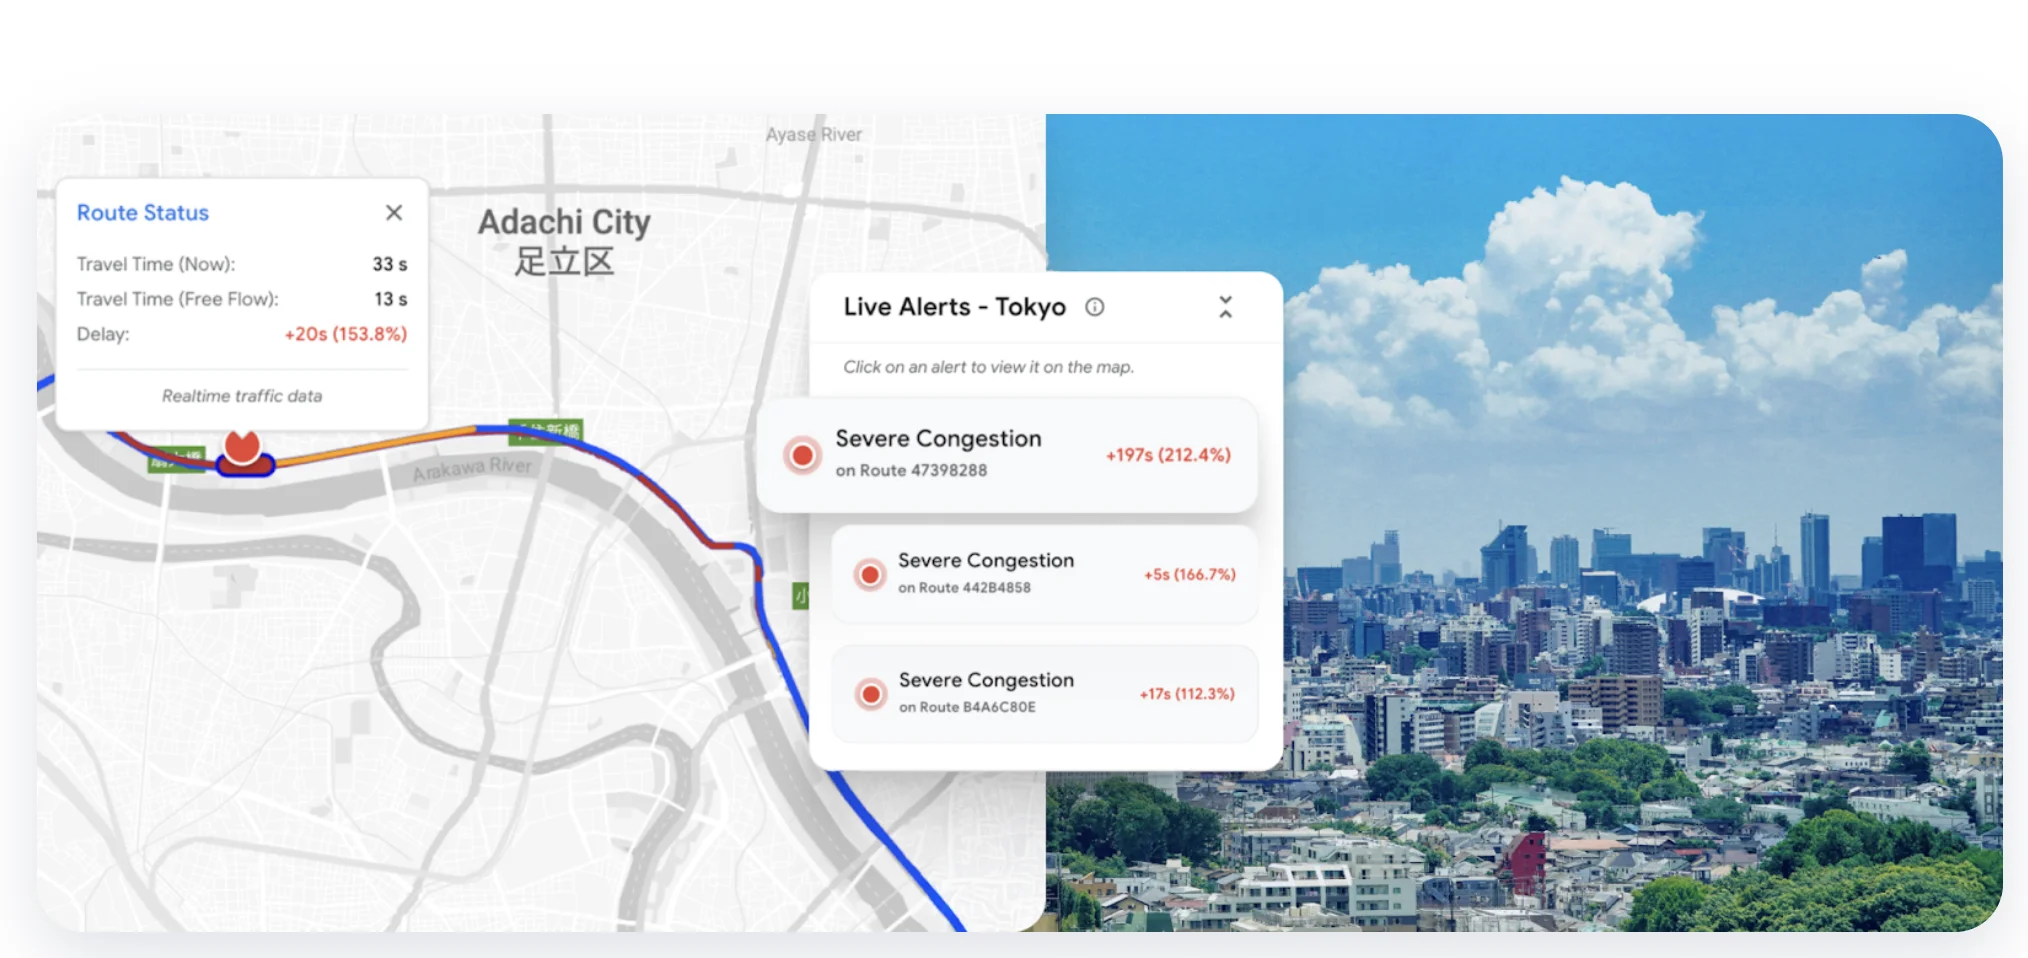
Source: Google Maps Platform
The goal isn’t to turn every city planner or project manager into a GIS analyst. It’s to give them access to the insights that GIS produces, at the speed decisions actually require. That’s the problem CARTO is built to solve, sitting on top of Google Cloud and BigQuery and connecting spatial data to the people who need to act on it.
In practice, that means four things:
Anyone can explore the data. With live streamed data in Google BigQuery paired with CARTO AI Agents, team members can explore spatial data directly in a visual map interface, ask questions in natural language, run hotspot analysis, and navigate the map to find insights on their own. That same capability now reaches into the AI tools agency staff use day-to-day. A planner can ask about crash patterns near a school zone from inside their existing chat tool and get a real, zoomable map back, not a text summary, without ever opening a separate GIS application. No exports and no waiting on someone else to run a report.
GIS expertise gets encoded and scaled. Analysts can define repeatable spatial operations once (risk analysis, hotspot analysis, cartographic guidelines, etc.) and publish them as reusable tools and even agent skills, so the rest of the agency can run on-demand. The crash analysis that used to require a specialist ticket and a seven-day turnaround is now a one-click report any team member can run before their morning meeting.
Live map dashboards with real-time data. Every map has a live connection to data in BigQuery, so every zoom, filter, and time selection is a real query against the source data. Nothing on screen is ever stale or out of date. When a road closure goes in at 7am, the planner checking the corridor at 7:05 sees it.
Reliable and easy to deploy. CARTO runs directly on the data the agency already has in BigQuery so there’s no separate spatial database or complex maintenance needed. The platform builds on the agency’s existing Google Cloud investment instead of adding a new system to govern, and costs stay predictable and sustainable.
The result is a platform where a public agency’s GIS expertise reaches every team that needs it, from transportation planning and emergency response to communications and policy, without adding complexity. GIS Specialists define the methodology and scale their expertise across the organization. To learn more, watch this webinar on-demand.
Agentic GIS in action: Three examples
Here’s what this looks like in practice. None of the examples below need a GIS background. A planner asks a question in plain language and gets back something they can act on right away: a pattern worth investigating, a risk worth addressing, or a map ready for the budget committee.
Data exploration: Traffic and road safety trends over time
A planner usually has more questions than time to answer them. Are crashes creeping up in certain areas, and why? Is congestion shifting to new hours? Until now, each question meant a separate request and a wait, and sometimes the moment to act passed before the answer came back. Now the planner can just ask, opening the map and putting the question to the AI Agent:
"Let's do an analysis looking at accident trends and patterns over time."
Right there on the map, the agent surfaces the road segments where crashes and congestion keep stacking up, ranked by how serious they are and what’s driving them. Because every answer comes back visually, one question leads to the next: zoom into a corridor, filter to peak hours, compare this year against last. The planner builds a real sense of how the road network behaves over time, not just a single snapshot.
This is more than a report. It’s a live map that’s always up-to-date and anyone can explore on their own. The GIS experts set the foundation once and pour their know-how into the agent, so the whole agency gets answers in the moment, while the GIS team focuses on the deeper problems that matter most for the communities they serve.
Resource planning: Act on school safety before something happens
A city planner gets a wave of complaints about speeding near schools, with a council session only days away. Rather than commissioning a study, they ask:
"Let's do an analysis looking at accidents that occurred near our schools."
The agent surfaces every school with a crash problem nearby, and a quick follow-up question returns plain recommendations for each one. The planner can reassure a worried parent or brief a council member that same day, and point to exactly where a crossing guard or a signal change would do the most good.
That’s not a study that takes a month. That’s an answer that is auditable, and still holds up the next time someone asks how you got it.
Budget planning: Agentic experience in Claude or ChatGPT
A transportation planner is building the case for next year’s road safety budget. They need one clear picture: where the accidents are, and where the cycle network runs, so the team can argue for the right investments. So they ask, right inside Claude or ChatGPT:
"Create a Builder map showcasing traffic accidents alongside the cycle route network for transport planners to prioritize road safety initiatives for next year's budget"
Minutes later they have a finished map, ready to share with the team and add straight into the budget proposal. No design help, and no week-long wait to move the project forward.
Because the GIS team’s mapping know-how is already built into the agent, the map comes out polished and consistent, just like every other map the agency publishes. The planner can put it in front of the people who set the budget knowing it’ll hold up.
The bigger picture
Transportation is just one domain. The same architecture, built on cloud-native geospatial data, scalable analytics, and AI agents grounded in validated workflows, supports questions across the full scope of public sector responsibility.
Which segments of our coastal highways are most at risk given a three-foot sea level rise scenario? How did last week’s storm affect travel times across the network? Where should we prioritize road maintenance investment to reduce emissions? The answers live in the data. The shift happening now is that these answers are becoming accessible, not just to GIS teams, but also to the planners, directors, and policy teams who need to make decisions and justify city and state budgets.
CARTO already works with state and local organizations across transportation, urban planning, and emergency response. ARUP used CARTO to conduct road accident analysis for London’s public administration, supporting the city’s goal of eliminating collision-related deaths by 2041. The Hawai’i Department of Transportation (DOT) relies on CARTO for safety analytics for infrastructure planning. Madrid has used it to turn crowdsourced traffic data into city-wide insights. The pattern across all of them is the same: the data existed, but making it accessible at the speed of decisions, and at a price the agency could sustain, required a different approach.
Ready to see what geospatial AI can do for your state or city? Request a demo and we’ll show you how CARTO works with your existing data infrastructure.


