H3 Spatial Indexing, accelerated with Snowflake & CARTO


We’re excited to announce that H3 is now available natively in Snowflake! CARTO are industry leaders in pushing the boundaries of working with big spatial data, and we are so thrilled to have brought our geospatial expertise to this collaboration with Snowflake to make this game-changing technology a reality! We know this will mean big things for Snowflake users in terms of unlocking a new scale of geospatial analysis and visualization.
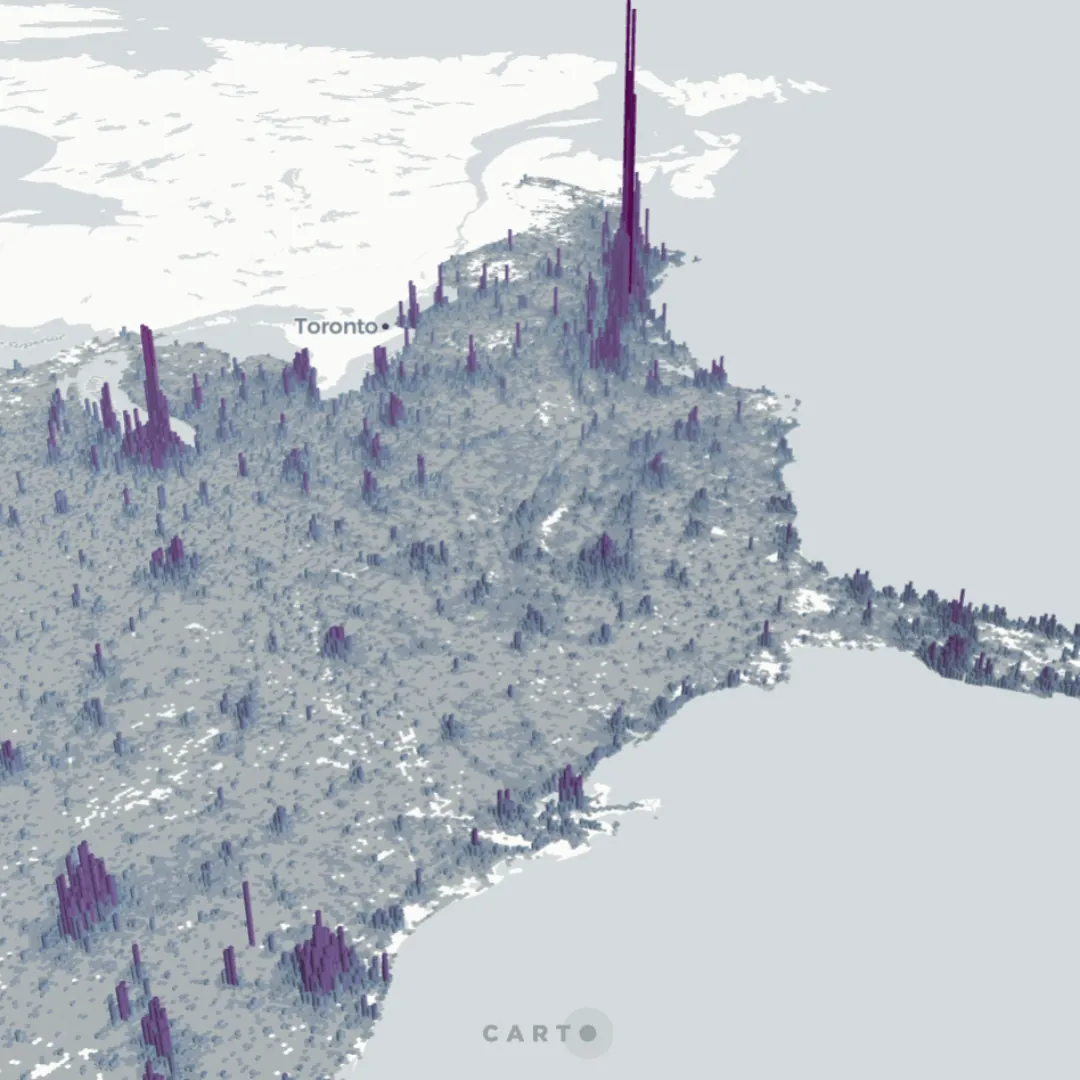
Leveraging H3 with CARTO and Snowflake opens up a world of possibilities for businesses and data professionals seeking to supercharge their geospatial data analytics.
But hold on… What is H3? What does it mean for you? And how can you get started? Keep reading to find out all of this, as well as information about our new H3 Acceleration Programme!
What is H3?
H3 is a type of Discrete Geographical Grid (DGG) or Spatial Index. This approach indexes the world into a grid at multiple resolutions.

What makes Spatial Indexes like H3 really special is how locations are indexed. Traditionally, spatial data is geolocated through a geometry; a long (and we mean LONG) reference string consisting of all vertex coordinate pairs. Spatial Indexes just use a short reference ID to do this, making them far smaller to analyze and lightning-fast to process.
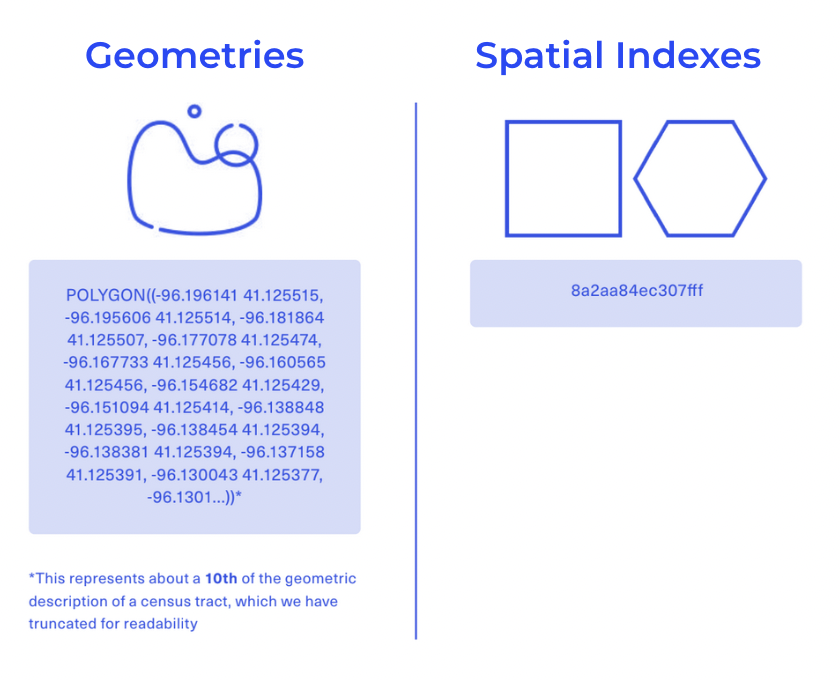
H3 in particular owes a lot of its popularity to its hexagonal shape which is optimal for representing spatial data, with its lack of acute angles and consistent relationships with its neighbors - learn more about this here!
Ready to get started?
H3 Native Support in Snowflake with CARTO
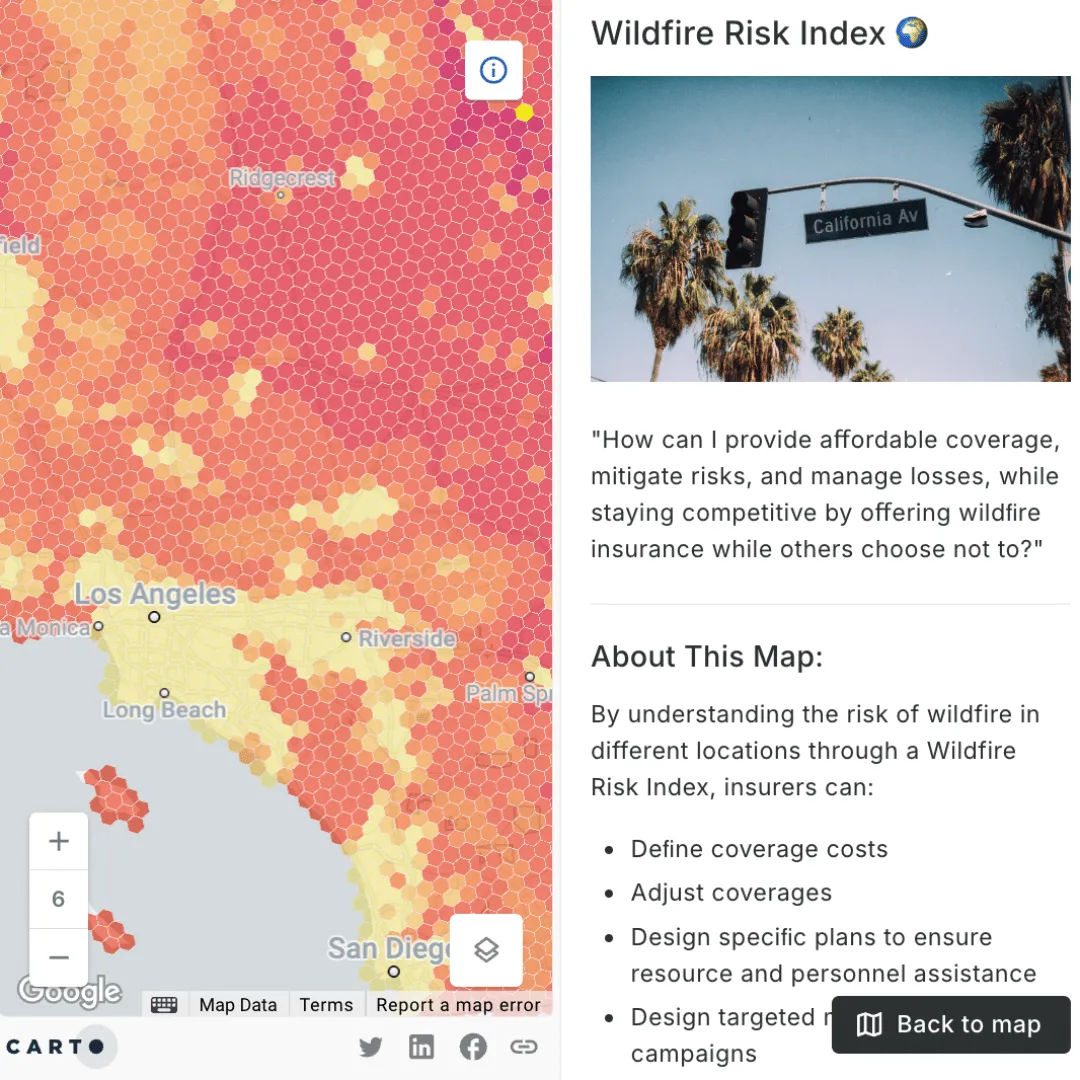
This map leverages H3 for the creation of a Wildfire Risk Index for California. Land cover type, temperature and wind speeds are all incorporated into one single score to help insurers understand the risk of wildfire.
We're proud to have collaborated with Snowlake to offer you native support for H3 within Snowflake, allowing you to leverage the power of H3 without any hassle. This support includes 19 H3-specific SQL functions to help users scale their spatial analysis. These functions allow users to:
- Create H3 grids with functions like polyfill, point and lat-long to cell.
- Seamlessly move between H3 resolutions with parent and children functions.
- Easily translate data between H3 and geometry types with functions such as cell to boundary.
By harnessing the power of CARTO with Snowflake, you can build on these functions with more advanced features of our Analytics Toolbox. For instance:
- Our dedicated H3 module allows you to go even further with manipulating H3 data, with functions such as K-ring and Hex-ring - both of which allow you to generate areas of influence around a central H3 cell. This approach is far more efficient than the alternatives of generating buffer or isoline geometries! Other functions allow you to generate multi-resolution compact grids, and H3 distance with which you can calculate the grid distance between two cells.
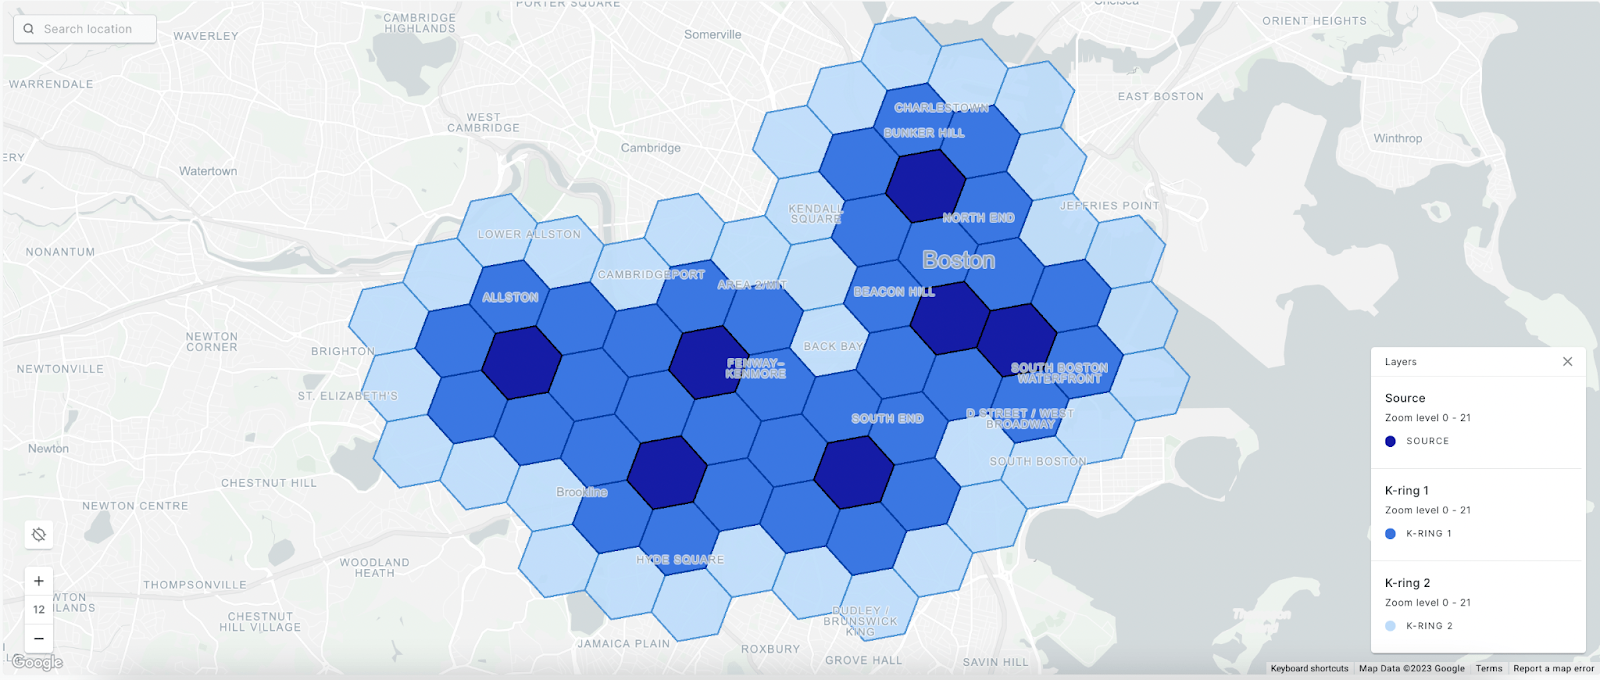
- The Data module allows users to easily enrich H3 grids with their own data - or data they’ve subscribed to from our Data Observatory!
- Finally, turn your data into insights with our Statistics module! Use Getis Ord* to identify statistically significant spatial clusters in your H3 grid, or Local Moran’s I to establish outliers within these patterns. Find out more about how to use these spatial clustering techniques here.
Learn more about all of these functions in our documentation here.
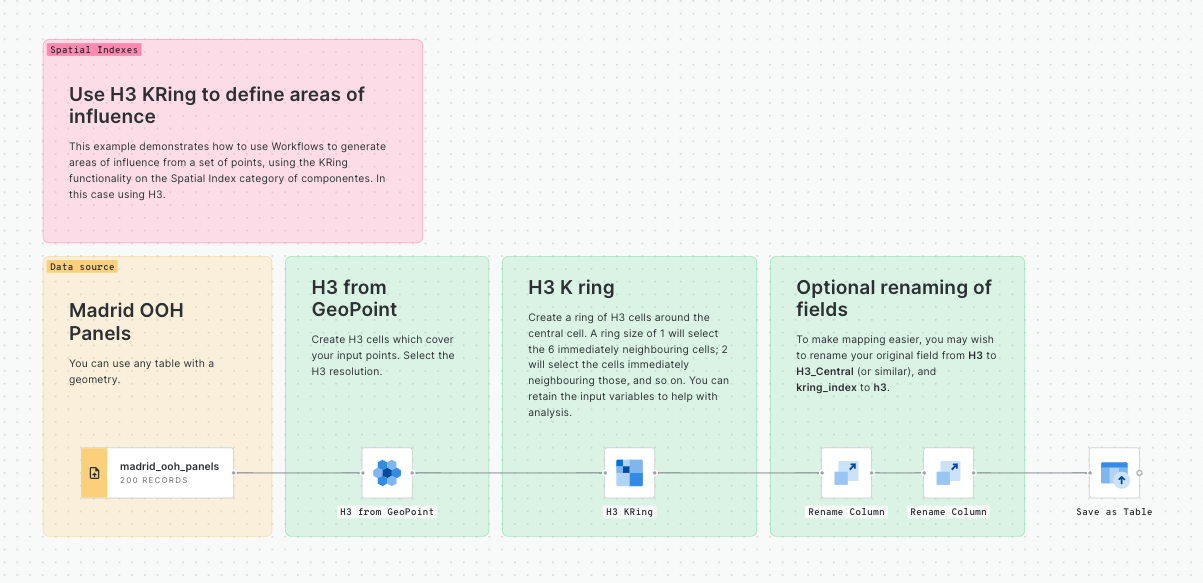
One of the great advantages of leveraging H3 in Snowflake with CARTO is that you can build advanced analytical pipelines with our low-code tool CARTO Workflows, which offers pre-built components that leverage the H3 functions available in the Analytics Toolbox. Check out our collection of Workflow templates to get you started!.
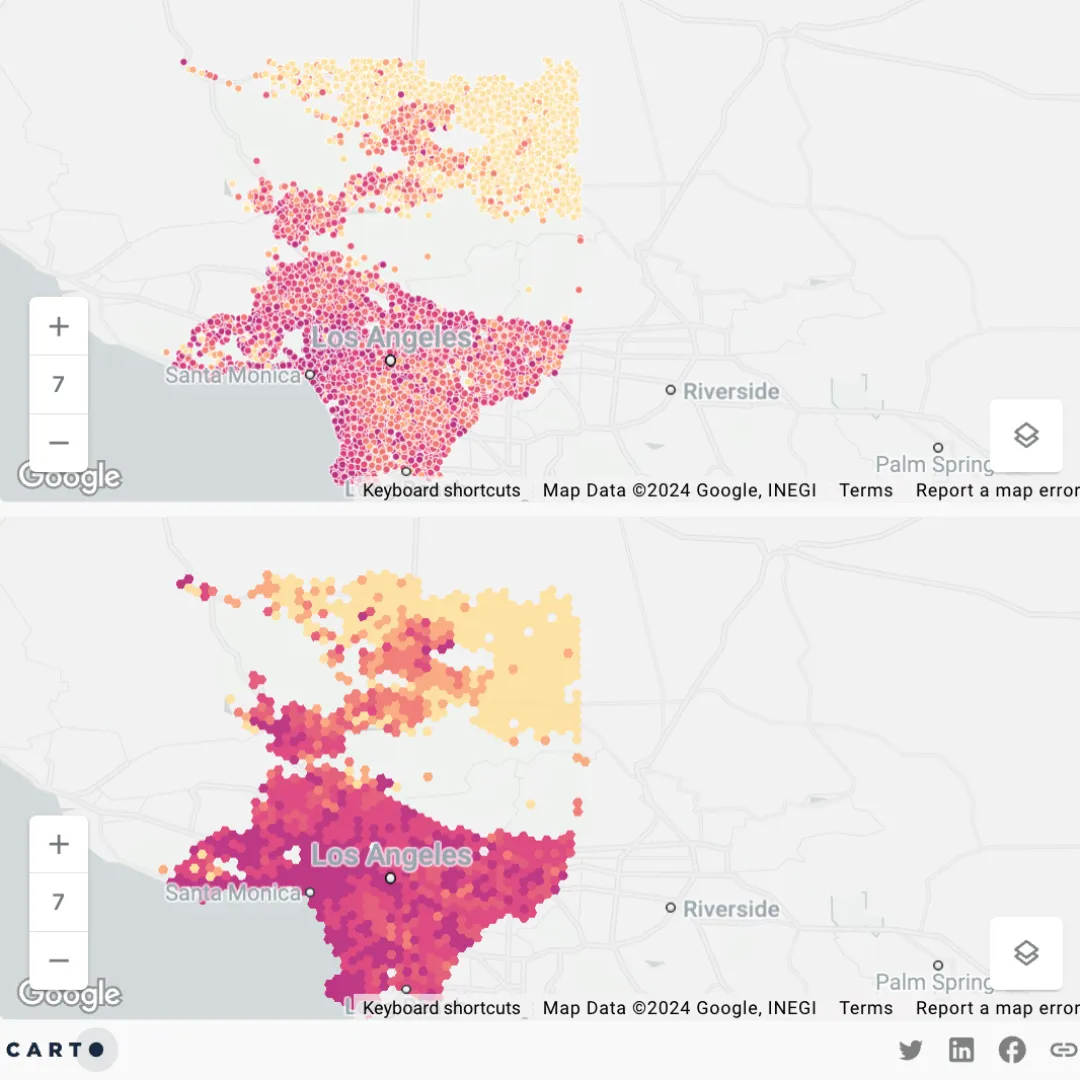
With our mapping platform CARTO Builder you can visualize H3 natively, allowing you to quickly visualize millions of features! You can also take advantage of some of our Spatial Index-specific data visualization features, such as the ability to change the resolution that H3 cells are rendered at. This rendering of massive spatial data is made even more seamless through our dynamic tiling functionality.
If you’re struggling to visualize large datasets without compromizing performance, join our upcoming webinar on March 13th (12PM ET) with Snowflake. Sign up here!
Join Our H3 Training Program Today!
Ready to start your H3 journey? Introducing the H3 Acceleration Programme!
Embark on a transformative journey with the power of the H3 Spatial Index. Tailored to the unique needs of your organization, our program will catalyze your spatial analytics capabilities with modules including Advanced analytics with H3 in your Data Warehouse and Applying H3 in your data models and workflows.
Whether you're new to H3 or looking to enhance your skills, our program can help you become proficient in using H3, and accelerate adoption across your organization for maximum business impact. Sign up here to register your interest and receive more details.
—
Ready to get started? Take your first steps towards becoming an H3 pro and sign up for a free 30-day CARTO trial today!