

How to Use Spatial Analysis In Your Site Planning Process


If you’ve ever been part of a new development project for a store or building you know how many factors go into making decisions about physical location.
Whether you’re opening new stores consolidating stores or deciding on an optimal location for a distribution site understanding the surrounding context of a site is vital to success.
Retailers restaurant chains hotels and a new wave of brick-and-mortar industries have to make site planning decisions and they have to get them right the first time. These businesses are turning to location intelligence and advanced spatial analysis techniques to make sure they have everything they need to make the best decision possible.
Is spatial analysis a core part of your site planning process?
In this post we’ll explore several ways that visualizing and analyzing location data can benefit your business in today’s hyper-competitive landscape.
Enrich your visualization with demographic and lifestyle data to uncover potential markets.
Most of us are familiar with the benefits of leveraging data—in marketing analytics or business intelligence for example. By adding new sources of data to your existing datasets you can gain strategic and cost-saving insights that help create a better picture for your site planning.
You’ll understand the potential customer base of an area—not just how many people are there but whether they are your ideal customers.
In the example at the top of the page a leading pharmacy retail chain wanted to know the best locations for 5 new pharmacies they were planning on opening in the Los Angeles metro area. We mapped their current pharmacy locations and then enriched the data (from our Data Observatory) with census tract polygons demographic data median household income and car ownership data.
Using the centroid of geometries spatial analysis we are able to find the 5 best locations for new sites based on a variety of factors. The location intelligence application dynamically adjusts as the retail chain adjusts the ideal median household income and customers driving data on the right hand side (on the backend) providing the number of “Seniors Served” who fall within the 8 mile radius of each location and the “Potential Seniors Served” which show the total number of seniors within the map.
The pharmacy retailer can now take this visualization to the next level with their own location data validating recommendations from this platform with their own customer transaction data from the Los Angeles region.
Combine location data with online transaction data to determine where to convert stores into distribution centers or open new distribution centers.
A retail company provided us with 16 retail locations and 1700 online transactions in the Los Angeles region. With an increased demand for delivery from online orders they wanted to convert 3 of their stores into online distribution centers. The distribution centers needed to be spaced to cover a wide area to serve the most customers.
The spatial analysis above shows the 3 optimal locations for distribution based on location of online sales and existing store locations. The shaded regions represent a 15 minute driving radius around the distribution centers giving us insight into how many customers we can serve.
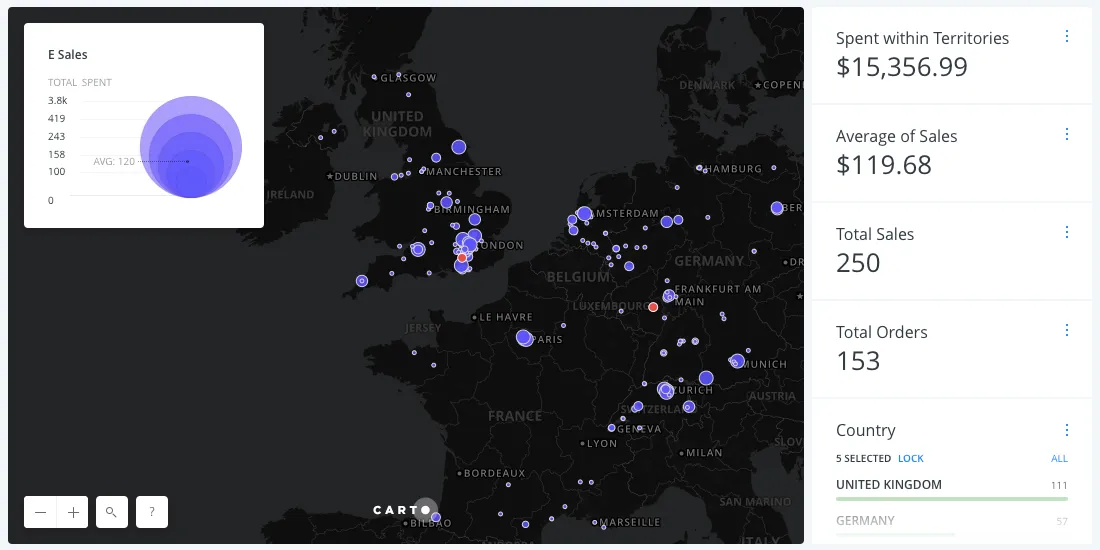
This US-based e-commerce company (we've provided an image only to protect the customer's data) wanted to expand into the European market. They wanted to know based on their current transaction data where the best place would be to open additional distribution centers in Europe.
This application shows based on transactions from their top 5 european countries (aggregated to protect privacy) the optimal 2 locations for distribution centers (Near Frankfurt and London). Obviously the company will take into account other factors in their decision-making process but this application provides a good starting point for exploring different potential sites.
Use mobility transportation and routing data to understand where the likelihood your customers will travel to a specific site or area.
Sanitas a healthcare provider in Spain uses CARTO to gain insights related to their customer’s location. They are able to identify areas which a higher number of potential customers by combining demographic data from the Data Observatory with traffic mobility and routing data.
If you’re only looking at zipcode or geographic segmentation you’re missing vital context about how your customers move in relation to where they live and work. For example Sanitas was able to see how crossing a railway track or a specific road with heavy traffic was a big factor in customers avoiding a certain site.
In our Sanitas Case Study we explore how Location Intelligence can be applied to address the current challenges that stakeholders in healthcare are facing
No one can predict the future with absolute certainty but the more data—and more kinds of data—you include in your site planning the more likely you are to make decisions that help your business compete grow and fill a genuine need in the marketplace and the community.
If you’re interested in learning more about how location intelligence can benefit your retail company or business reach out today. We’d love to hear about your challenges and find ways to make you more competitive in the location that’s best for you. Request a demo or visit CARTO.com to find out more about our location intelligence solutions.


