Spatial Data Infrastructure, Rebuilt for the Age of AI


Almost every serious use of spatial analytics depends on access to authoritative data. Whether the question is about infrastructure, climate risk, transport, urban planning, insurance, or site selection, the analysis is only as reliable as the data behind it.
Spatial data infrastructures are how governments, mapping agencies, researchers, and other publishers make that data available. They are a critical part of the geospatial ecosystem, and a great deal of work has gone into defining the standards and methods behind them. In Europe, initiatives such as INSPIRE established an important ambition: public spatial data should be discoverable, interoperable, and usable across borders.
The ambition was right. The experience has often been painful.
Publishing a dataset traditionally means deploying databases, servers, APIs, and a portal, then maintaining all of them for years. Updating data is slow. Infrastructure has to be sized for peaks even when most datasets receive little traffic. The publisher keeps paying whether the data is used or not.
The experience for users isn’t much better. Geoportals and general-purpose data portals can be slow and hard to navigate. Finding the right dataset is only the beginning: users still have to understand the service, interpret the metadata, download the data, reproject or clean it, and work out how to combine it with other sources. In practice, much of this infrastructure remains accessible mainly to GIS specialists, despite the cost and effort that went into building it.
We’ve been discussing what comes next for some time, including in my talk on Geospatial Sovereignty in the Age of AI at OGC Connect Helsinki. Three changes are now coming together that make a very different kind of SDI possible.
Three changes reshaping spatial data infrastructure
1. Cloud-native formats change the economics
Traditional data services put the cost and scaling burden on the publisher. Every query passes through infrastructure that the publisher has to operate.
Cloud-native formats invert that model. A user can read only the bytes needed from a file in object storage and run the query with their own compute. The publisher stores the data once instead of running a dedicated service for every way it might be used. Traffic can grow without requiring the publisher to keep scaling a database or API in front of it.
This works across different kinds of spatial data. GeoParquet provides a portable, columnar format for vector data. COG does the same for raster access, while PMTiles packages tiles for direct use from storage. Apache Iceberg adds something particularly important: a standard table layer for large, governed, evolving datasets.
We’ve worked on these formats for years, from helping establish GeoParquet to adding native spatial types to Parquet and Apache Iceberg with Snowflake, Databricks, and Google. As I wrote in How Iceberg, GeoParquet & CARTO are reshaping geospatial, the larger opportunity is to make spatial data part of the same open analytics ecosystem used by the rest of the organization.
2. AI changes who can use the data
Making a file available doesn’t make its contents easy to use. People still need to find it, understand it, decide whether it is appropriate for their question, and know how to query it.
Agents can take on much of that work. Given structured metadata, good documentation, and direct access to the data, an agent can understand a user’s intent, discover relevant authoritative datasets, inspect their contents, run spatial analysis, and return an answer with its sources and the query used to produce it.
This is a major change in accessibility. A user can begin with the question they need answered instead of learning several portals, APIs, file formats, and GIS tools. Experienced practitioners can work across far more datasets than they could reasonably inspect by hand.
The bigger opportunity is federation. An agent doesn’t need every relevant dataset to live in one portal or warehouse. It can discover catalogs at different levels, understand what each one contains, and join their data when the question is asked.
In the Helsinki demo, the agent could work with local planning data, national power, flood, and population data, European sources such as Copernicus and Eurostat, and global data from Overture. Catalog descriptions and geographic extents helped it choose the right sources before querying them. It could also combine spatial and non-spatial data, such as joining a national population grid with European statistics.
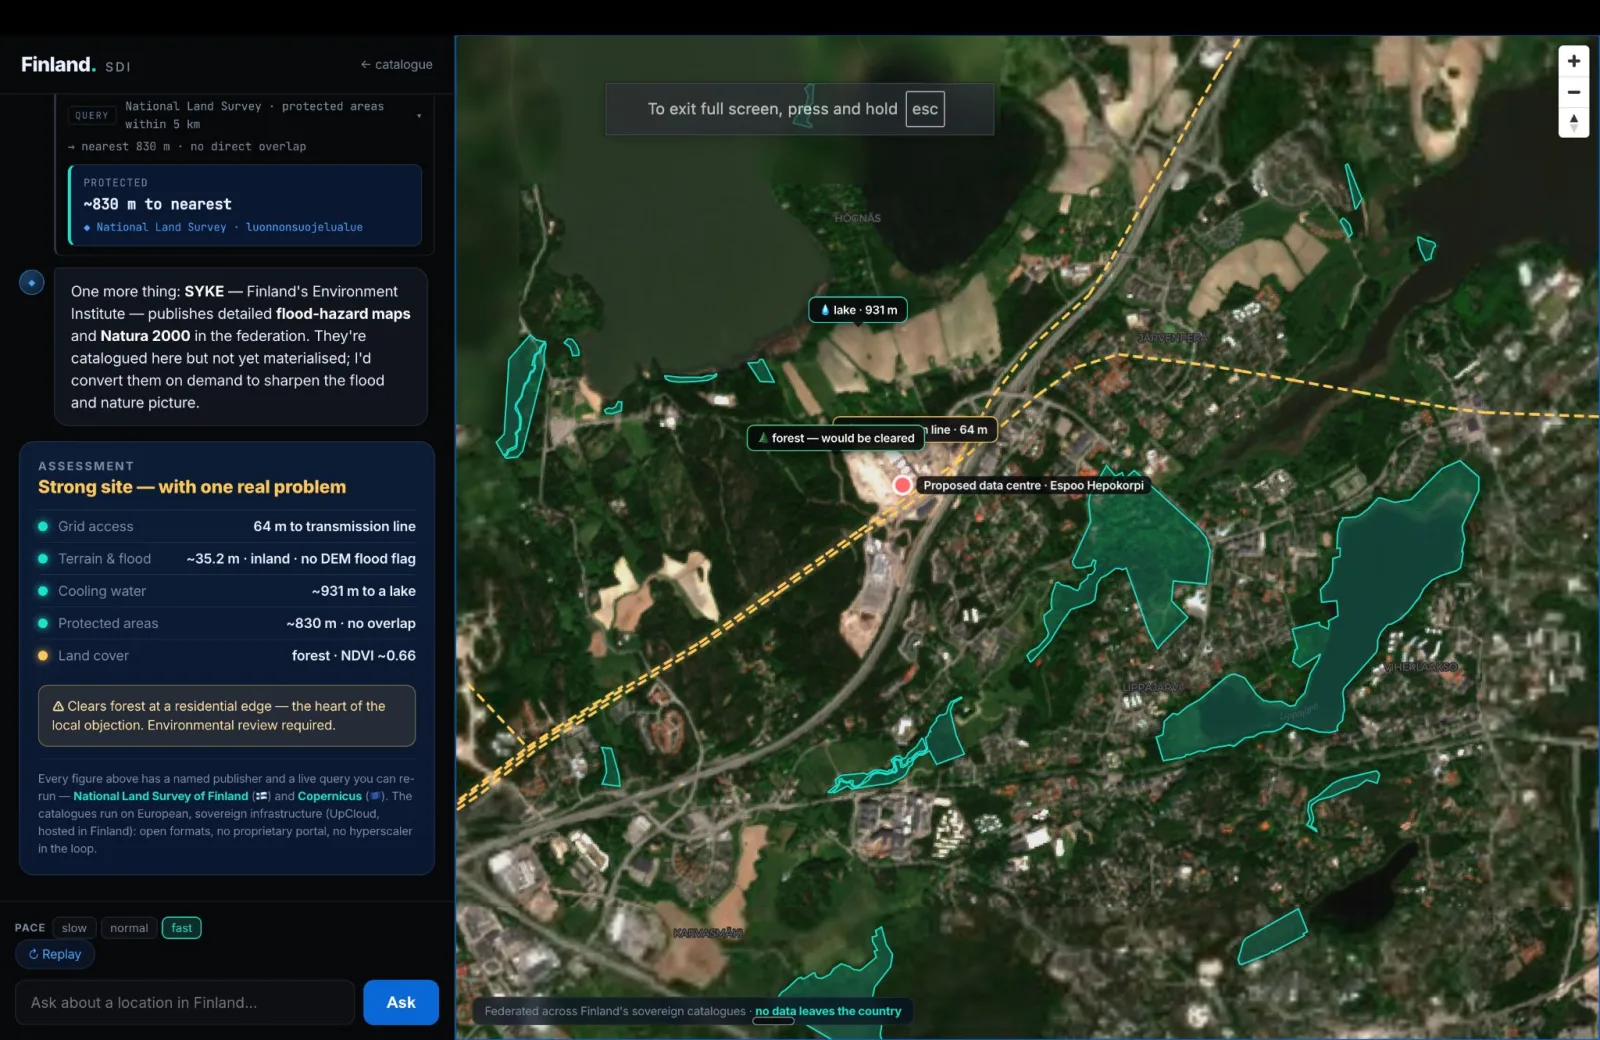
This isn’t federation through a central copy of every dataset. Each publisher remains responsible for its own catalog. The agent attaches the relevant sources, joins them live, and returns an answer in which every figure keeps its publisher and a query that can be run again. A question that no single dataset can answer becomes possible because the agent can work across all of them.
The distinction between authoritative data and model knowledge is critical. An AI system shouldn’t improvise an answer from what the model remembers. It should find the right sources, query the published data, preserve their provenance, and make the result possible to check.
3. Sovereignty becomes an architectural requirement
More organizations are asking where their data lives, where queries run, which AI models are involved, and how easily any part of the system can be changed. For governments and organizations responsible for critical infrastructure, these aren’t secondary procurement questions. They are part of the SDI itself.
I’ve written about geospatial sovereignty as a layered architecture: open data formats, replaceable compute, portable AI, and shared semantics. Sovereignty doesn’t require isolation. It requires control and the ability to choose each layer without becoming dependent on one vendor, cloud, model, or jurisdiction.
Open, cloud-native data makes that possible. Publishers keep control of the source data and decide where it is stored. Users can choose the query engine. Organizations can choose which models are allowed to work with it. Moving between providers doesn’t require converting or republishing the catalog.
These three changes are already underway. What is still difficult is assembling them into an SDI that a real data publisher can create, operate, and maintain without having to design the whole architecture from scratch.
Portolan: an open specification for the next SDI
That is why we’ve been very happy to join other members of the geospatial community in building Portolan.
Portolan is an open specification and toolkit for publishing geospatial data as files in storage controlled by the publisher. In practice it is a STAC publishing profile: STAC describes and links the data, and Portolan sets out how the publication is structured, documented, validated, hosted and updated. It is not a new data format. It defines the best practices needed to make those files discoverable, efficient to query, well documented, and useful to both people and agents. It doesn’t require a server, database, or custom API in the request path.
Portolan builds on standards and formats the community already uses. STAC provides a consistent catalog and metadata structure. GeoParquet, COG, and PMTiles make different kinds of data directly accessible from object storage. The specification covers practical details that have a large effect in production, such as spatial ordering, bounding-box metadata, and CORS configuration.
It also treats AI access as part of the design, not something to add later. Every collection has three entrances: software reads collection.json, people read README.md, and agents read AGENTS.md, which documents stable paths, tested query patterns, schema and CRS differences, licences and known caveats. All three lead to the same published files. A validator checks catalogs against the specification and returns structured results that people or agents can act on.
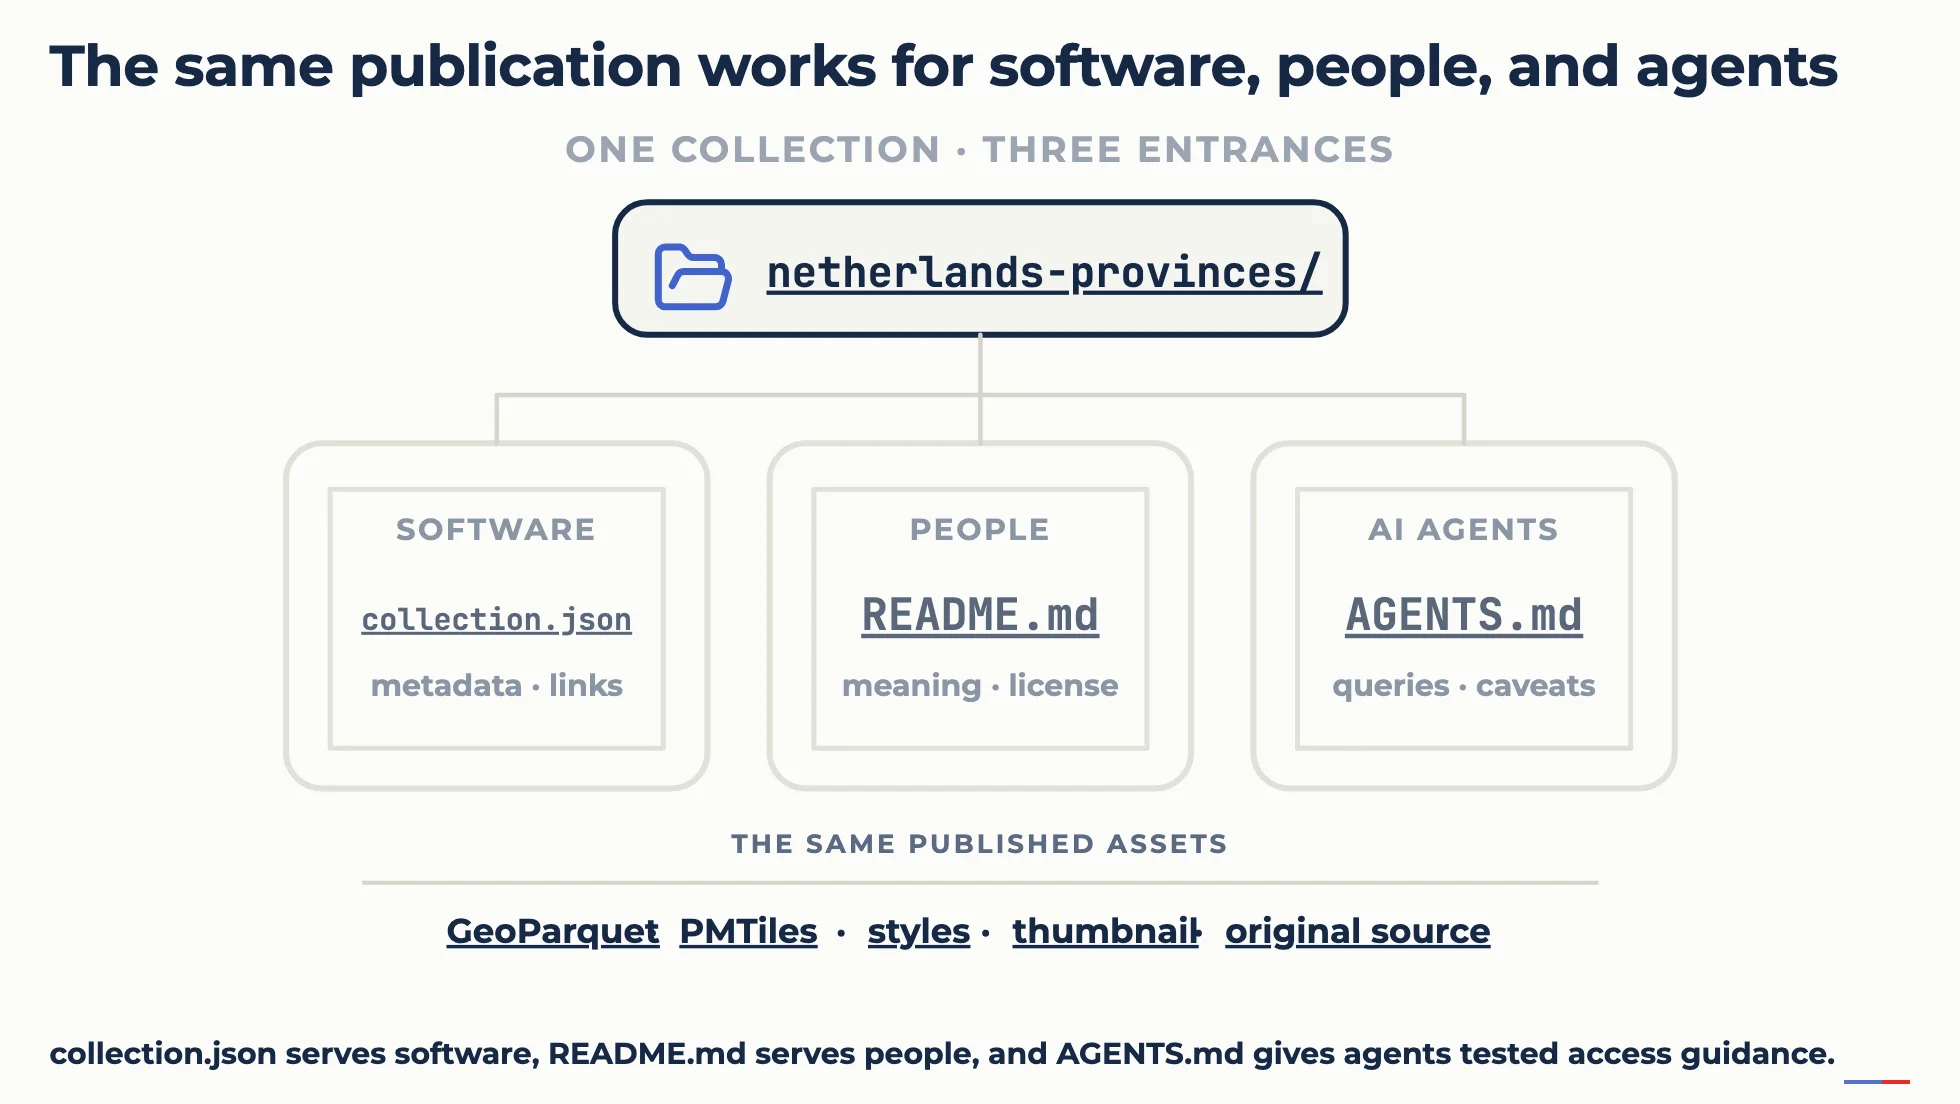
From our perspective, this is one of Portolan’s most important ideas. An AI-ready SDI isn’t a traditional portal with a chat box attached. The underlying data, metadata, documentation, and access patterns all have to be designed for agents.
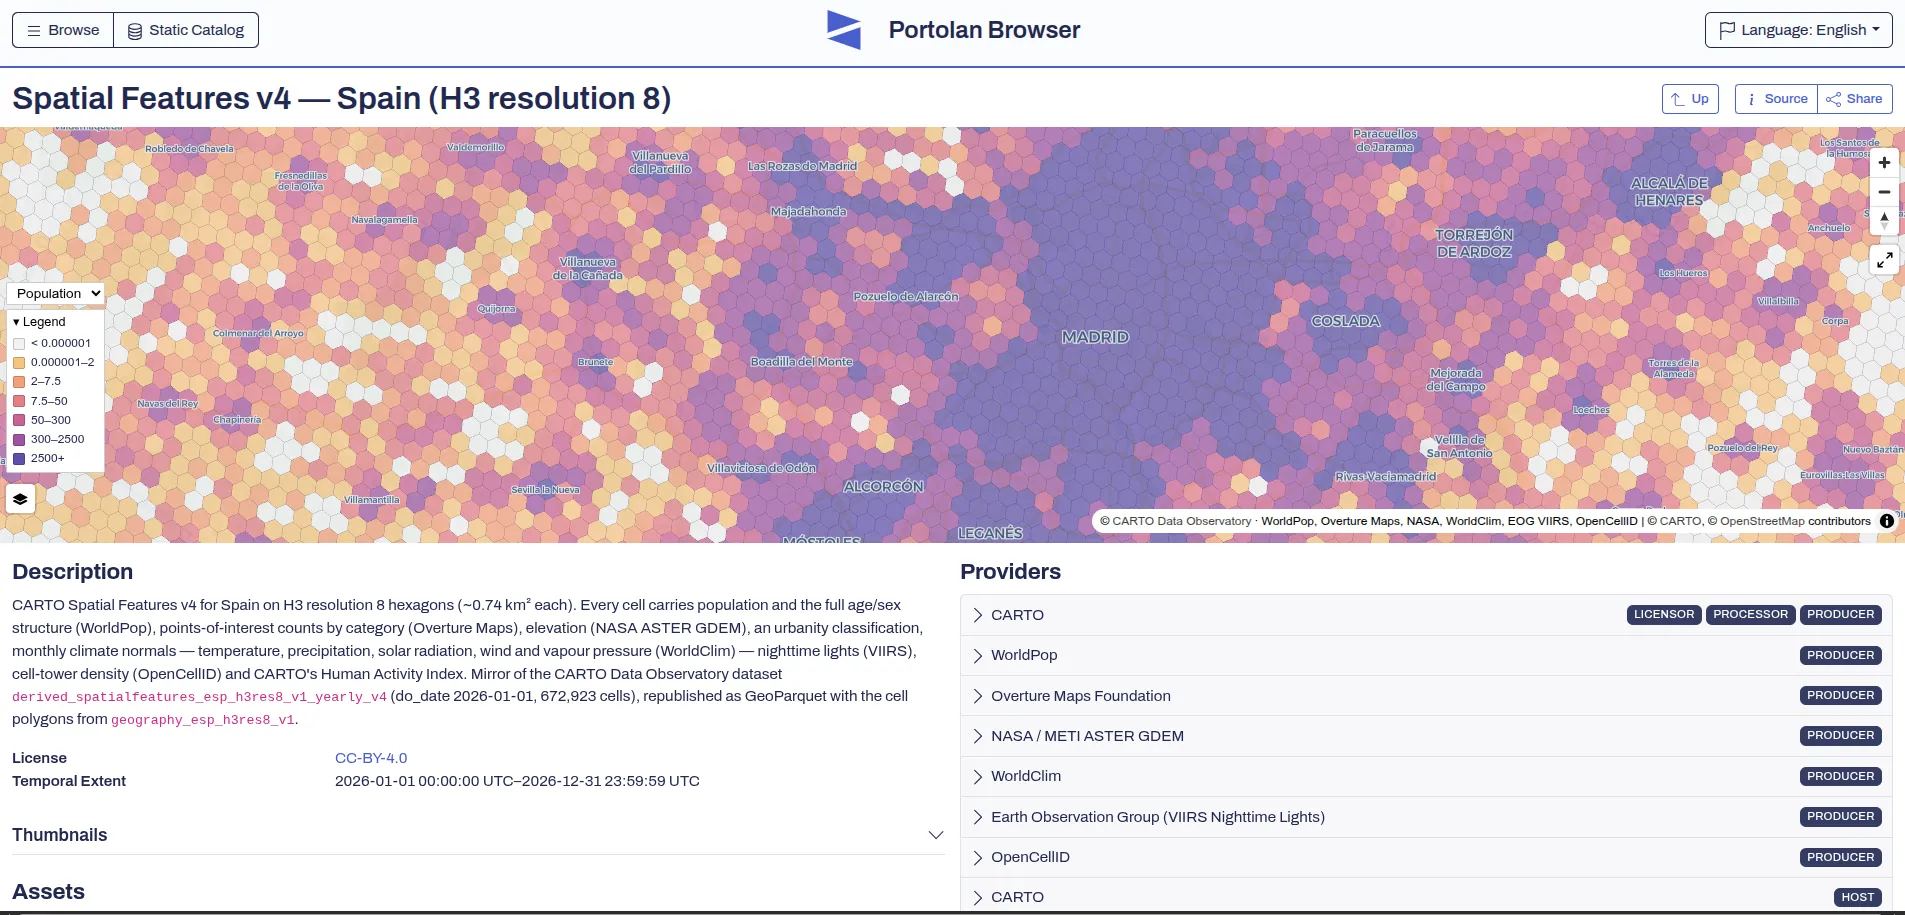
The Portolan registry adds the discovery layer needed for federation. It is a catalog of independently hosted catalogs, not a central repository of their data. As more publishers describe and register their catalogs in the same way, an agent gets a better view of which sources exist, what they cover, and how they can be combined.
The Portolan launch post explains the specification, CLI, validator, and registry in more detail.
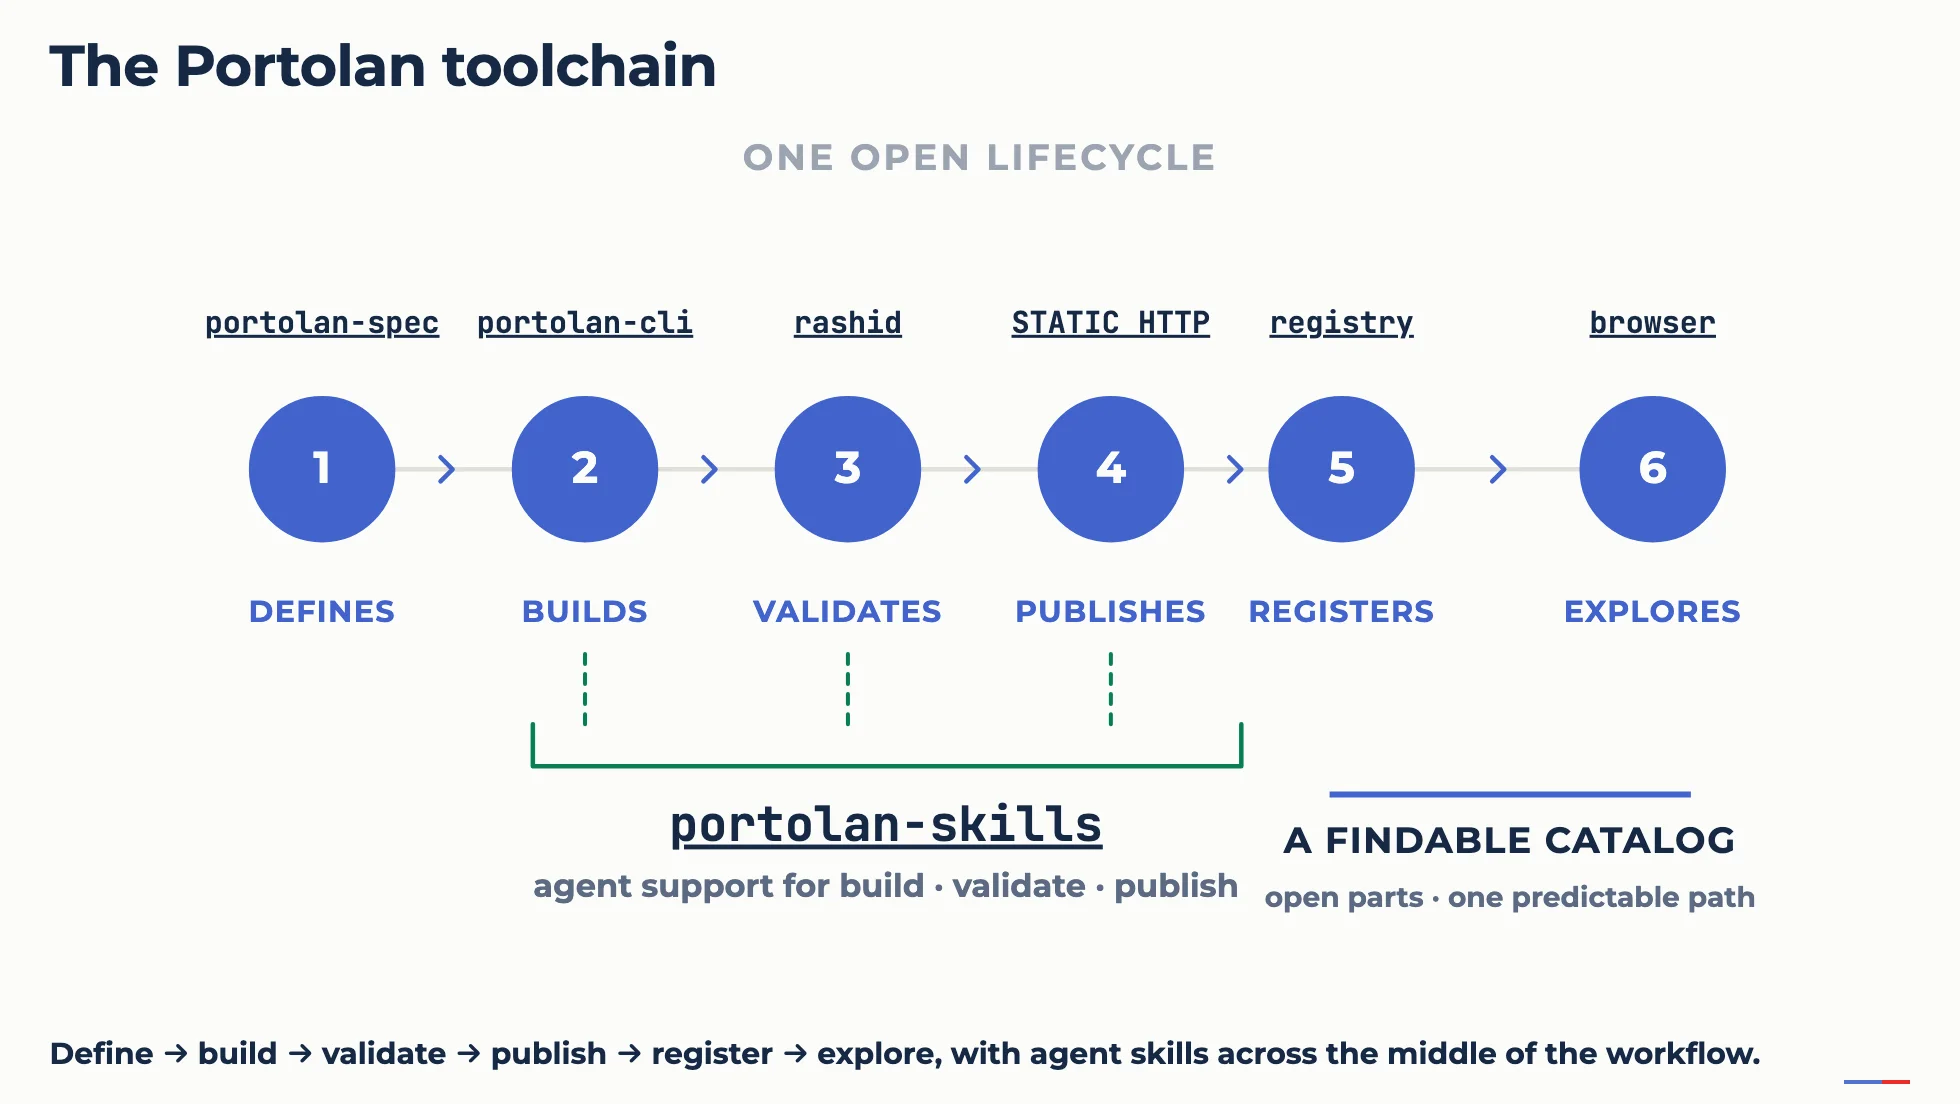
Portolan’s current format work focuses on the cloud-native geospatial ecosystem: GeoParquet, COG and PMTiles are what it validates today. At CARTO, we also want to connect this publishing model to the wider lakehouse ecosystem, which is why we are investing in Apache Iceberg.
Iceberg brings transactions, versioning, schema evolution, and governance to open tables, and native spatial types allow those tables to work across engines such as Snowflake, Databricks, BigQuery, and DuckDB. Interoperability shouldn’t end at the boundary of the geospatial industry. Spatial data should work with the same infrastructure and standards organizations already use for the rest of their analytics.
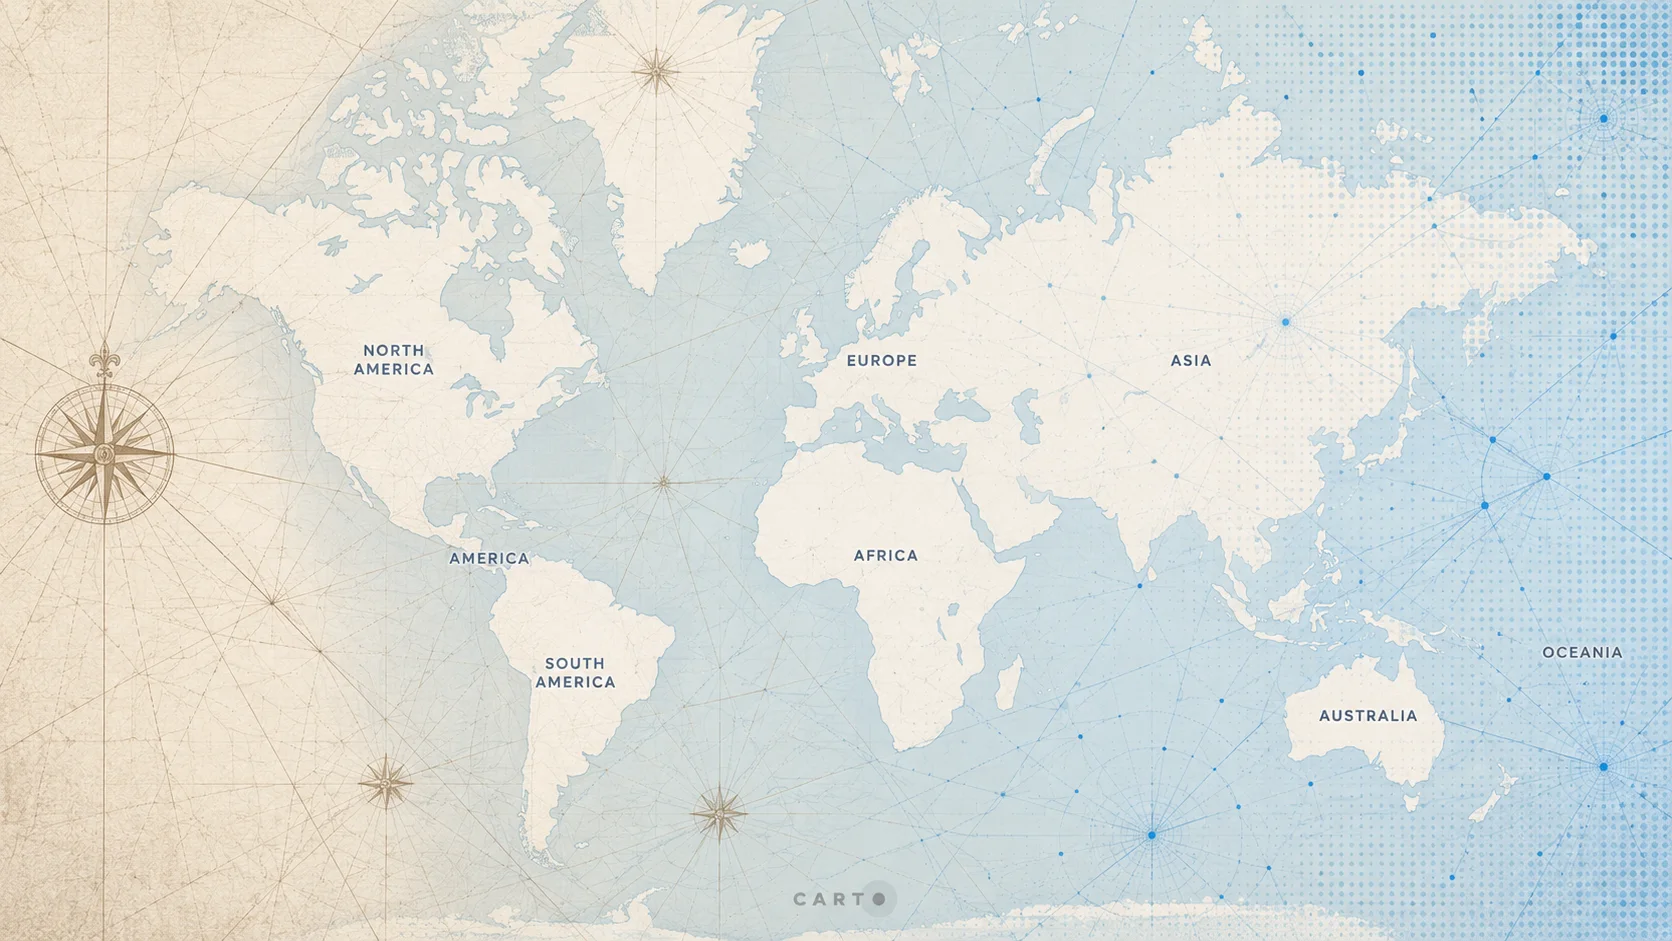
A postscript on the name. Portolan charts were among the earliest practical navigational maps. They were not theoretical representations of the world but working tools: built from real observations, continuously refined, and shared across sailors, ports and nations. They were decentralized, made and improved by many hands. They were interoperable, readable wherever a ship went. And they were critical infrastructure, for trade, for safety and for sovereignty. The project takes its name from that tradition. It is practical rather than academic, built from data in open formats rather than drawings, and designed for sharing across organizations, clouds and borders.

From data portals to answers
CARTO was created to democratize access to spatial analytics. For much of our history, that meant making spatial analysis and visualization available to more people without requiring traditional desktop GIS workflows.
AI gives us a much more direct way to pursue that mission.
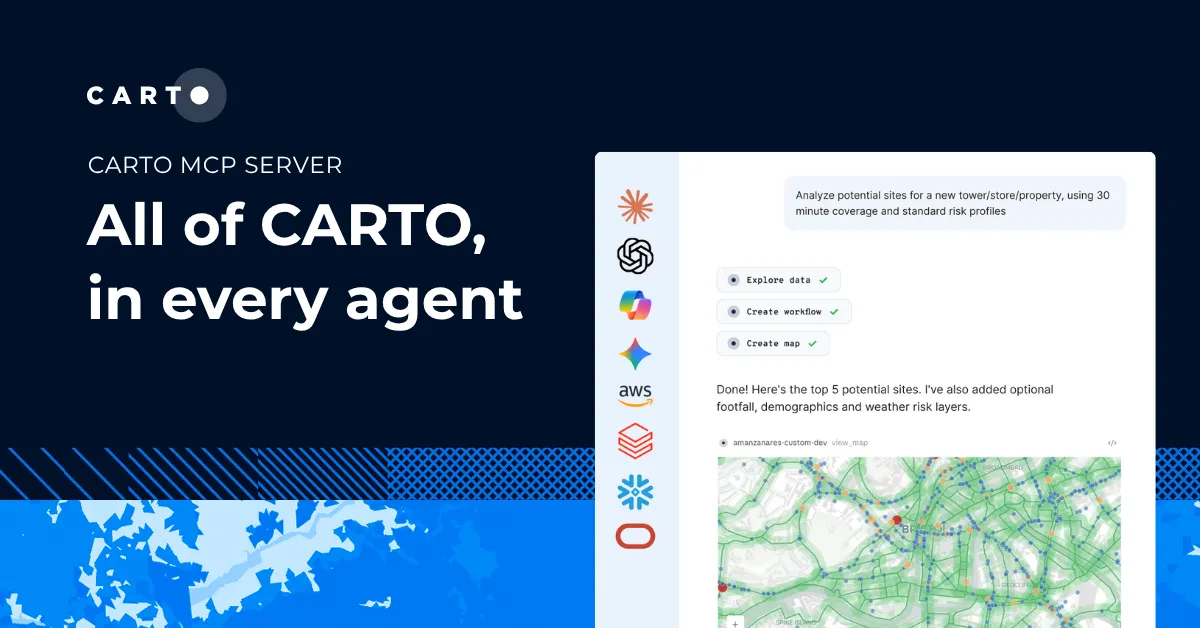
Agents are becoming very good at understanding what a user is trying to achieve, finding the relevant data, choosing the right tools, running deterministic spatial analysis, and explaining the result. As we recently described in All of CARTO, in every agent, they can make the capabilities of a complete GIS available through a natural-language interface.
Authoritative data is what makes those agents useful for serious work. If the agent can discover and query trusted datasets directly, a user can ask a question and receive an answer grounded in those sources without needing an expert to manually broker every request.
That doesn’t remove the need for geospatial experts. It changes where their expertise has the most leverage. Instead of spending their time moving data between systems or answering the same requests repeatedly, they can select authoritative sources, document limitations, define reliable analytical methods, and govern how those methods are used. Agents make that expertise available to many more people.
This is why AI readiness and sovereignty are closely connected. Organizations want agents that can reach useful data, but they also need to control where that data lives, which models can access it, which tools an agent can run, and how every answer is audited. Increasingly, customers aren’t asking us for AI-ready infrastructure and sovereign infrastructure as separate things. They expect both from the same architecture.
Introducing CARTO SDI
Portolan defines an open foundation for publishing data. Running an SDI for an entire country, or operating a catalog as a commercial data product, requires additional capabilities around that foundation.
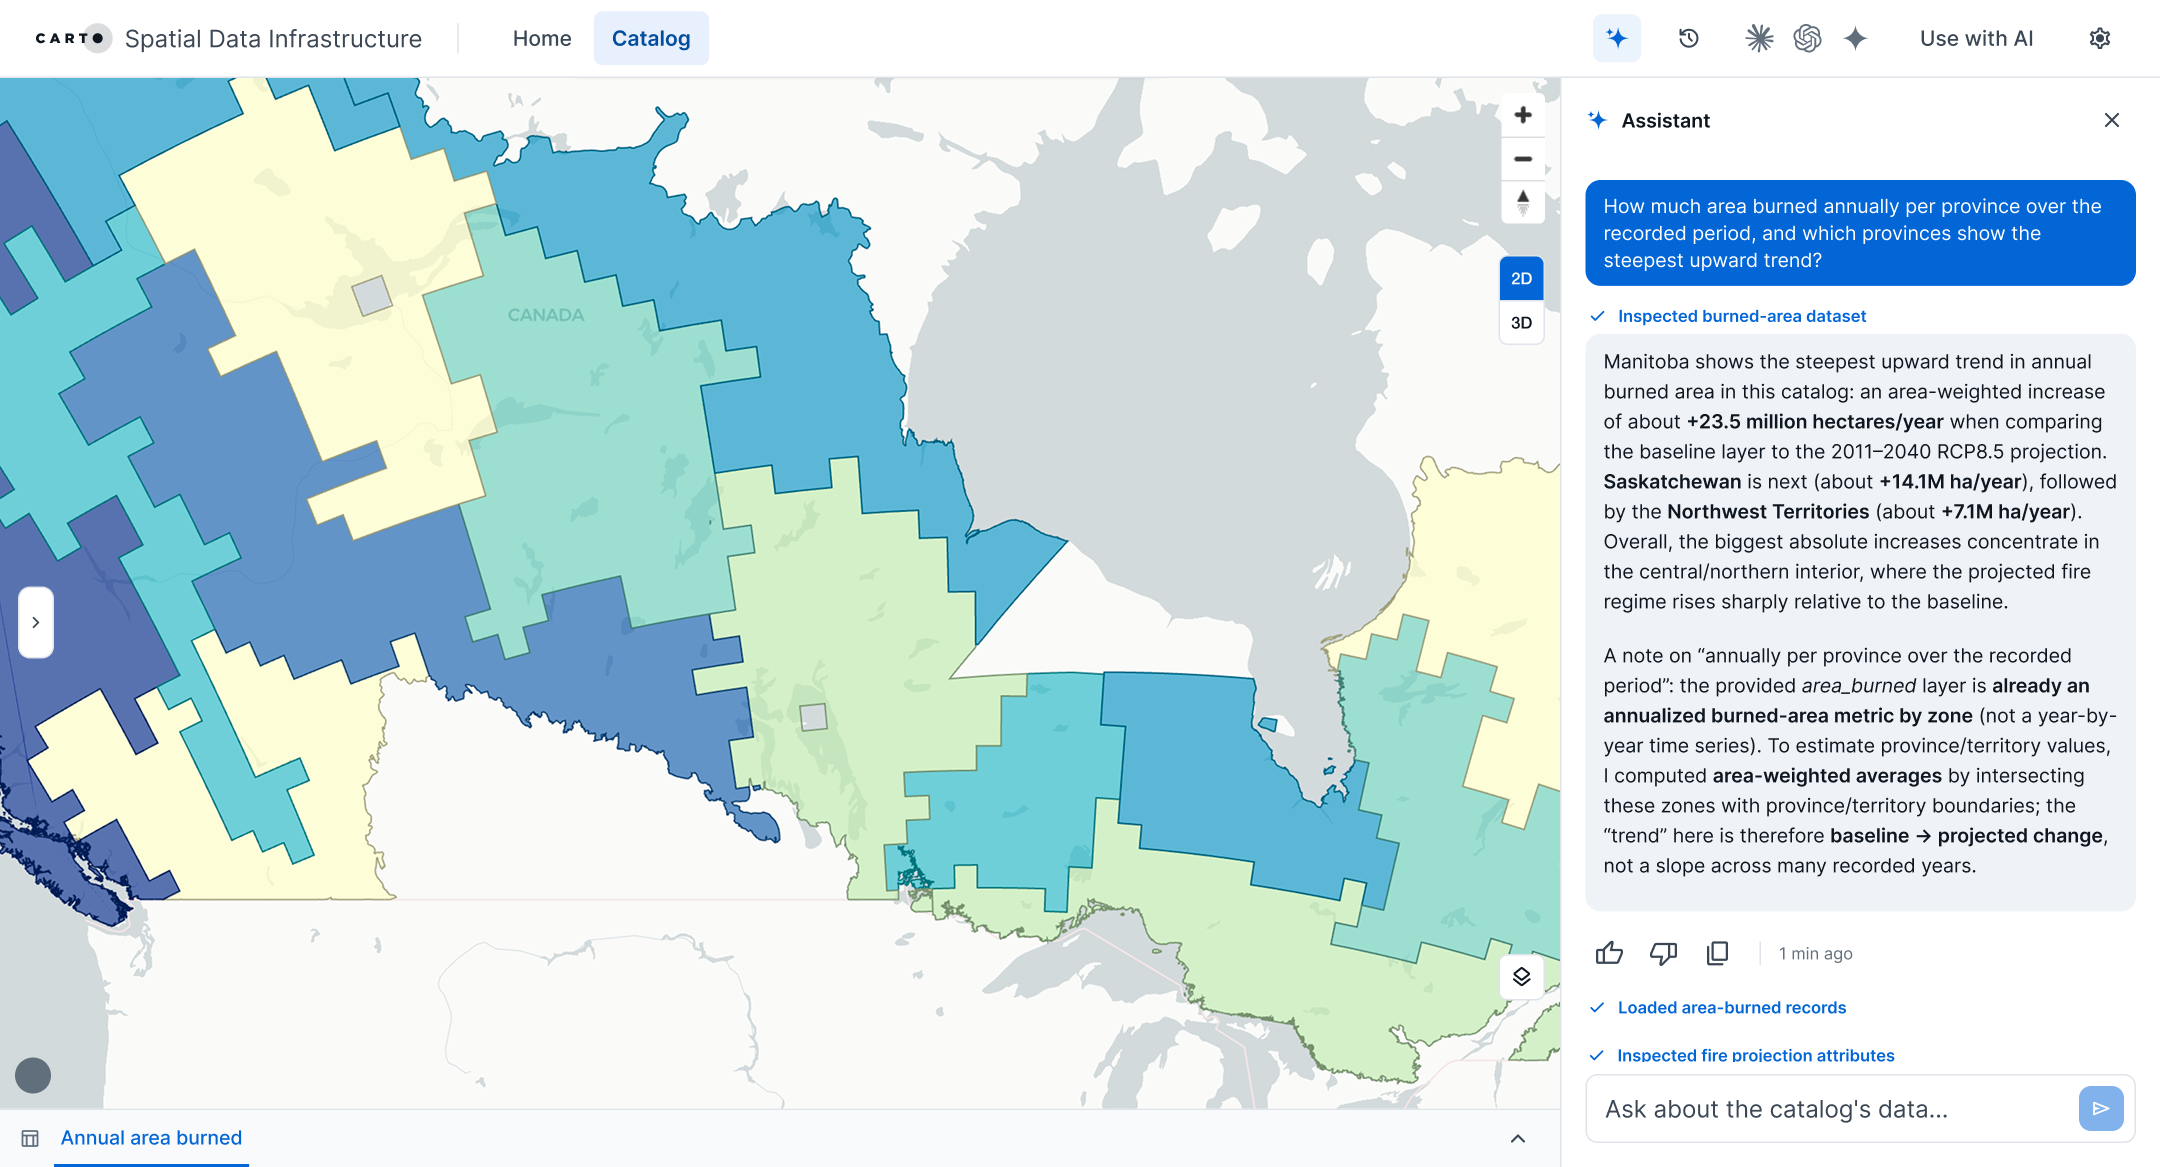
CARTO SDI is our commercial implementation of Portolan. It has three main parts: a catalog through which people and existing software can find and access data, an AI interface through which users can ask questions, and a control plane through which the publisher operates the whole system.
The catalog is the front door to the data. It gives publishers a branded place to organize public, private, and licensed datasets; expose their metadata and documentation; and make them available through downloads, modern analytical engines, or established GIS interfaces. The published data remains a standard Portolan catalog in the publisher’s storage.
The AI interface lets users interact with that catalog in natural language, either through CARTO or from the publisher’s own website using models the organization approves. The agent can discover relevant datasets, federate them with other catalogs, run spatial analysis, and return an answer with sources and a reproducible query.
The control plane gives the publisher the operational tools that a collection of open files doesn’t provide on its own:
- Catalog management and governance. Author metadata, publish updates, manage approval flows and dataset versions, and maintain an audit trail across every catalog.
- Identity and access. Publish public, licensed, and internal data together, while roles, entitlements, and the publisher’s identity provider determine who can access each dataset.
- Usage and demand. Understand which datasets are used, by whom, from where, and through which tools or query engines. Denied requests and searches with no result become signals about unmet demand.
- Quality and feedback. Track validation, freshness, schema and data-health signals; collect ratings and structured issues; and give users and agents a way to report corrections.
- Monetization. Manage self-registration, licenses, subscriptions, pay-as-you-go access, entitlements, and revenue reporting by dataset and customer.
- Writable data. Manage corrections and new versions through cloud-native table formats such as Apache Iceberg, without creating a separate update pipeline.
- A connected GIS platform. Use the same data in warehouse-native analytics, workflows, maps, and agents, while continuing to support WMS, WFS, and ISO metadata for existing GIS clients.
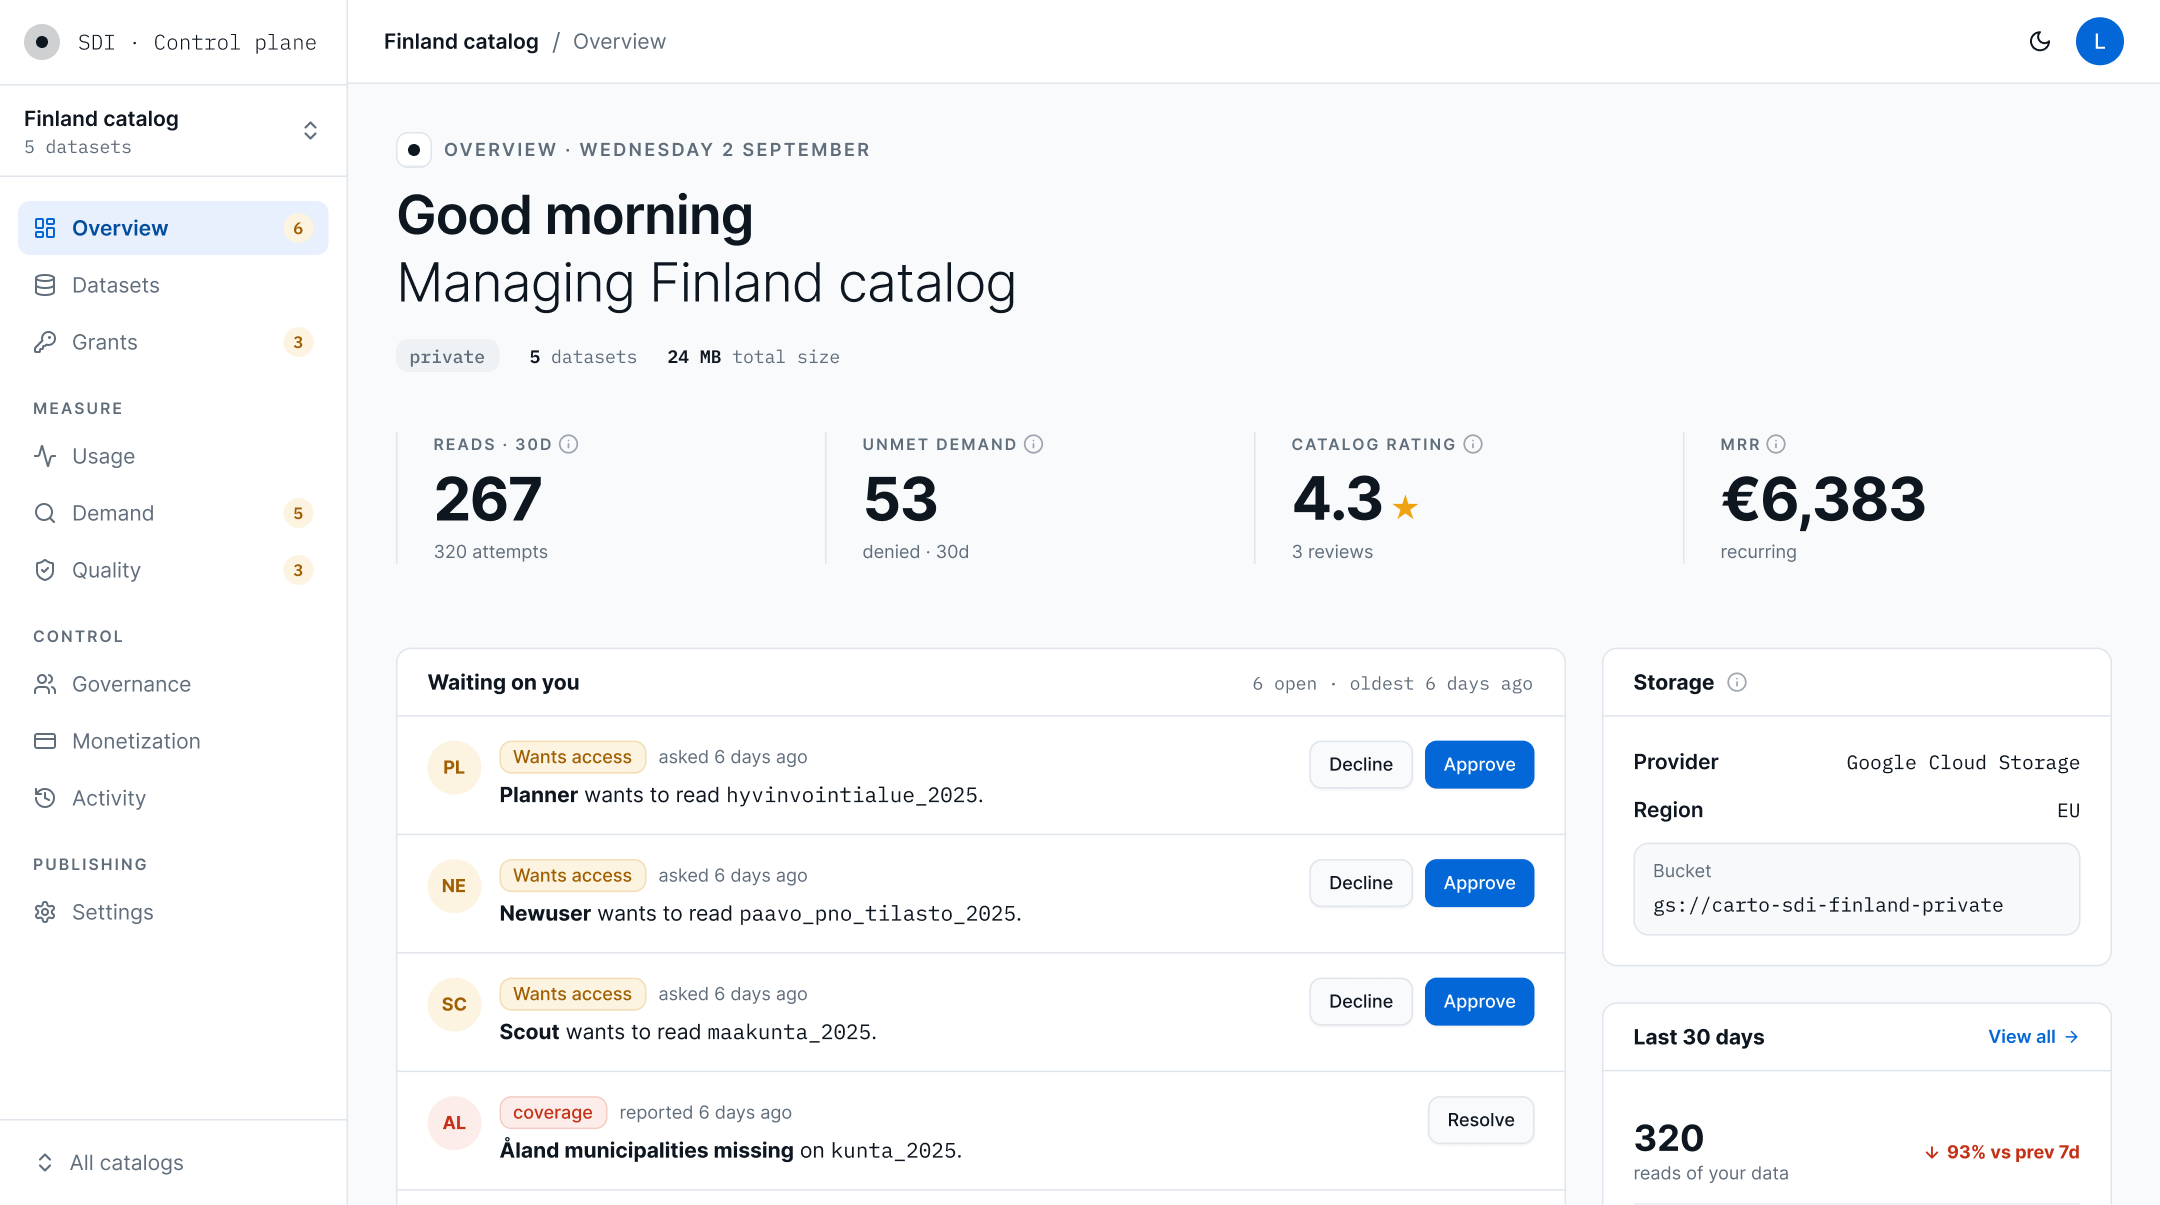
Telemetry is particularly important because traditional portals tell publishers very little about what happens after data is released. CARTO SDI can report accesses, denied requests, tools used, bytes scanned, and the datasets involved in an analysis. With explicit opt-in, an agent can also send the publisher a paraphrased description of why the data was queried, without including confidential details from the conversation.
That turns usage into a publishing roadmap. Empty searches show which datasets people can’t find. Denied requests show where access policies may be blocking legitimate demand. Repeated use in a particular analysis shows which datasets are providing the most value. Quality reports and corrections tell the publisher where maintenance will have the greatest impact.
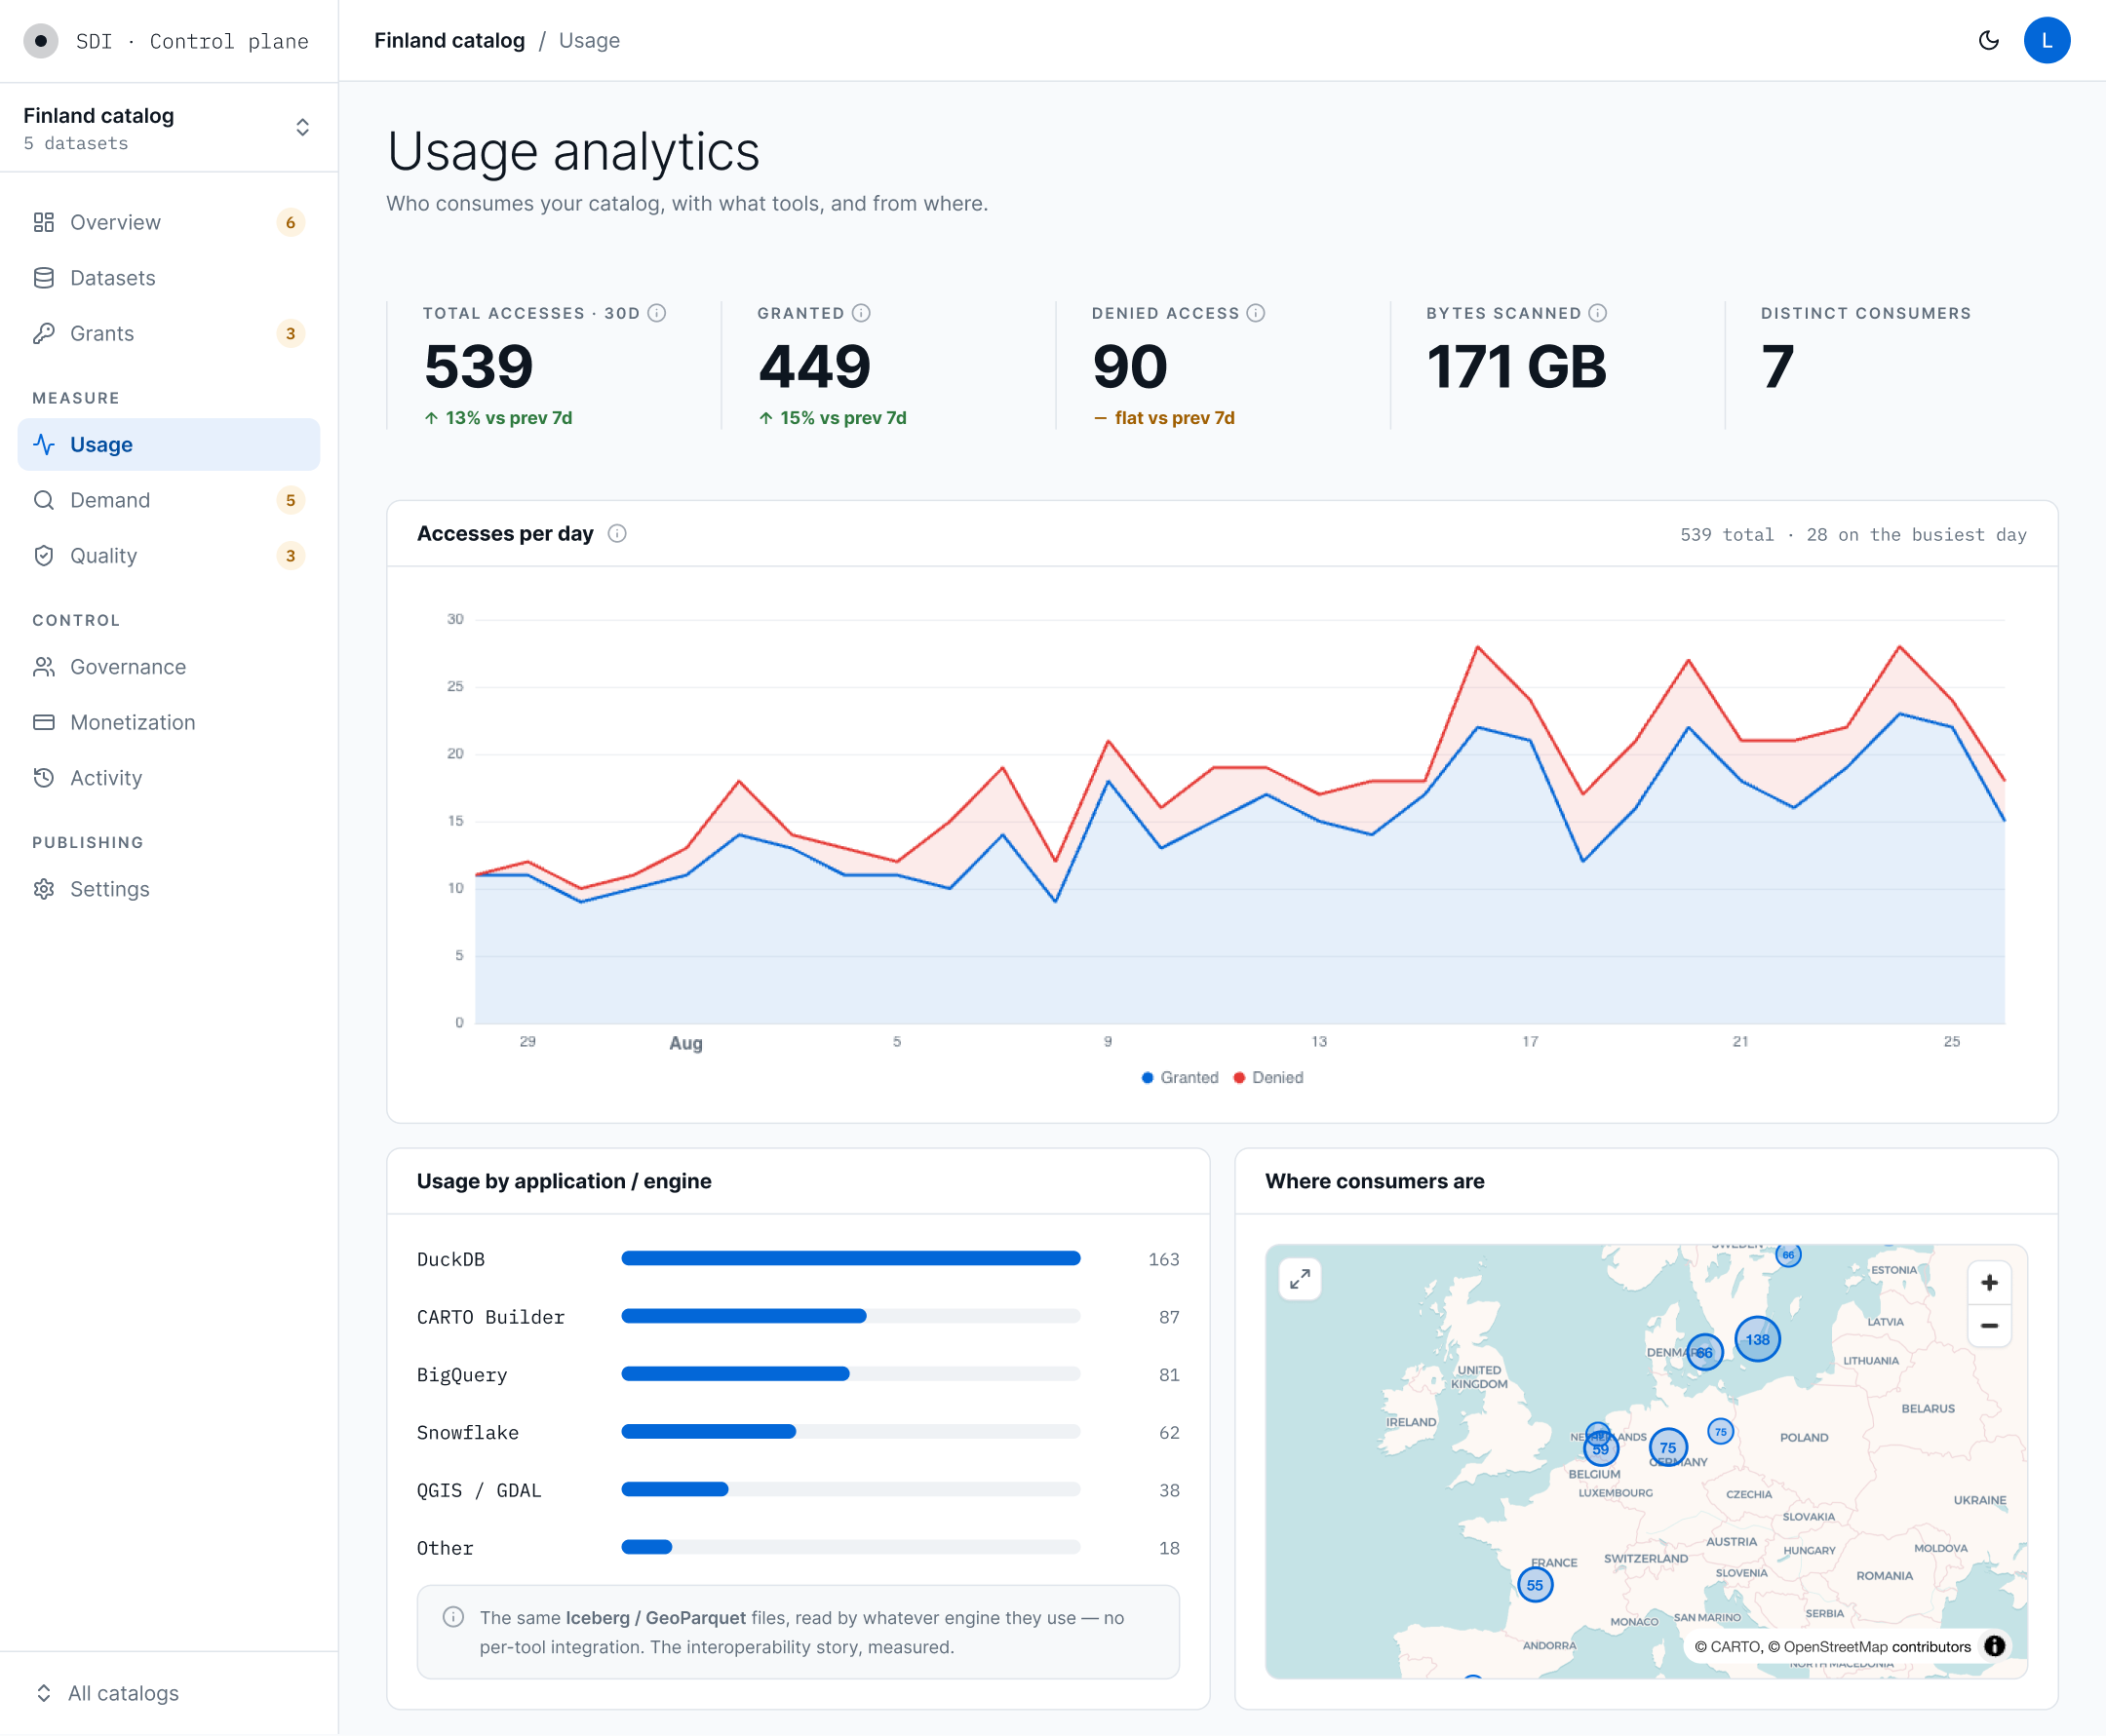
For many publishers, monetization is also part of making the model sustainable. Some data should remain open; other datasets require licenses, subscriptions, or usage-based access to fund their continued production and maintenance. CARTO SDI supports both through the same catalog rather than forcing publishers to build a separate commercial delivery system.
All of these capabilities operate around the open catalog. The data can still be used directly from QGIS, DuckDB, BigQuery, and other tools that support the same standards and formats.
The network is starting to form
At the time of writing there are twenty catalogs in the Portolan registry. They range from global sources such as Overture Maps and the GHSL population grids, to national data from the Instituto Geográfico Nacional de Argentina and Moldova, to city catalogs such as the City of Madrid’s open data, Utrecht’s, and Philadelphia’s housing and land use data, to Planet Labs’ disaster data releases and community projects such as the Back-on-Track night train database. Some are published by the producing agency; others are cloud-native mirrors of an official source built by a third party, and the Madrid catalog is one we mirrored ourselves. Portolan requires a mirror to name its producer and link back to the original.
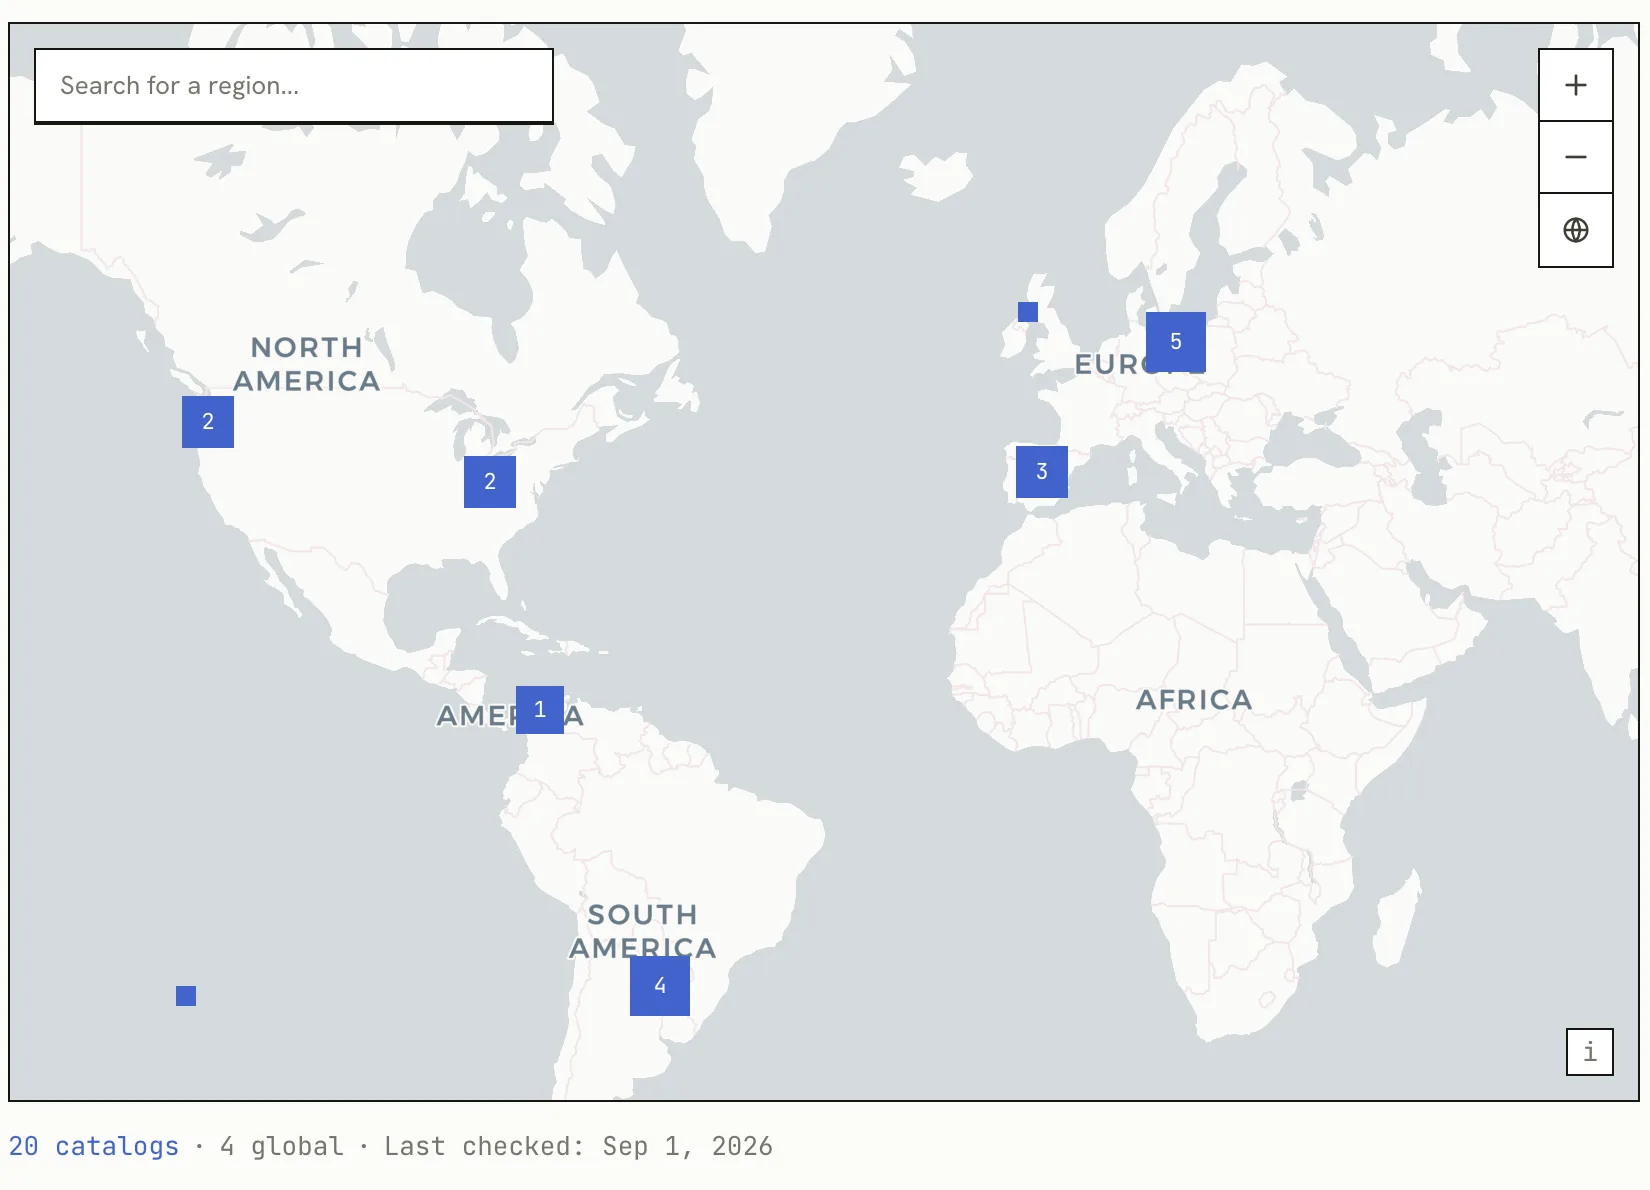
These are working catalogs built from real datasets. You can query them directly or point an agent at the registry and ask it to find relevant data across several publishers. Each result carries its producer, the licence, and a link back to the authoritative source.
The network becomes more useful with every well-described catalog that joins it. More publishers mean better geographic coverage, more kinds of data, and a greater chance that an agent can find the right combination of sources for a question. Because the catalogs follow the same basic conventions, discoverability improves without requiring every publisher to move its data into one central platform.
Usage can create a feedback loop that traditional portals rarely had. More published data leads to better answers. Better answers lead to more usage. Telemetry, empty searches, access requests, and quality reports then show publishers what people need, which datasets matter, and where improvements would have the most value. Publishers can respond by improving documentation, fixing data, changing access, or releasing new datasets, which makes the next answer better again.
For commercial and licensed data, that increased usage can also support the economics of maintaining the data. A publisher that can see demand, manage access, and charge where appropriate has a clearer path to sustaining the catalog over time.
Portolan is still early. The specification and tooling will continue to change as more publishers test them against different datasets and operating environments. The next useful milestones are more catalogs, wider format coverage, native support in more clients, and implementations from organizations other than CARTO.
Give it a try
Let us work with you to show what this new way of publishing data could look like for your organization.
For publishers that already expose data in cloud-native formats, the first step may be mostly about metadata: organizing the catalog, adding the documentation agents need, and making the existing files discoverable through Portolan. There may be no reason to move or convert the underlying data.
Where the current infrastructure relies on traditional services or formats, we can build a proof of concept from a representative group of datasets. The aim isn’t to replace an entire national SDI in a few weeks. It is to make the architecture concrete enough to evaluate: the catalog in infrastructure you control, an AI interface on top of it, and a real question answered by discovering and federating the necessary sources.
The serverless model makes that experiment much less expensive than building another portal or standing up a parallel serving stack. It gives publishers a way to test the approach, understand what would need to change, and plan a broader modernization at the right pace.
Get in touch and let’s build the first example together.
If you’d rather start with the open project, the specification, tools, and registry are available at portolan-sdi.org, and the community meets in the open every week.
Frequently Asked Questions
What is Portolan?
Portolan is an open specification and toolkit for publishing geospatial data as files in storage the publisher controls, with no server, database or custom API in the request path. It builds on STAC for catalog metadata and on GeoParquet, COG and PMTiles for the data, and adds the practical conventions that matter in production: spatial ordering, bounding-box metadata, CORS, README documentation for people and AGENTS.md guidance for AI agents. A validator checks catalogs against the specification, a CLI builds them, and a public registry lists independently hosted catalogs so they can be discovered together.
How is a Portolan catalog different from a traditional geoportal?
A geoportal is a search box over metadata that hands you a download link and leaves the rest to a GIS specialist, while the publisher runs and pays for servers and APIs around the clock. A Portolan catalog is plain files in object storage: users and agents read only the bytes they need and run queries with their own compute, so the publisher pays for storage and egress rather than for servers running around the clock. Because every dataset carries machine-readable metadata and documentation, an agent can find it, understand it, and query it in place.
What is the difference between Portolan and CARTO SDI?
Portolan is the open specification and tooling, developed in public and free to use. CARTO SDI is CARTO’s commercial implementation of it, with three parts: a branded catalog through which people and existing GIS software find and access data, an AI interface through which users ask questions in natural language, and a control plane for governance, identity and access, usage and demand telemetry, quality and feedback, monetization, and writable data on Apache Iceberg. Everything CARTO SDI publishes remains a standard Portolan catalog in the publisher’s own storage.
Does using Portolan or CARTO SDI lock in my data?
No. The catalog is files in storage you choose, in the jurisdiction you choose, in open formats readable by QGIS, DuckDB, BigQuery, Snowflake and any STAC client. You can choose the query engine and which AI models are allowed to work with the data. Moving between providers or vendors does not require converting or republishing the catalog, which is why the serverless architecture is both the sovereign option and the inexpensive one.