Making the Map: Game of Thrones Trivia


Like much of the rest of the world the team here at CARTO includes dozens of passionate fans of HBO's megahit Game of Thrones which comes to its much anticipated conclusion this Sunday after 8 seasons. And while discussing debating and of course theorizing over who will sit on The Iron Throne at the end is fun we decided that in order to truly prove our fandom we would use CARTOs powerful Location Intelligence platform (especially CARTO VL our vector rendering library) to add to the hype.
Step 1: A Game of Ideas
We kicked off this project by brainstorming some ideas. Here is a small sample of ones that we considered before landing on what became our final product The Geom of Thrones:
- A map to track the whereabouts of some of our favorite characters using a time-series widget or slider to show their movement across The Seven kingdoms.
- A 'Dragon-Tracker " in the style of a "Santa tracker " for monitoring the movements of Drogon Rhaegal and Viserion.
- The Bloody Trail of Arya Stark a map focused just on Arya with data points for everyone she has introduced to her needle. (Given the events of The Battle of Winterfell this would have been particularly cool)
- A polygon map displaying Control of Westeros by House.
- A heatmap lighting up locations across Westeros whenever they are mentioned on Twitter
In the end we decided to go with an idea that would display some of the powerful interactivity available with CARTO VL while also allowing us to complete our project before the White Walkers arrived and The Long Night fell.
Inspired by the great Geoguessr we decided to create a map trivia game where every answer was a place in Game of Thrones. This map would serve as a good starting point for what is possible in CARTO VL (though certainly much more intensive animation capabilities exist) alongside simple code so anyone can jump in and understand what's happening.
Want to visualize and interact with large amounts of spatial data in your applications? Learn how to integrate CARTO VL in our upcoming webinar!
The Basemap of Westeros Essos and Beyond
To get our basemap started we leaned on the geometries that we had previously used back in August 2017 when we released a custom Game of Thrones basemap for CARTO users.
But since we were creating an interactive game based on questions of "where did this happen " place names and associated point locations needed to immediately came to the foreground.
As such some tweaking of the basemap was in order. To do this we created MBtiles in Tippecanoe and then brought them into Maputnik to make our design changes before loading it all back in to our infrastructure.
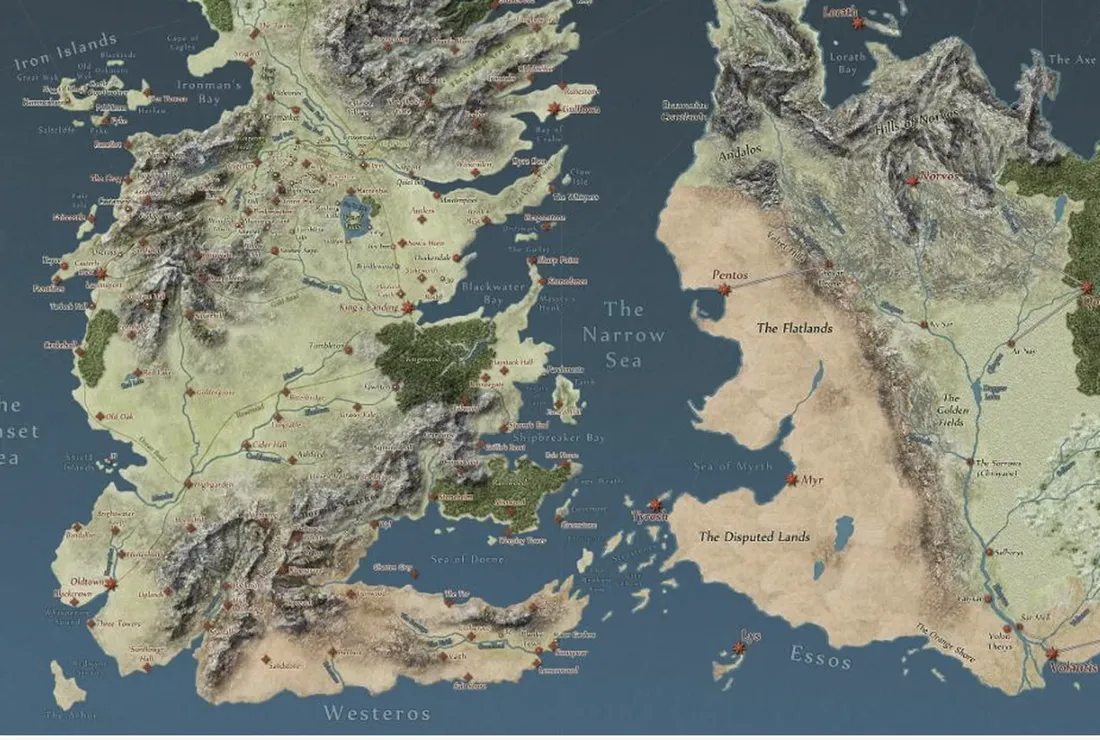
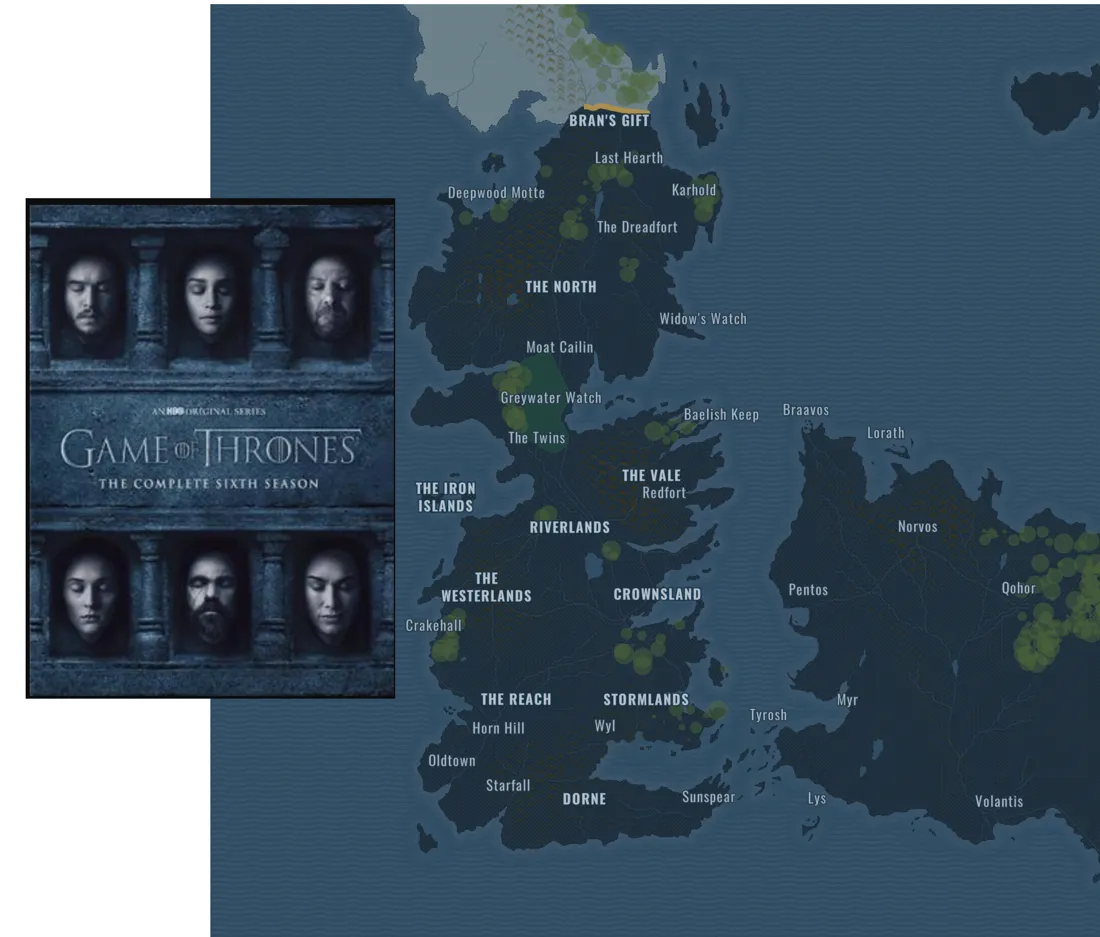
Unlike the "realistic" Game of Thrones map pictured above we needed to optimize the map for players. Keeping the base information pushed to the background with a dark color palette using subtle pattern fills on the land ocean and mountain regions ensured that the place name points colored a bright contrasting yellow were highest in the visual hierarchy of the map helping users to quickly be able to identify places as they played the game.
The color palette for our updated basemap was inspired directly by some of the show's marketing material from season 6.
Game Design
For the design of the game's look and feel CARTO designer Mireya Rico came up with an aesthetic reminiscent of old books like those you might find in the Citadel.
Given all of the gilding present in the design it seems she is our resident member of House Lannister.
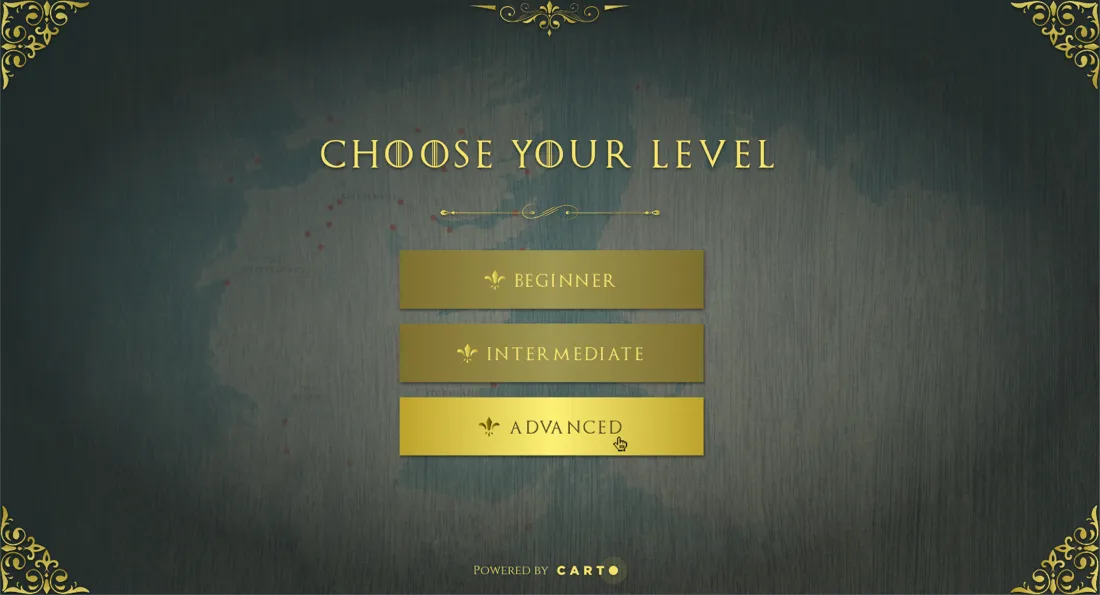
As for game design itself as you can see in the above image we initially thought about providing different levels of difficulty. Initially the intention was to differentiate the levels using cartography:
- Beginner: Only locations that serve as answers to our questions would appear on the map with labels so you can spot them easily.
- Intermediate: Included 'red herring' locations that while actual locations in the world of the show weren't answers to any of our questions.
- Advanced: Added still more locations and devilishly removed place labels.
After some user testing (that is showing the app to a cousin and Game of Thrones expert) we determined that Advanced with its lack of labels was perhaps too advanced. As such we decided to stick with only the intermediate difficulty.
The Trivia
The trivia itself was written in-house by our Content Marketing Manager who happens to be one of CARTO's many Game of Thrones nerds. He used information from Quartermaester.info and A Wiki of Ice and Fire to create a list of prominent locations from the show and wrote three questions for each location making up the game's trivia repository.
Creating the Web Application
Our goal was to ease both the development and deployment of the game so our best option was to create a static frontend application. This also comes in handy when learning to create easy out-of-the-box applications since you don't need a complex setup for local development and there are plenty of free options out there to deploy static applications.
The source code for the game is available on Github.
Here are some of the more interesting highlights from the web application's construction:
- The application is bundled with Parcel which we wholeheartedly recommend for simple frontend applications. With only the entrypoint `index.html` it manages to transpile and bundle the HTML the styles and the Javascript code.
- The game loop code is at `index.js`.
- The CARTO VL code for the visualization setup and the interactivity handling is at `map.js`.
- No framework was harmed during the development of this application. We used `templates` and DOM API to manage the UI.
- The location info is used by VL using a GeoJSON file: `locations.geo.json`. This way you don't need to rely on any backend to show geolocated data. The downside is that users need to download the whole file to use it but for simple apps like this one that's ok. All 250 locations and their data weigh 98K uncompressed.
- The line that connects two locations when an answer is incorrect is also a GeoJSON created on-the-fly. As seen in the code we modify the location data programatically to allow for smooth animation.
The finishing touches
In terms of features we rounded out our trivia game with social share functionality images of locations characters and descriptions based on scores and the ability of users to submit questions of their own for inclusion in the game. This proved to be an interesting exercise in quick application building using a range of tools and leveraging CARTO VL for responsive visualization.
As you wait for this Sunday’s blockbuster finale take some time to play for yourself and see if you have what it takes to sit on The Iron Throne!