

Map of the Month: Displacement Alert Map 2.0


Founded in 1974 the Association for Neighborhood and Housing Development is a coalition of community groups that aims to ensure affordable and equitable housing and neighborhoods for all New Yorkers. Created using CARTO.js and pulling in open data from multiple sources they hope the latest version of their Displacement Alert Map (DAP Map) will equip organizers decision makers and others with a tool to visualize understand and hopefully take action to fight housing displacement.
The Problem of Displacement
In their launch blog for DAP Map ANHD recognizes displacement as a widespread crisis in New York City that inordinately impacts the city's low-income residents and communities of color. And while this crisis can seem clear and obvious to residents who live in any of New York's rapidly gentrifying neighborhoods the nature of it is truly complex.
ANHD notes that while the problem of displacement is widespread across all of New York City the crisis looks very different from neighborhood to neighborhood. While some neighborhoods may lack rent-stabilized housing others may face greater risk of development and still others may see heightened levels of tenant harassment.
For organizers working locally being able to speak to specific issues and advocate for impactful change at the neighborhood level requires a deeper understanding.
New York City's Open Data
Fortunately much of the relevant data exists and is accessible via NYC Open Data the city's central open data hub. For DAP Map ANHD knew that they needed to pull in multiple data layers to allow users to see the key indicators of displacement. For this DAP Map is pulling in data for four "Risk Layers":
- Deregulation Risk - The change in the percentage of rent stabilized units between 2007 and 2016. Derived from property tax bills from the NYC Department of Finance.
- New Sale Risk - The most recent sale between 1/1/2007 and 7/31/2018 this layer can illuminate if a sale price might indicate a speculative investment strategy and is derived from the Department of Finance's rolling and annualized sales data.
- Construction Risk - Alteration new building and demolition permits issued by the NYC Department of Buildings between 1/1/2007 and 7/31/2018.
- Eviction Risk - The number of evictions executed by marshals in 2017 derived from open data from the NYC Department of Investigation.
For more info on these layers data sourcing and cleaning methodology check out ANHD's tutorial for DAP Map 2.0.
The DAP Map project wouldn't have been possible without NYC Open Data and the open data advocates like BetaNYC fighting for greater transparency. But not all of the relevant data is accessible. Hopefully with time greater transparency will bring access to even more datasets that will power the fight against displacement and unfair housing policy.
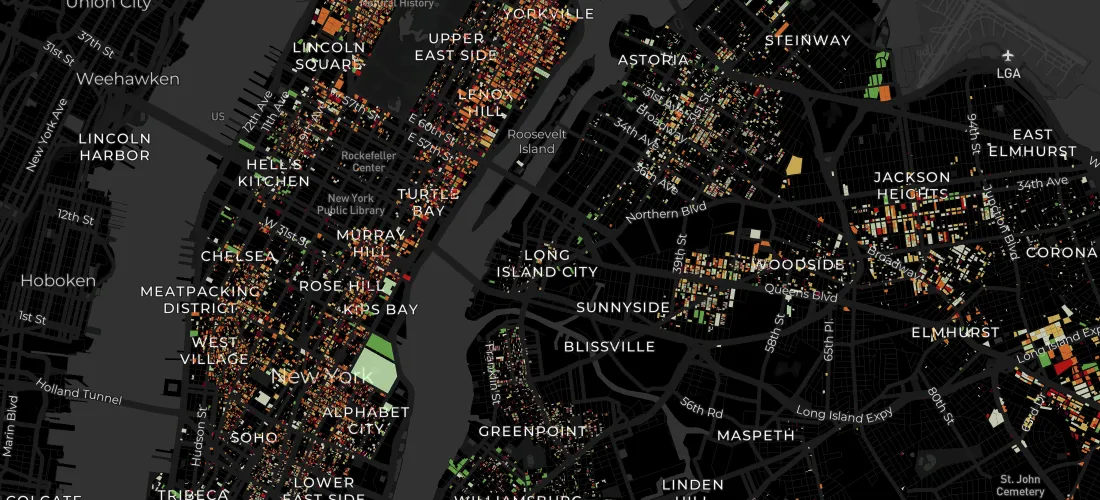
The Map
Carto's bread and butter–enabling spatial layers to be pulled from a data source styled to show patterns and made interactive to allow a user to dive into the data on their own–is just what we needed for this project.
- Lucy Block Research & Policy Associate Association for Neighborhood and Housing Development
The Displacement Alert Map was built using CARTO.js CARTO's Javascript library that interacts directly with CARTO's APIs. using CARTO.js developers can bring in their location data and build their own custom Location Intelligence solutions to drive intuitive geospatial analysis for their organization.
Learn more about CARTO.js and other tools for developers to built their own Location Intelligence solutions! Check out the recorded webinar!
In addition to displaying the four aforementioned layers of displacement risk the Displacement Alert Map offers a number of other key features to help users explore the risk in their neighborhoods and city wide. DAP Map offers layers that define City Council Districts Community Boards and Zip Codes to make local advocacy even easier. They also have a quick search that allows users to zero in on a specific address.
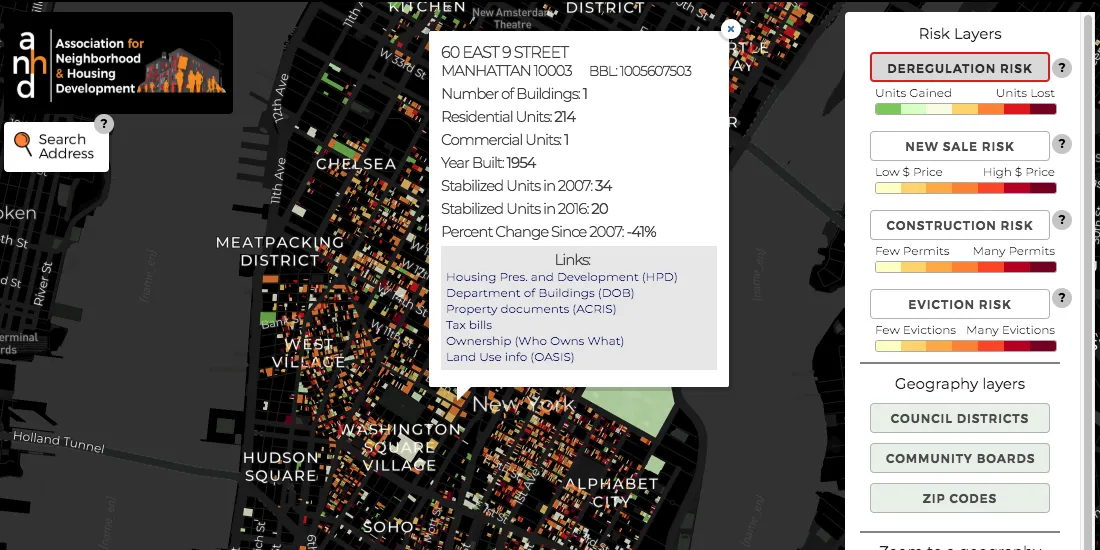
By clicking on a specific building users are able to pull up a layer-specific detailed view of that building (Stabilized unit quantities recent sale price evictions and more.) as well as access links to outside resources that can provide greater context around ownership financials and history of that property.
Solving Complex Problems with Location Intelligence
The Association for Neighborhood and Housing Development's latest version of the Displacement Alert Map is a powerful tool for community members local advocates and city that needs to actively address the continued displacement of its low-income residents and communities of color.
Using Location Intelligence tools and drawing on the growing availability of open data DAP Map serves as a perfect example of how organizations can solve complex problems with modern technical solutions.


