PlacePulse Embeddings: a Fingerprint for Every Place in the US


Almost every applied spatial question comes back to the same thing: what is this place actually like? Who lives and works here? What does the local economy look like? What environmental risks does it face? Answering these questions has traditionally meant gathering, joining, and engineering hundreds or thousands of variables for each new project.
The same AI advances behind today’s foundation models are now reaching spatial data, and Geospatial Foundation Models are the natural next step: instead of assembling hundreds of variables every time, you start with a single representation of every place in the country. PlacePulse Embeddings, the foundation model built by CARTO and Applied Geographic Solutions (AGS), provides exactly that: a single vector for every location in the US that captures its overall profile (its people, economy, housing, commercial activity, and environmental characteristics), ready to compare, cluster, and predict from.
What is an Embedding?
Unlike traditional models, which are built for a single purpose from a handful of carefully chosen datasets, foundation models are pre-trained on large amounts of data and can be adapted to many different tasks. Rather than producing a prediction directly, they learn a general representation of their inputs.
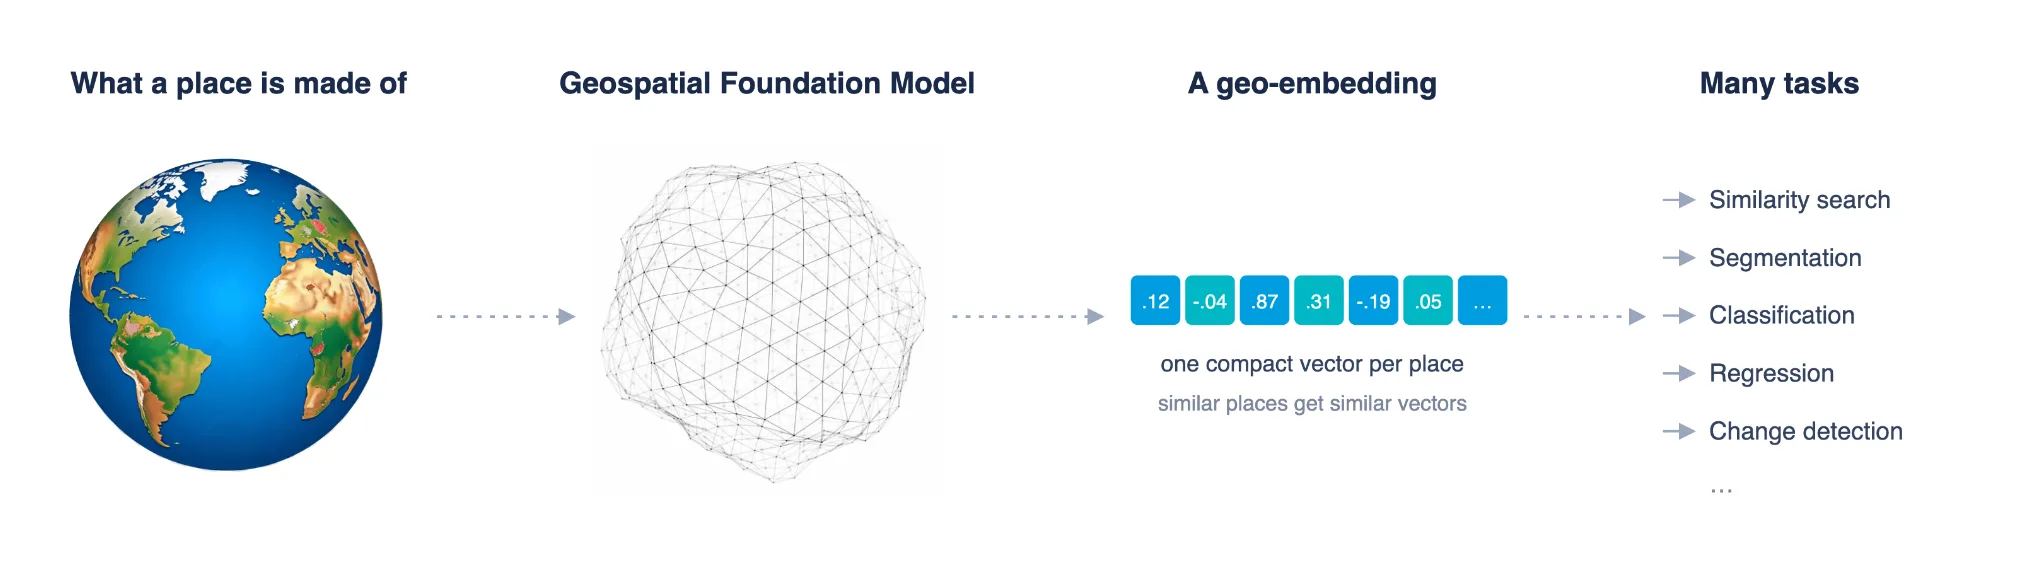
In the geospatial case, that representation is a geo-embedding: a compact vector that acts as a digital fingerprint of a place, capturing its overall character. Places with similar demographics, economies, built environments, and/or environmental conditions end up with similar vectors. Places that differ end up farther apart in the vector space.
If you’d like a deeper introduction, we recommend reading our earlier blog post, “Turning Geospatial Foundation Models into Decisions using CARTO Workflows”. It explains the concepts behind geospatial foundation models and shows how embeddings can be used in practice for tasks such as mapping spatial patterns, clustering areas for planning, detecting change after events like floods, finding comparable ZIP codes, and building features for predictive models.
PlacePulse Embeddings Foundation Model
Geospatial foundation models today are typically built from one of three kinds of data.
The first is signals of human activity: where people move, how busy a place is through the day, foot traffic and visits to points of interest, commuting flows, and web-search interest. These models are very good at capturing the rhythm of a place — how it behaves hour by hour and season by season.
The second is satellite and street-level imagery (e.g. AlphaEarth, Clay, TESSERA), which captures the physical appearance of a place: land cover, building density, road networks, vegetation, water and terrain.
The third is the lasting, structural makeup of a place: its detailed demographics, business mix, built environment, and climate and environmental risk, at fine resolution and national scale.
These three families answer different questions and are strongest in combination. Activity models tell you how a place behaves; imagery tells you what it physically looks like; structural models tell you who lives and works there and how a community is composed. PlacePulse is built to capture that third signal, and to sit alongside the other two rather than replace them.
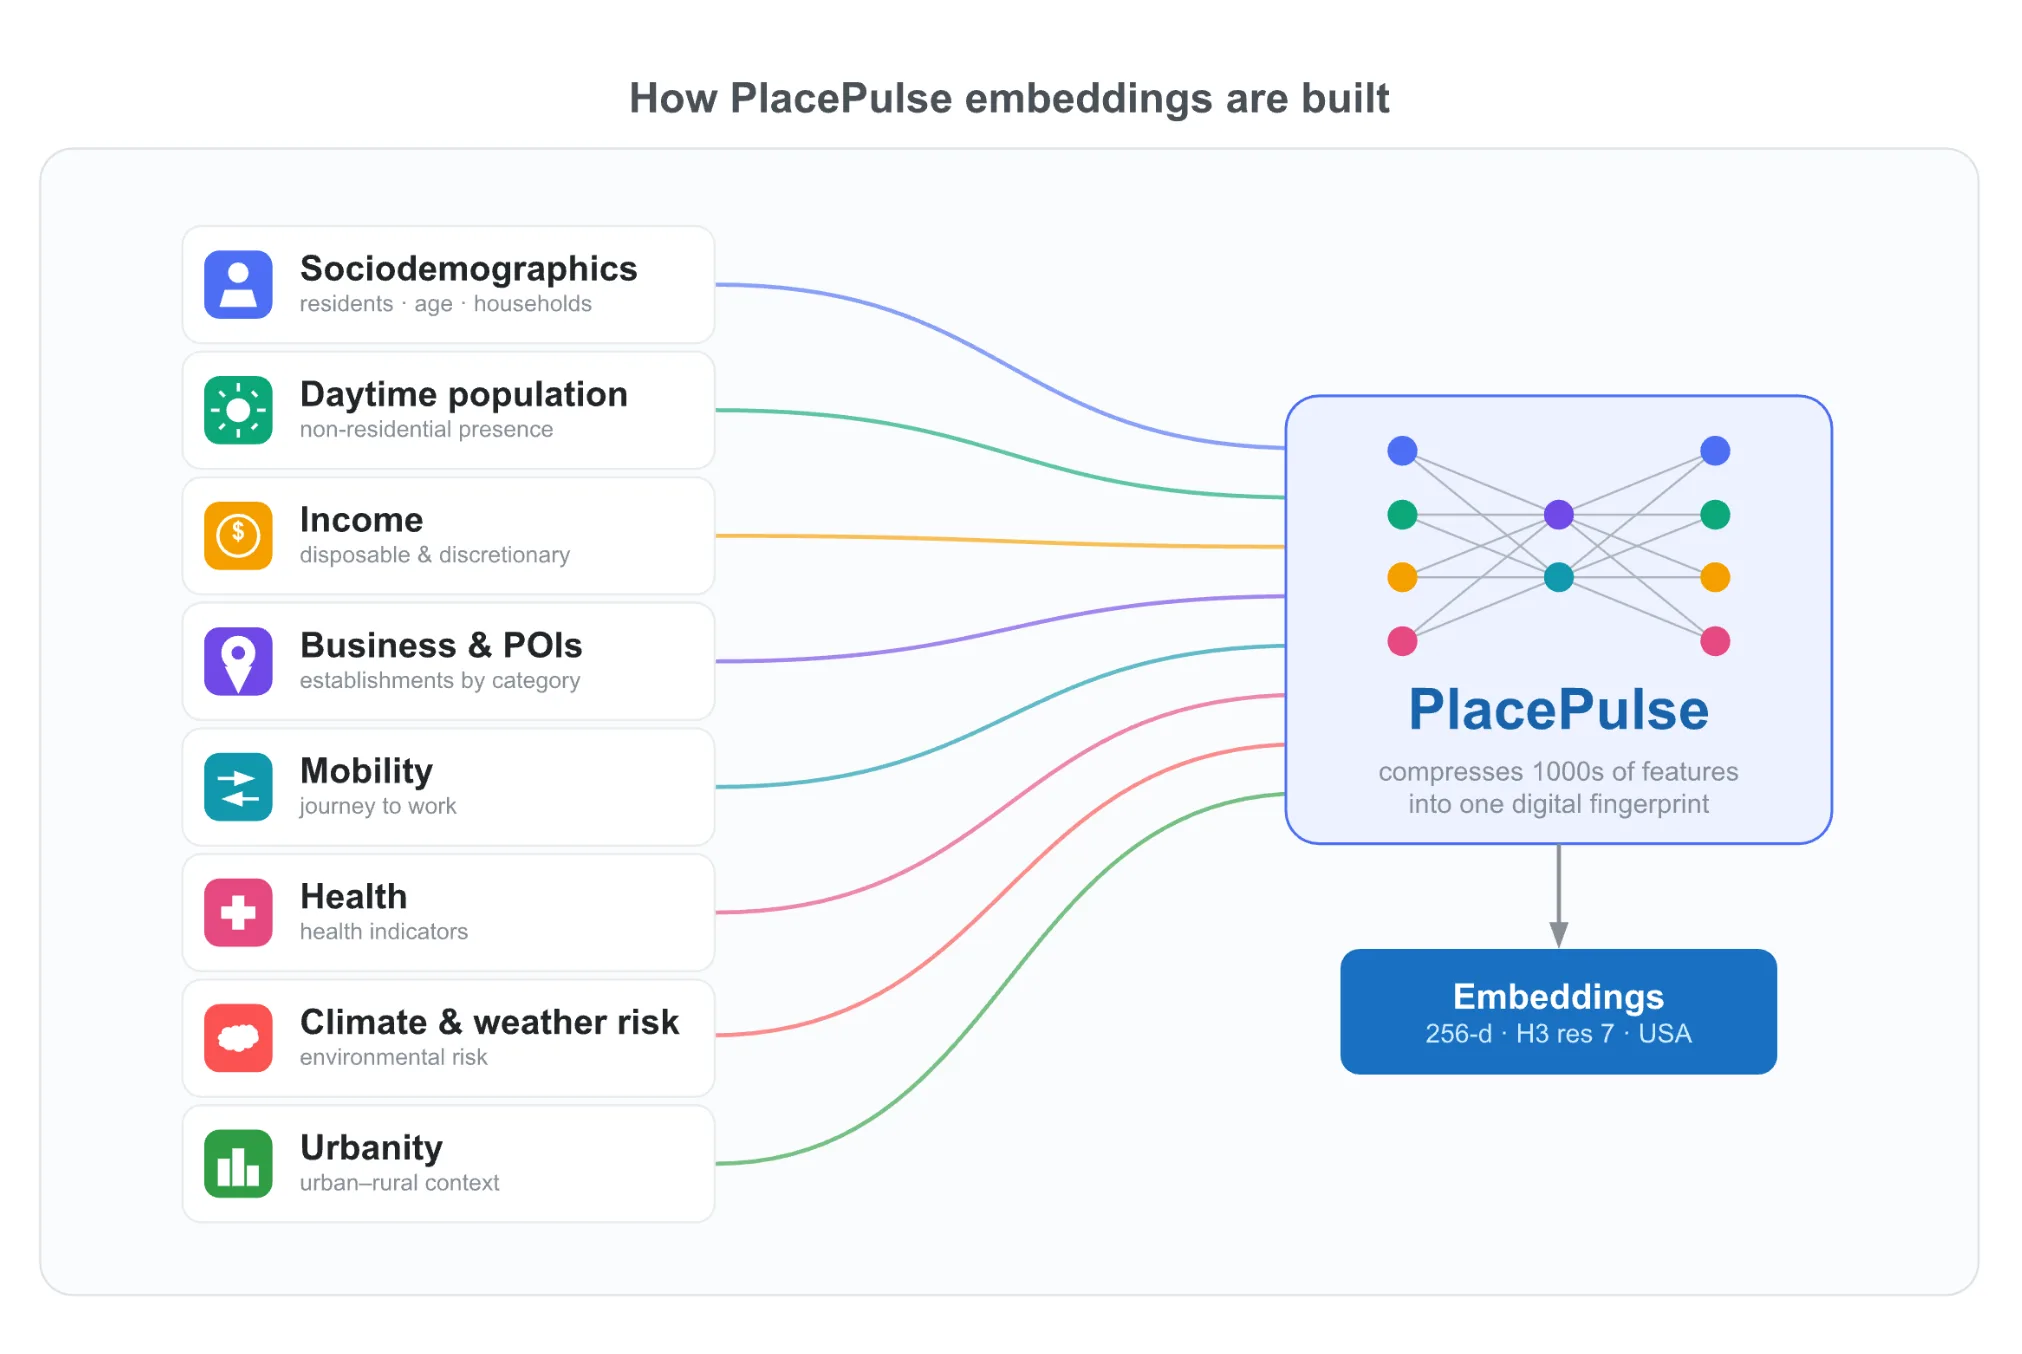
CARTO’s PlacePulse foundation model is built from one of the richest collections of structural data available for the United States, curated, processed and maintained by Applied Geographic Solutions (AGS). It combines detailed 2025 information on demographics, business activity, commuting, health, income, as well as climate and environmental risk. You can explore their commercial datasets in our Data Observatory. Rather than exposing thousands of individual variables, our GeoAI model compresses them into a single 256-dimensional embedding for every location.
A few things make it practical for real work:
- National and fine-grained. There is an embedding for every populated H3 cell in the US: about 1.06 million hexagons of roughly 5 km² each (H3 resolution 7). Coverage is consistent, everywhere from dense downtowns to rural counties.
- Built on structural data. It relies entirely on published structural datasets. As a result, it describes the lasting composition of a place, making it a natural complement to mobility- and imagery-based foundation models. Raw data updates twice a year.
- Learned without labels. The model was trained through self-supervision to reconstruct the structural profile of each place, without optimizing for any specific downstream task. That is what makes it general purpose: because it was not tuned for one problem, it helps with many.
- Normalized by design. Every embedding has unit length, making similarity comparisons both simple and consistent. Comparing two places reduces to a single dot product, enabling efficient vector operations at national scale.
The result is not another geospatial dataset with hundreds of columns, but a compact representation that preserves the relationships between places while being simple to store, compare, and use as input for downstream models. The map below lets you explore the patterns learned by the PlacePulse model.
Map showing the visualization of the embeddings using the Visualization component available in CARTO's Analytics on Embeddings Extension Package for CARTO Workflows.
Two examples to put the embeddings to work
Similarity Search
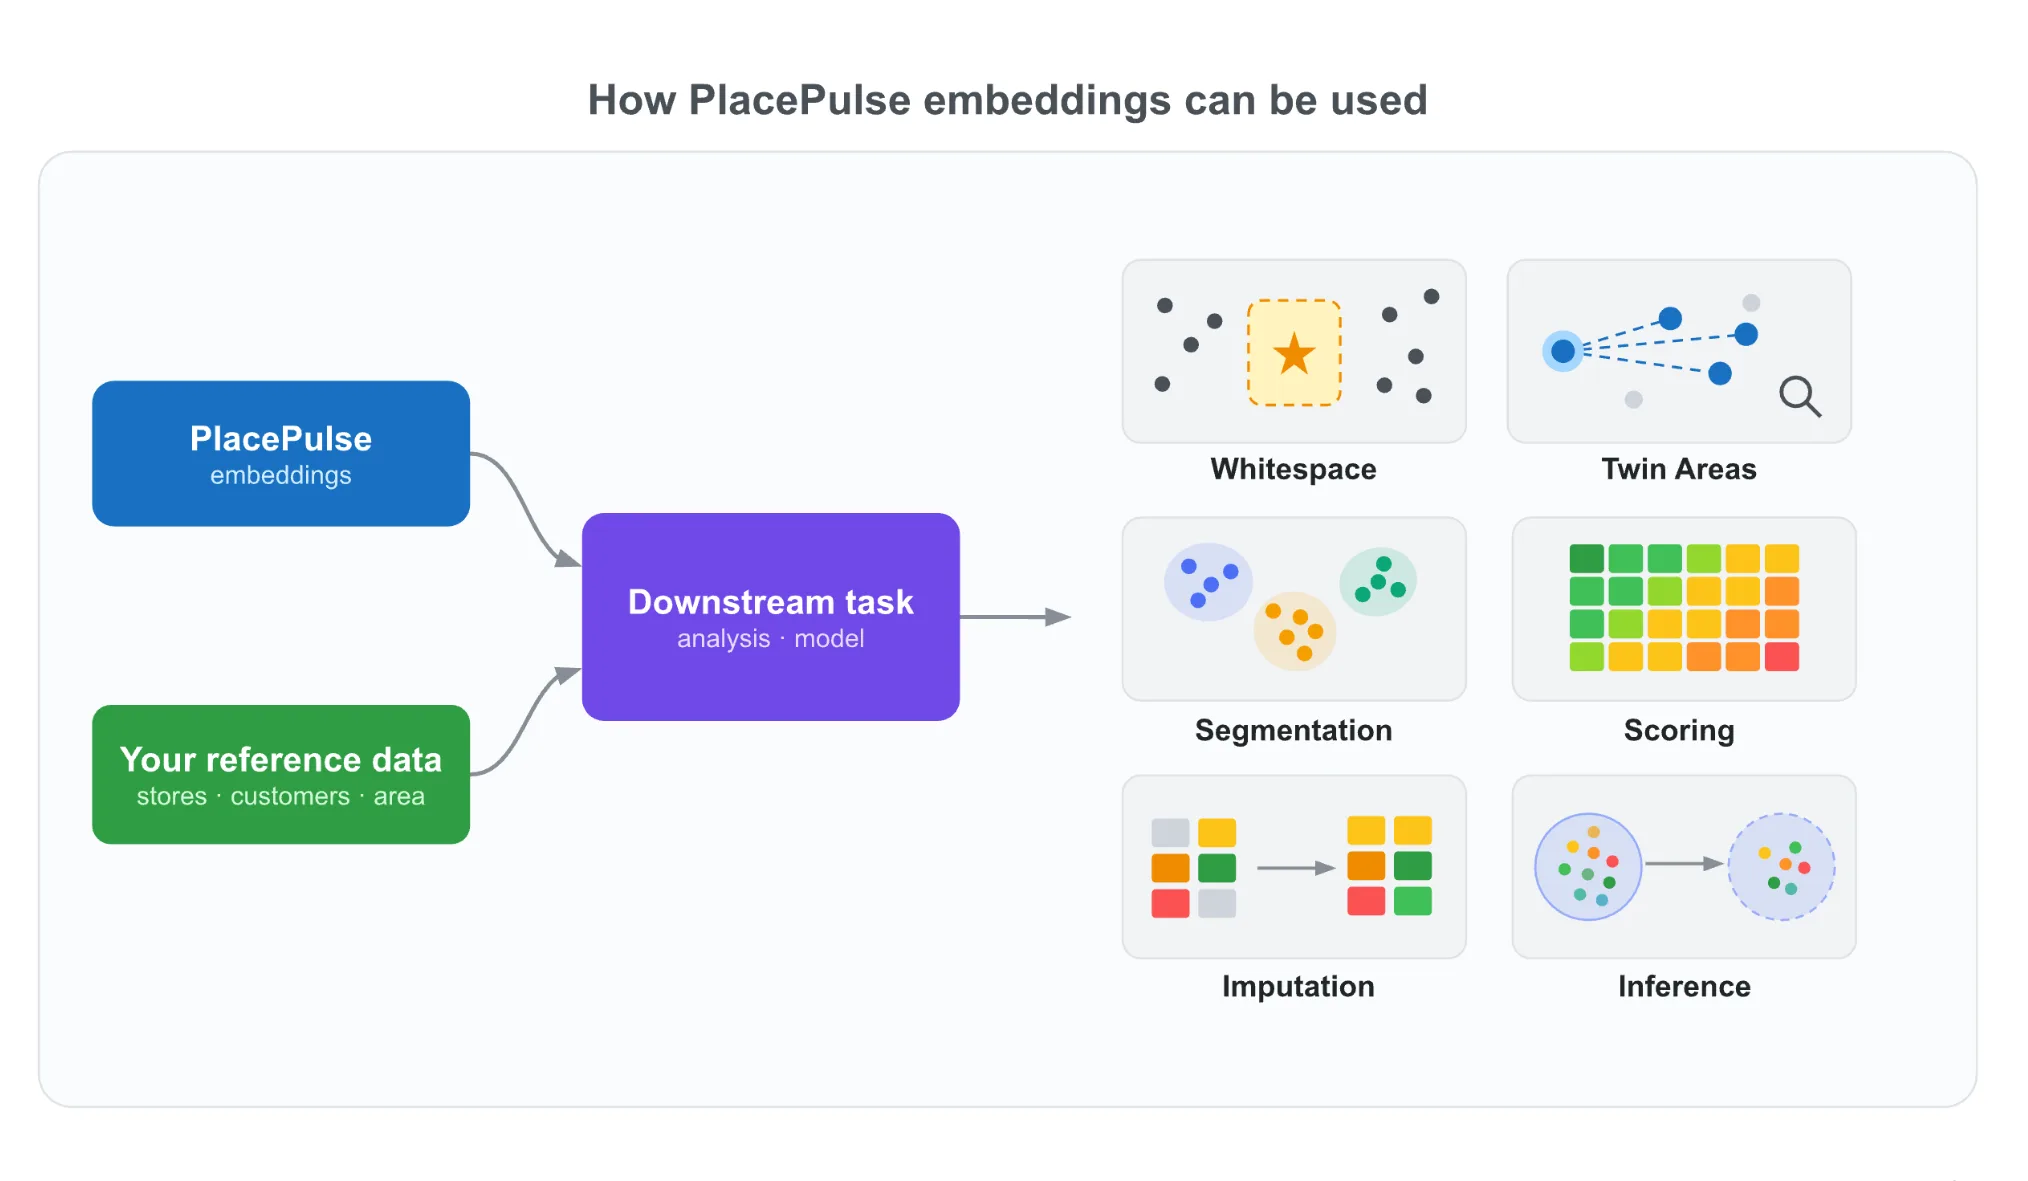
Because every place is represented by an embedding, comparing places is as simple as measuring the distance between their vectors. That covers a whole family of everyday spatial work:
- Twin areas. Find neighborhoods across the country that most closely resemble your best-performing markets.
- White space. Identify places that look like your customers but where you have no presence.
- Site screening. Compare candidate locations with the places you already serve to assess fit and potential cannibalization.
- Segmentation. Cluster places into coherent, data-driven place types without hand-selecting the variables that define them.
As a quick example, we used PlacePulse embeddings to build a retail fingerprint for a premium grocery brand with a well-defined customer profile. When high-performing stores share a remarkably consistent embedding signature, we can score every H3 cell in the country by how closely it matches this fingerprint, producing a nationwide ranking of expansion opportunities, from Prime to Low Potential. Explore the full ranking on the map below.
Nationwide expansion-opportunity ranking for a premium grocery brand, scored by how closely each H3 cell matches the brand's retail fingerprint. Open it in full screen here.
Because the comparison runs over a single compact vector, the same fingerprint scales to the whole country in one pass, turning a slow, manual screening exercise into an automated ranking that site selection teams can act on directly.
Outcome Prediction
The embeddings also work as ready-made inputs to a Machine Learning model. Whether you’re estimating customer demand, infrastructure needs, health outcomes, or risk, the embeddings provide a compact representation that often replaces hundreds of manually assembled variables. You can use them on their own or combine them with task-specific features to build more accurate models with far less feature engineering.
Typical applications include:
- Predictive modeling. Use embeddings as features to estimate outcomes, such as EV charger demand, retail sales potential, insurance claims, or health risk.
- Missing-data imputation. Fill in values where observations are sparse or unavailable, like broadband availability or cell tower counts.
- Spatial transfer. Train a model in one region and apply it to new geographies, such as predicting infrastructure needs in states the model has never seen.
As a simple example, we trained a model to predict the number of cell towers in an area using data from California, Texas, and New York. We then applied the model to Florida, a state it had never seen during training, using only PlacePulse embeddings as predictors. The results can be seen in the map below. This type of analysis can help telecommunications providers identify potential coverage gaps and prioritize future network expansion.
Open it in full screen here.
Despite never seeing Florida during training, the model accurately reproduces the broad spatial distribution of cell towers across the state, achieving an R² of 0.688, demonstrating that the embeddings capture structural patterns that transfer across geographies and can be used as powerful, ready-made features for downstream predictive models.
And many more!
The examples above only scratch the surface. In the coming weeks, we’ll publish a series of deep dives into both the applications and the inner workings of PlacePulse embeddings. We’ll showcase real-world workflows, from retail expansion and infrastructure planning to predictive modeling and neighborhood intelligence, while also exploring the technical foundations of the model, including how the embeddings are built, interpreted, and applied. Stay tuned!
PlacePulse embeddings in CARTO: a building block for Agentic GIS
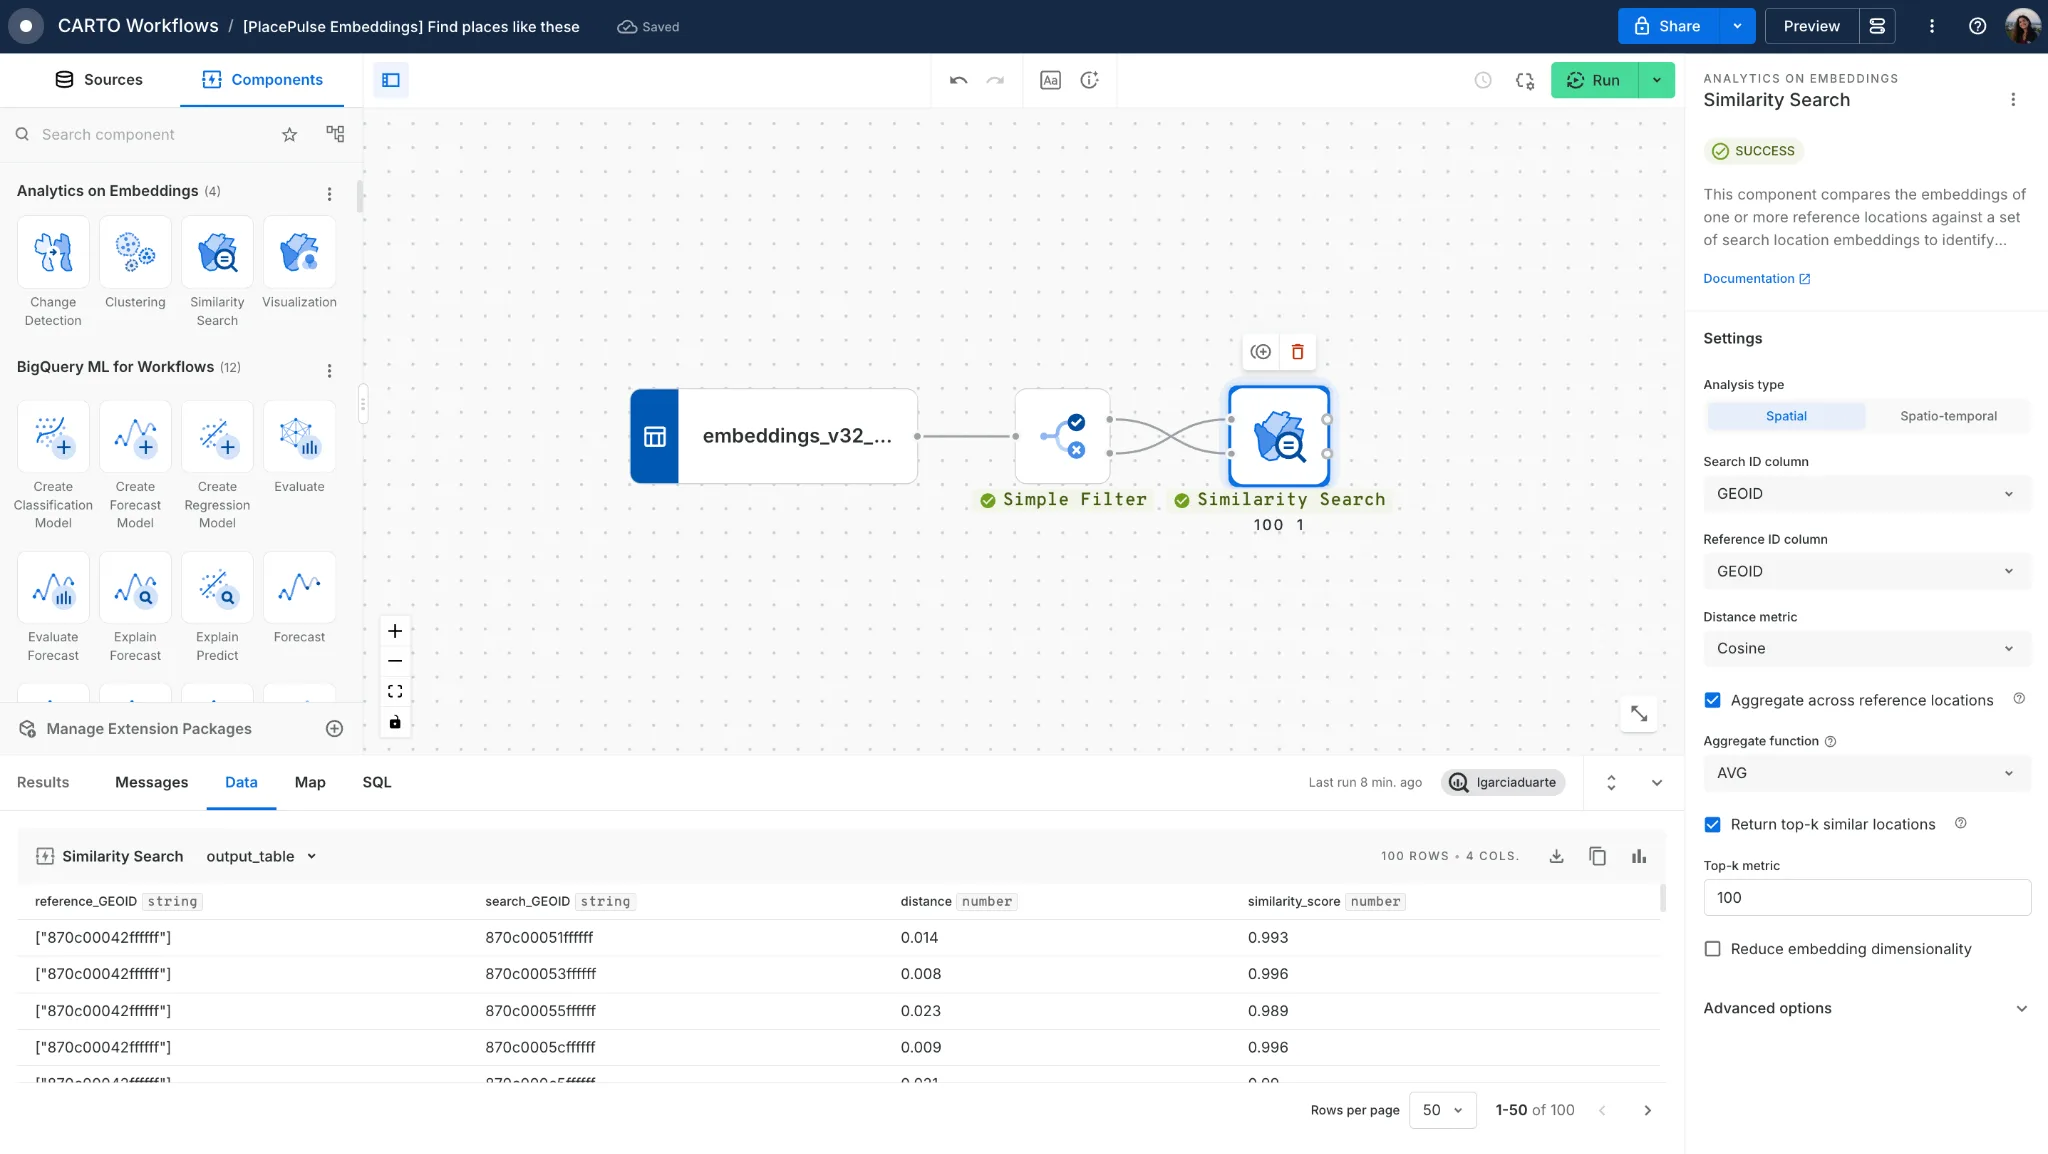
PlacePulse Embeddings are designed to be used directly in CARTO. Because the model has already learned a generalized representation of place, you don’t need machine learning expertise or a feature engineering pipeline to put them to work. The analysis happens where your data already lives.
The embeddings will be distributed through CARTO’s Data Observatory, so once subscribed you can query them as a ready-to-use dataset directly in your connected cloud data warehouse. From there, the embeddings can be consumed through CARTO Workflows, the platform’s low-code analytics canvas. Complex operations on high-dimensional vectors are exposed as drag-and-drop components in the Analytics on Embeddings Extension Package: you connect the PlacePulse embeddings to a component, optionally combine them with your own reference data, and run the analysis at national scale without writing the vector math yourself. Everything executes in-warehouse, so results are scalable and reproducible, and the embeddings never have to be moved or exported.
Together, these components support the full range of use cases covered in this post: finding look-alike areas, spotting white space, screening candidate sites, segmenting markets, and using the embeddings as ready-made features for predictive models. We describe these workflows in more detail in this post. Go check it out!
Available in Private Preview
CARTO’s PlacePulse Embeddings foundation model is now available in private preview and will soon be released as a fully commercial data product. We’re offering early access to a small group of CARTO customers to explore what they can build with it, from similarity search and market segmentation to predictive modeling.
If you’d like early access to the US PlacePulse embeddings and want to explore how a geospatial foundation model could fit into your own workflows, we’d love to hear from you! Whether you’re looking for comparable markets, clustering places into meaningful segments, or building better predictive features, we’re happy to help you get started. Request early access and we’ll get you set up.