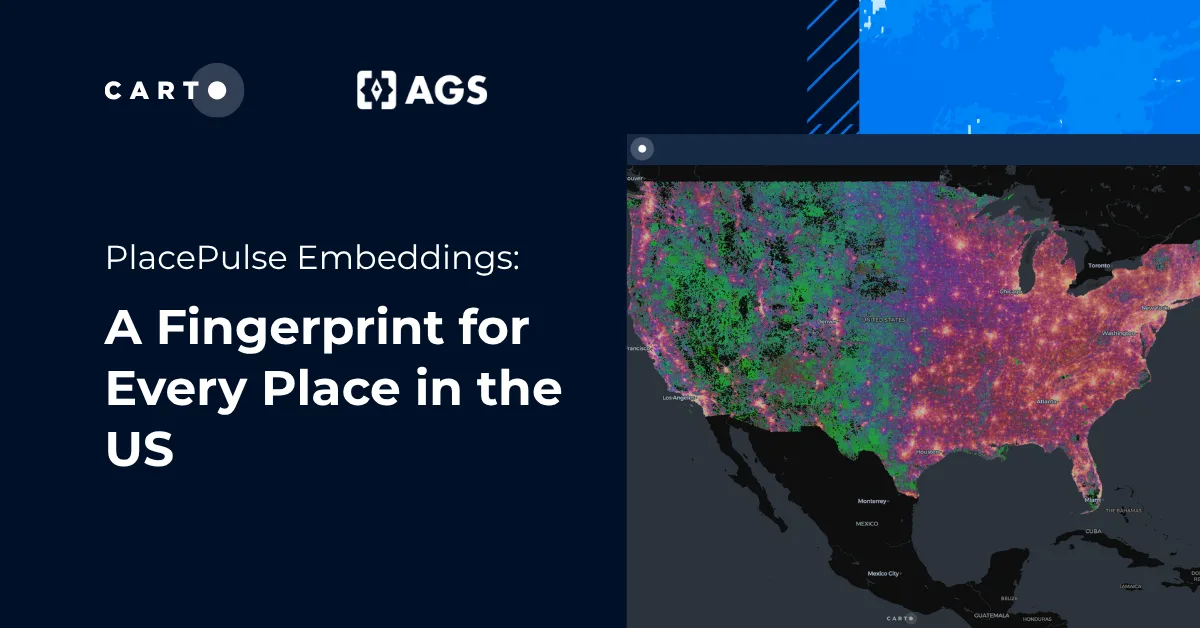
Building a Retail Fingerprint with PlacePulse Embeddings


New to PlacePulse Embeddings? PlacePulse is CARTO’s geospatial foundation model, built in collaboration with Applied Geographic Solutions (AGS). It represents every location in the United States as a 256-dimensional embedding that captures its structural characteristics, which lets you perform tasks such as similarity search, clustering, and predictive modeling. If you’re new to PlacePulse, we recommend starting with our introductory post, where we explain how the embeddings are built and the kinds of problems they solve.
Every store expansion conversation eventually arrives at the same question: what do our best locations actually have in common?
The traditional answer is usually a list. Median income above a certain threshold, enough households within a given drive time, a particular population density, the right mix of businesses nearby. But a great location is rarely defined by one characteristic. It works because many characteristics come together: the people who live there, the local economy, the businesses and amenities around them, and the broader environment.
So what if, instead of deciding which variables define a great location, we let the best locations define themselves? That’s the idea behind a retail fingerprint built with PlacePulse Embeddings.
From individual characteristics to a fingerprint of place
Let’s take the example of a premium grocery retailer with a well-defined customer profile, a national footprint, and stores that clearly perform better in some markets than others.
Imagine taking the retailer’s strongest-performing locations and asking a simple question: what do these stores’ catchment areas look like?
Traditionally, answering that question would mean assembling and analyzing hundreds of demographic, economic, and business variables. You would then need to decide which ones matter, how much they should be weighted, and how to combine them into a profile of the “ideal” location.
That approach can miss something important: a location’s potential isn’t defined by any single characteristic, but by how different characteristics come together.
Two neighborhoods can have similar household incomes but very different populations, business environments, levels of activity, or surrounding communities. Looking at individual variables can make those places appear similar when their overall character is not.
PlacePulse takes a different approach. It transforms the many characteristics of a place into a single digital fingerprint. Each fingerprint is a compact representation of the demographic, commercial, and environmental character of an area. Places that resemble one another across those dimensions end up with similar fingerprints.
That means we don’t have to decide in advance which characteristics make a successful store location. We can start with the locations that already work and search for places that look like them.
Discovering your retail fingerprint
We represent the area surrounding each location using its PlacePulse embedding and compare the locations using Similarity Search. The analysis measures how closely the embedding of each location matches the embeddings of the others, using cosine similarity. If successful locations share a similar underlying profile, they should consistently score highly against one another and form a tight group in the embedding space.
The result is striking: high-performing stores exhibit a remarkably consistent embedding signature, while lower-performing locations tend to appear as outliers. In other words, the successful locations aren’t just individually strong; they tend to operate in areas with a similar underlying character.
That consistent signature becomes your retail fingerprint. The map below shows existing locations classified by their sales performance, alongside an H3 layer in which each cell is colored according to its similarity to the cells of the top 10% of performing stores.
Map showing the retail fingerprint of existing stores relative to top-performing stores. Open it in full screen here.
Importantly, the fingerprint isn’t a single demographic profile. It isn’t “high income + high education + X population density.” It’s the combination of characteristics that makes these places similar. And because that combination is represented by an embedding, we can search for it without having to name every component ourselves.
Finding the next locations that look like your best ones
Once we have the retail fingerprint, the question changes from “What should our next location look like?” to “Where else does our successful-location fingerprint occur?”
PlacePulse lets us score locations across the United States according to how closely their surrounding profile matches the retailer’s strongest markets. The result is a nationwide ranking of expansion opportunities, grouped into four tiers from Prime to Low Potential that gives a retailer a fundamentally different way to explore expansion.
Instead of starting with a market, choosing a handful of variables, and building a bespoke site-selection model, you can start with your own network and let your successful locations define the pattern to look for.
And because the score is calculated across individual H3 cells, we can combine the similarity surface with other spatial constraints. For example, areas that are too close to existing stores can be excluded, allowing the same analysis to focus either on potential infill locations or on opportunities for expansion into new areas.
Whitespace opportunity in the New York-Philadelphia area. Open it in full screen here.
From similarity to an expansion strategy
This is where a retail fingerprint becomes more than an interesting map. A retailer can use it to identify locations that resemble its strongest markets, compare existing stores against the same benchmark, and explore where similar opportunities exist elsewhere.
The key is that the fingerprint is reusable. Change the locations used as your reference set and you can create a different fingerprint for a different business question. The same PlacePulse Embeddings dataset can therefore support multiple analyses without rebuilding a feature set from scratch.
This is one of the fundamental advantages of using a geospatial foundation model. PlacePulse is designed as a generalized representation of place rather than a model built for a single task. The same embeddings can be reused for similarity search, segmentation, prediction, and other spatial workflows.
Building the analysis in CARTO
This analysis can be reproduced end-to-end inside CARTO. PlacePulse Embeddings will be available through CARTO’s Data Observatory as a ready-to-query dataset in your connected data warehouse, but for now you can request early access here. From there, they can be used directly in CARTO Workflows, where high-dimensional embedding operations are exposed through low-code analytics components.
For the retail fingerprint, the workflow is straightforward:
- Start with the PlacePulse embeddings.
- Match the retailer’s locations to the areas they serve.
- Select the reference locations, i.e., the stores that define the successful profile.
- Use Similarity Search to find locations across the country with the closest fingerprints.
- Combine the resulting similarity scores with your own business constraints to identify expansion opportunities.
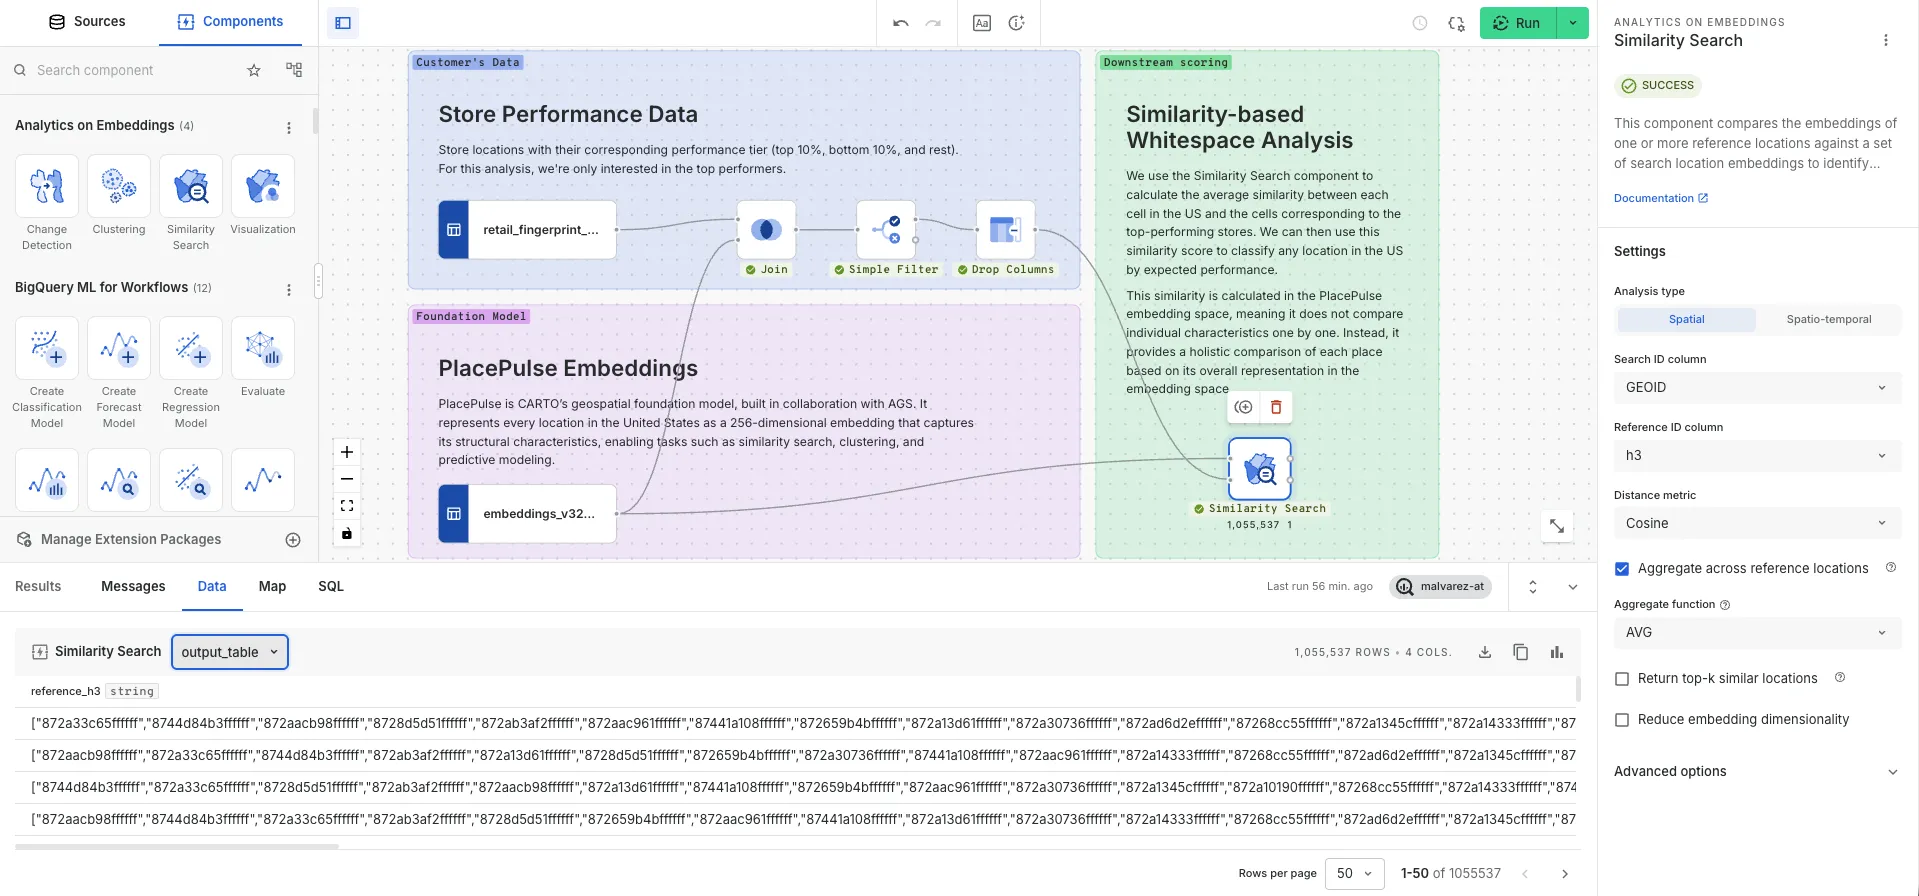
The Similarity Search component is specifically designed for the “find more places like this” question. Given one or more reference locations, it ranks other locations by how closely their embeddings match. The result is a workflow that turns a retailer’s existing footprint into a reusable spatial intelligence layer.
One fingerprint, many location questions
This example illustrates a broader idea. Any organization with locations that perform differently can ask: What do our best locations have in common and where else does that pattern occur?
For a retailer, that could mean finding new markets that resemble its strongest stores. For a bank, clinic, dealership, or gym, the same approach can help reveal where a proven location profile appears elsewhere.
The important shift is not from hundreds of variables to a 256-dimensional vector. It’s from asking “Which variables should define a good location?” to asking: “Which places already look like our best locations?” With PlacePulse Embeddings, that question becomes searchable.
Ready to explore what PlacePulse Embeddings can reveal about your own data? Request early access and we’ll help you get started.
Frequently Asked Questions
What is a retail fingerprint in PlacePulse Embeddings?
It’s the consistent PlacePulse embedding signature shared by a retailer’s best-performing stores. Instead of picking demographic or economic variables in advance, you compare the embeddings of your top locations using Similarity Search, and the combination of characteristics they share, across demographics, business mix, and environment, becomes a reusable fingerprint for finding more places like them.
How does PlacePulse find similar locations without choosing variables first?
Every location in the US already has a 256-dimensional PlacePulse embedding that summarizes its structural profile. Similarity Search compares embeddings using cosine similarity rather than comparing individual variables one by one, so it captures how many characteristics combine at a place rather than requiring you to decide which ones matter most.
Can this retail fingerprint approach work for businesses other than retail?
Yes. Any organization with locations that perform differently, such as a bank, clinic, dealership, or gym, can build a fingerprint from its strongest-performing sites and use it to score other locations across the country. The reference locations change, but the underlying PlacePulse Embeddings and Similarity Search workflow stay the same.
How do I build a retail fingerprint analysis in CARTO?
The workflow runs in CARTO Workflows: start with PlacePulse Embeddings, match your store locations to the areas they serve, select the reference stores that define your successful profile, run the Similarity Search component to score locations nationwide, then combine the resulting scores with your own business constraints to identify expansion opportunities.