

Spatial Data Simplified: Introducing Data Observatory 2.0


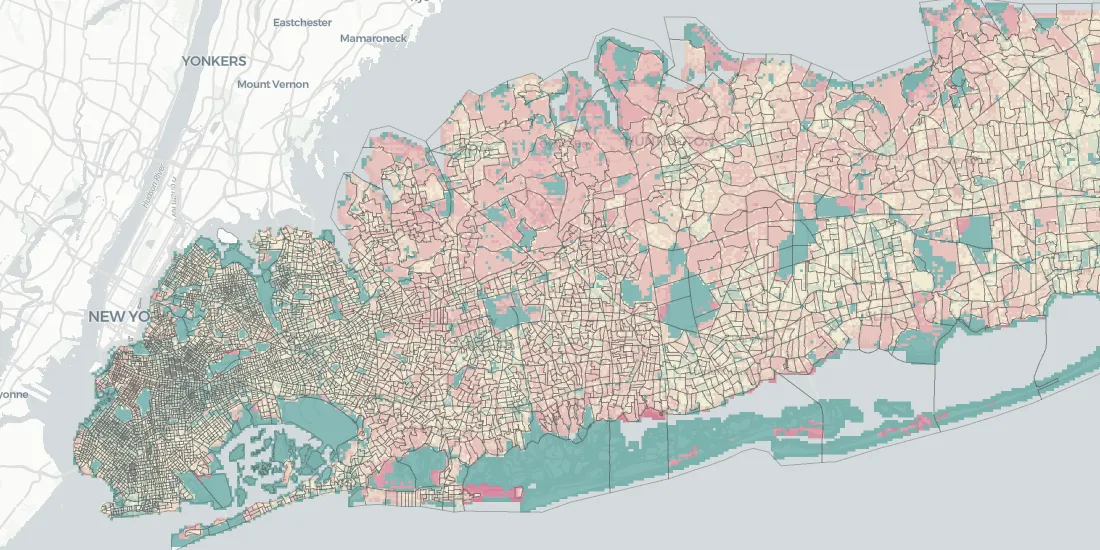
Data is an essential ingredient for spatial analysis—which is predicated on access to your own data plus useful third-party data. In the end spatial analysis is about putting your data in the context of its surroundings creating a greater understanding of your own geographies.
However the main problem in data analytics today is the amount of time Data Scientists spend gathering the right data. We frequently hear that 80% of their total analysis time is dedicated to gathering cleaning and feature preparation while only the remaining 20% is actually spent on analysis modeling and communication of results. In the case of Spatial Data Science this is an even bigger issue as gathering data requires working with highly varied sources.
Here at CARTO we’re on a mission to increase the efficiency of Data Science teams who need to work with spatial data and create spatial models.
We’re thrilled to announce a private beta release of Data Observatory 2.0 the latest version of our spatial data repository that enables Data Scientists to augment their data and broaden their analysis with the latest and greatest in location data—such as human mobility weather and financial transactions data.
This new version of Data Observatory will help Data Scientists to save time through an improved data experience via:
- Simple access to public data and integrated purchasing of commercial datasets
- Easier data joins for spatial analysis through a common geographic base
- Faster and more efficient Data Science workflows
Why does it take so long to gather and clean data?
Spending 80% of your time gathering and cleaning data is wasteful making your entire Data Science workflow longer and more tedious. Such a lengthy process also increases the probability of making mistakes that can put the validity of an entire model at risk. In many cases we see organizations not using third party data altogether because of the hassle.
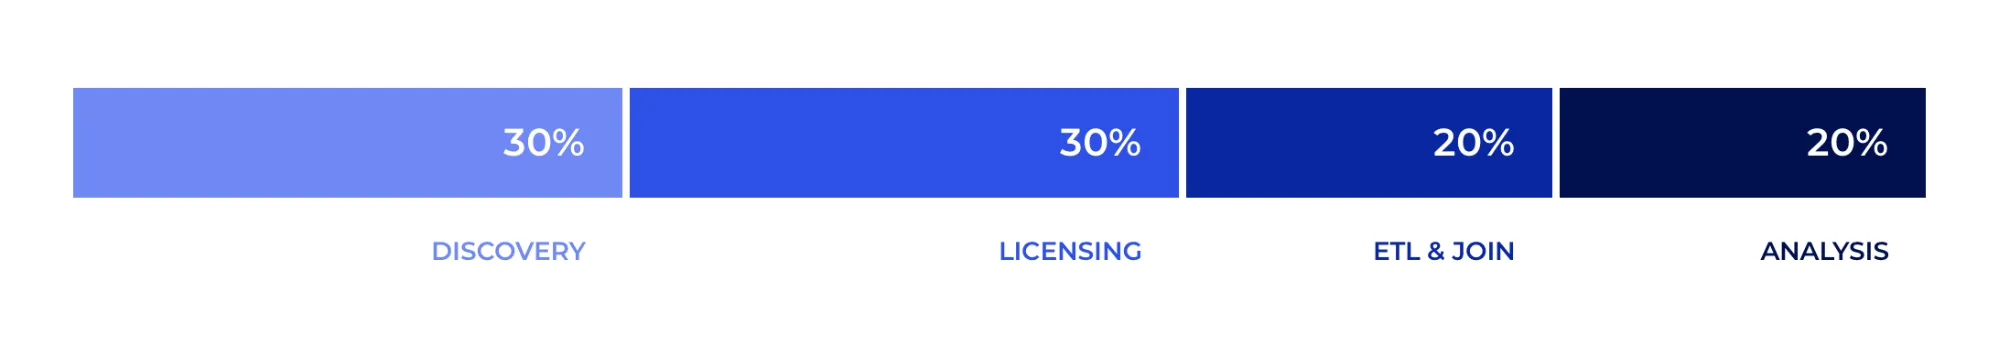
We found three key issues hindering the data gathering process:
- Discovery is hard. It’s often not obvious where to find location data streams to enrich your own data and it can be difficult to understand how they apply to your analysis. Often you don't even get a sample!
- Licensing can be a painful lengthy process: from vetting different providers to reaching legal agreements with them. It’s so slow that sometimes it feels like you need to send a fax to get access to a dataset and bargain with a sales rep.
- ETL and joining: The data is likely going to come in different formats and support geographies from different providers. First you need to perform ETL on them. Second the data will come in different geographic supports (e.g. census tracts grids road segments administrative areas). It is therefore a complex and error prone process for a Data Scientist to bring all this data into a common data structure suitable for data analysis where often you need to perform downscaling or upscaling of the data.
If an analysis took for example one full month to get done all three of these issues probably required around three weeks of work.
The result of this situation is not only frustration and a slowdown in the creation of analysis but also many organizations give up licensing third party data because it’s just too expensive. And not because the data is expensive but because the resource cost of acquiring it and making use of it can be far too high.
Data itself is not expensive—accessing and using it is and the root cause for this is how data is delivered.
Let’s take for example a Data Scientist who is working on a market analysis in Portugal for retail expansion. She will start looking for demographics purchasing power geographies etc. Let’s breakdown the costs (based on our own customers’ experience):
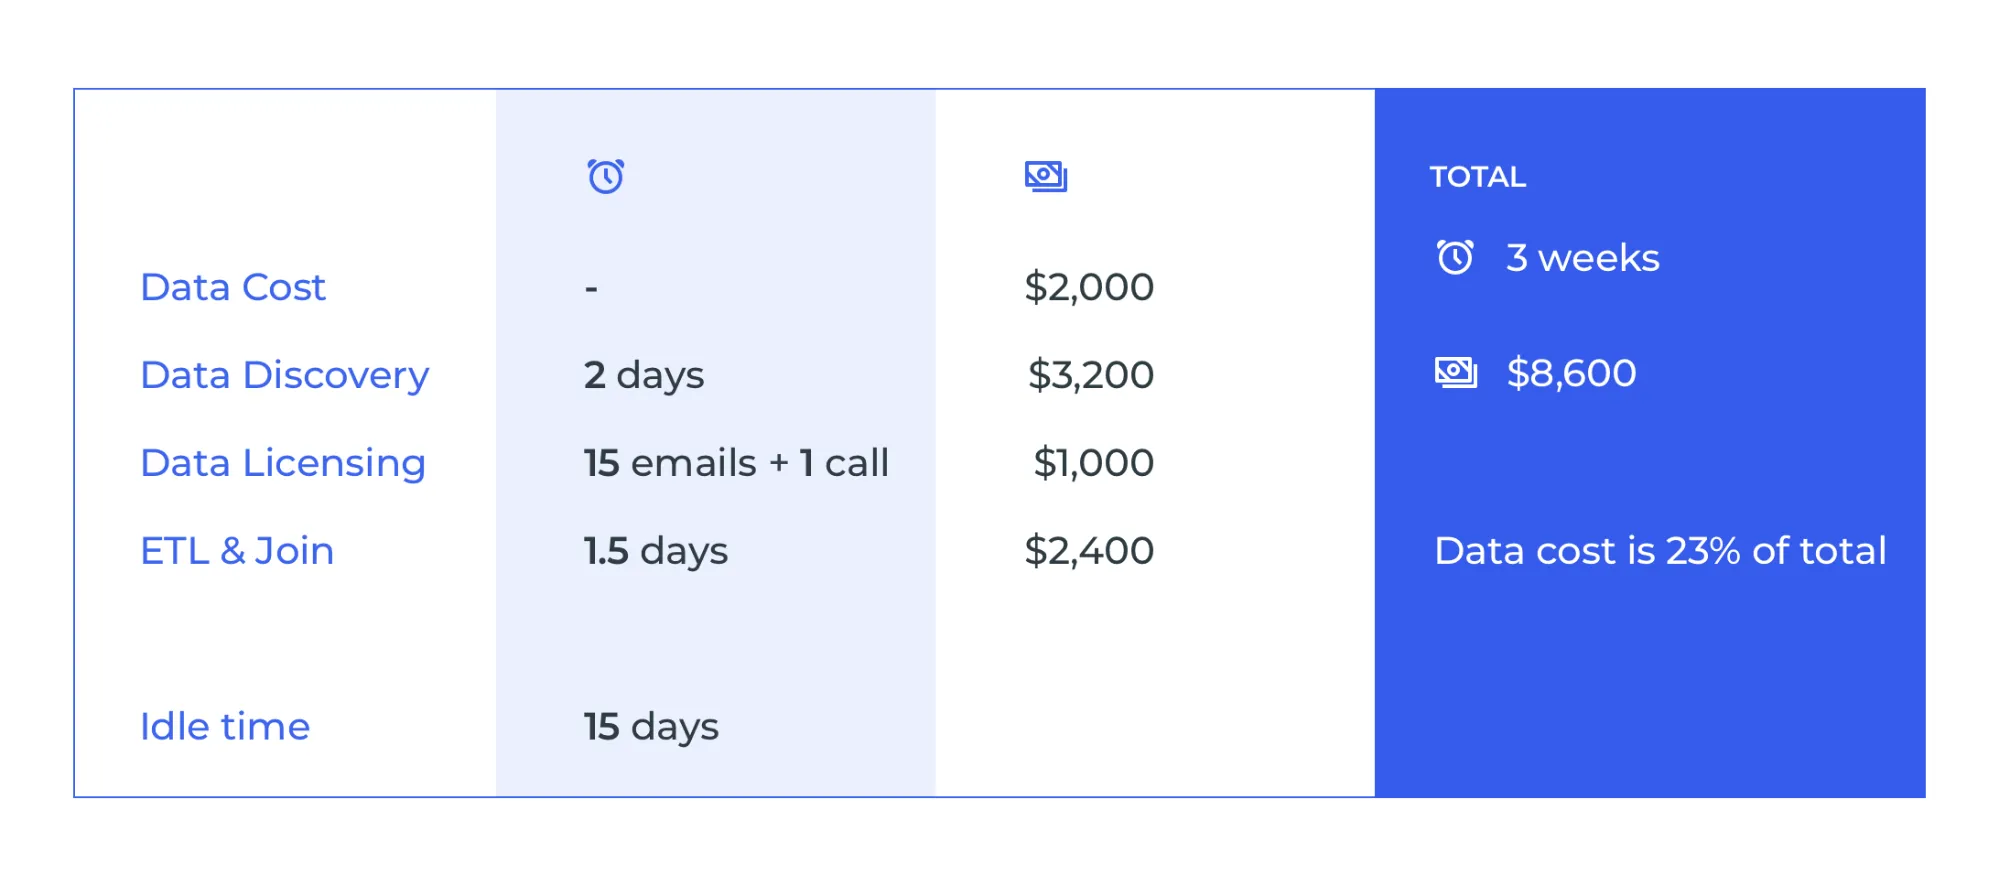
Data is not the most expensive piece by any means it is merely the overhead! This is reflective of the current drama of the data industry.
If we can reduce the cost of getting access to and using the data more data will be used and purchased and therefore the data cost will be reduced which will results in more data being used and so on in a continuous virtuous cycle.
How are we solving this with Data Observatory 2.0?
CARTO’s Data Observatory 1.0 already tackled some of these challenges but we saw an opportunity with Data Observatory 2.0 to think more holistically. Given all the broken processes in the location data industry it was time to rethink it from the ground up. With the release of Data Observatory 2.0 we’re introducing a new experience that will allow Data Scientists to unlock the power of spatial analysis and new location data streams.
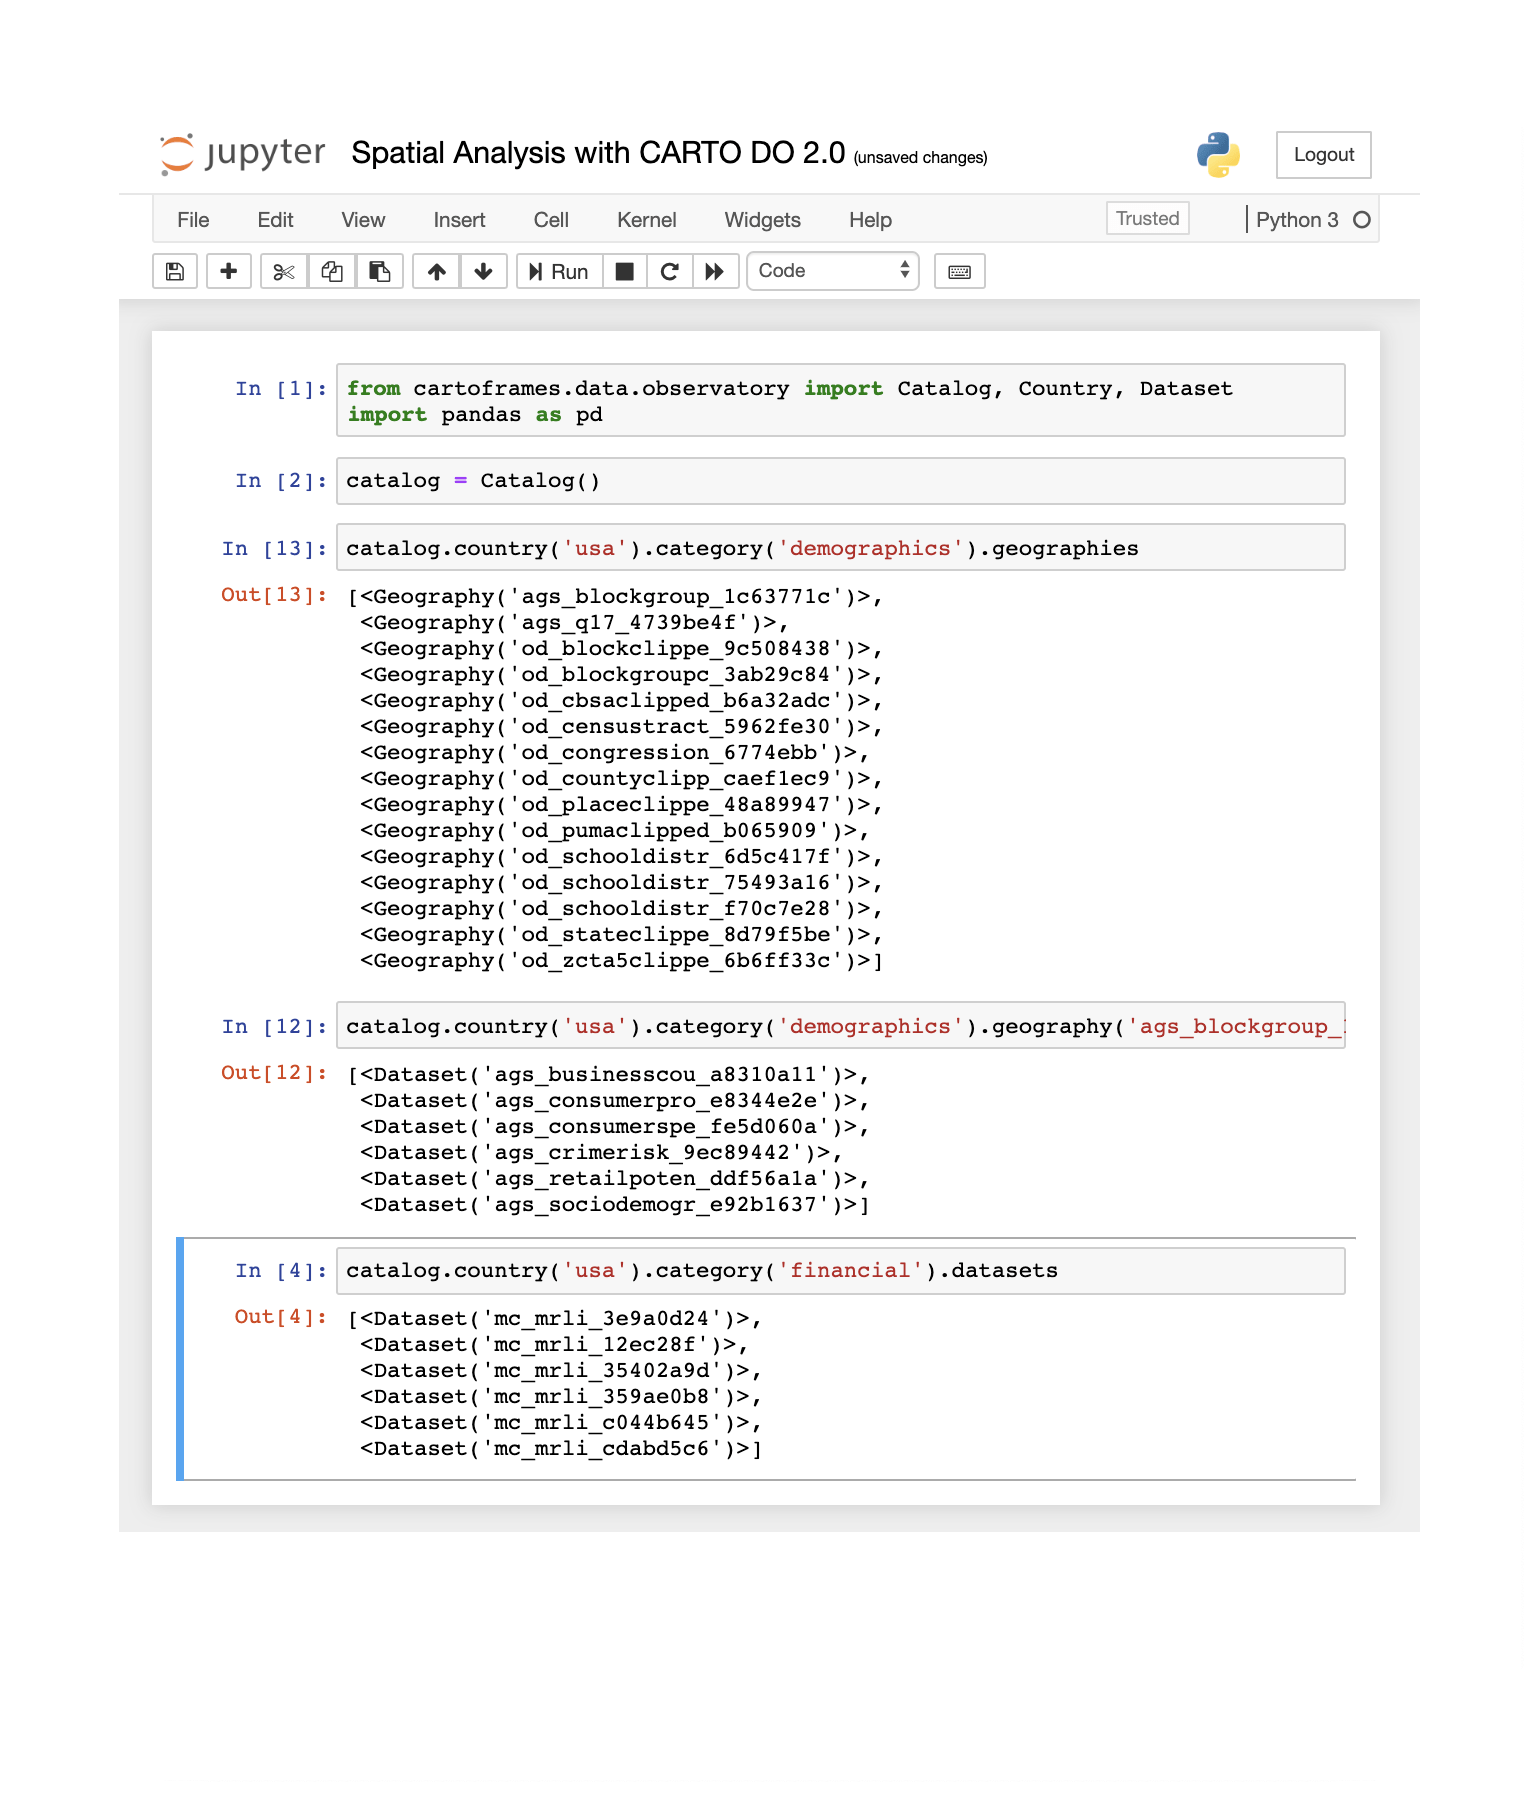
The first type of user we want to support with this new version of the Data Observatory is the Data Scientist and we all know that most of them live in Python Notebooks these days. Therefore we want to provide them with the possibility to manage data discovery purchase and access without having to leave their analysis environment. From the launch date CARTO’s Data Observatory 2.0 is fully accessible within a Jupyter Notebook or Python script so there is no need to switch platforms.
The following are the core principles that have guided us throughout the process of rebuilding the Data Observatory:
- Discover new data in context and find the datasets that are relevant to augment your own data while you do analysis in your Jupyter notebook. CARTO’s location data catalogue can be explored in its entirety using CARTOframes methods; allowing you to find what data is available per category and geography filter those data streams that apply to the geographies of your own data explore basic statistics that describe the dataset etc.
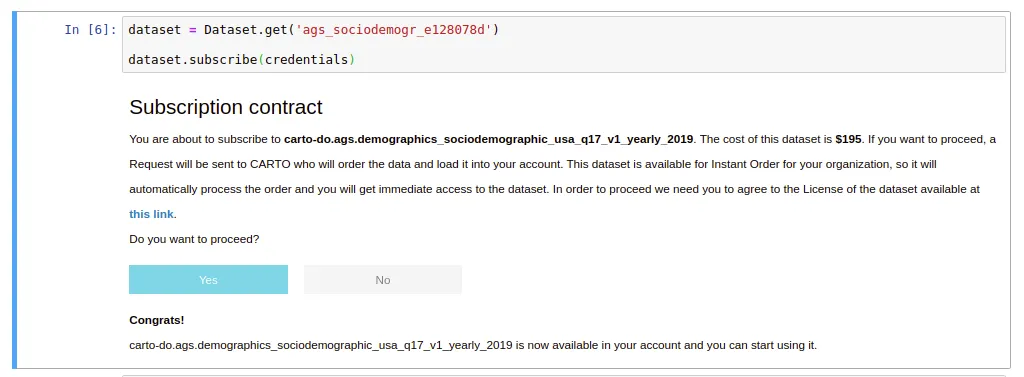
- Purchase data faster and just once with our data purchasing system in CARTOframes. Fast-track your journey towards the data you need by placing data purchasing orders to CARTO without leaving your notebook environment. We are working closely with our data partners to make sure that as many datasets as possible are available to you at the time of purchase to ensure you do not have to wait for delivery times to start working with the data. Additionally Data Observatory 2.0 provides you with methods to understand whether a specific dataset has already been licensed by your organization ensuring the same dataset does not get licensed twice and providing you with its up-to-date usage metrics.
- Speed up your data preparation process thanks to our statistical downscaling and upscaling models to disaggregate and aggregate data at different spatial resolutions into a common geographical support such as the quadkey grid.
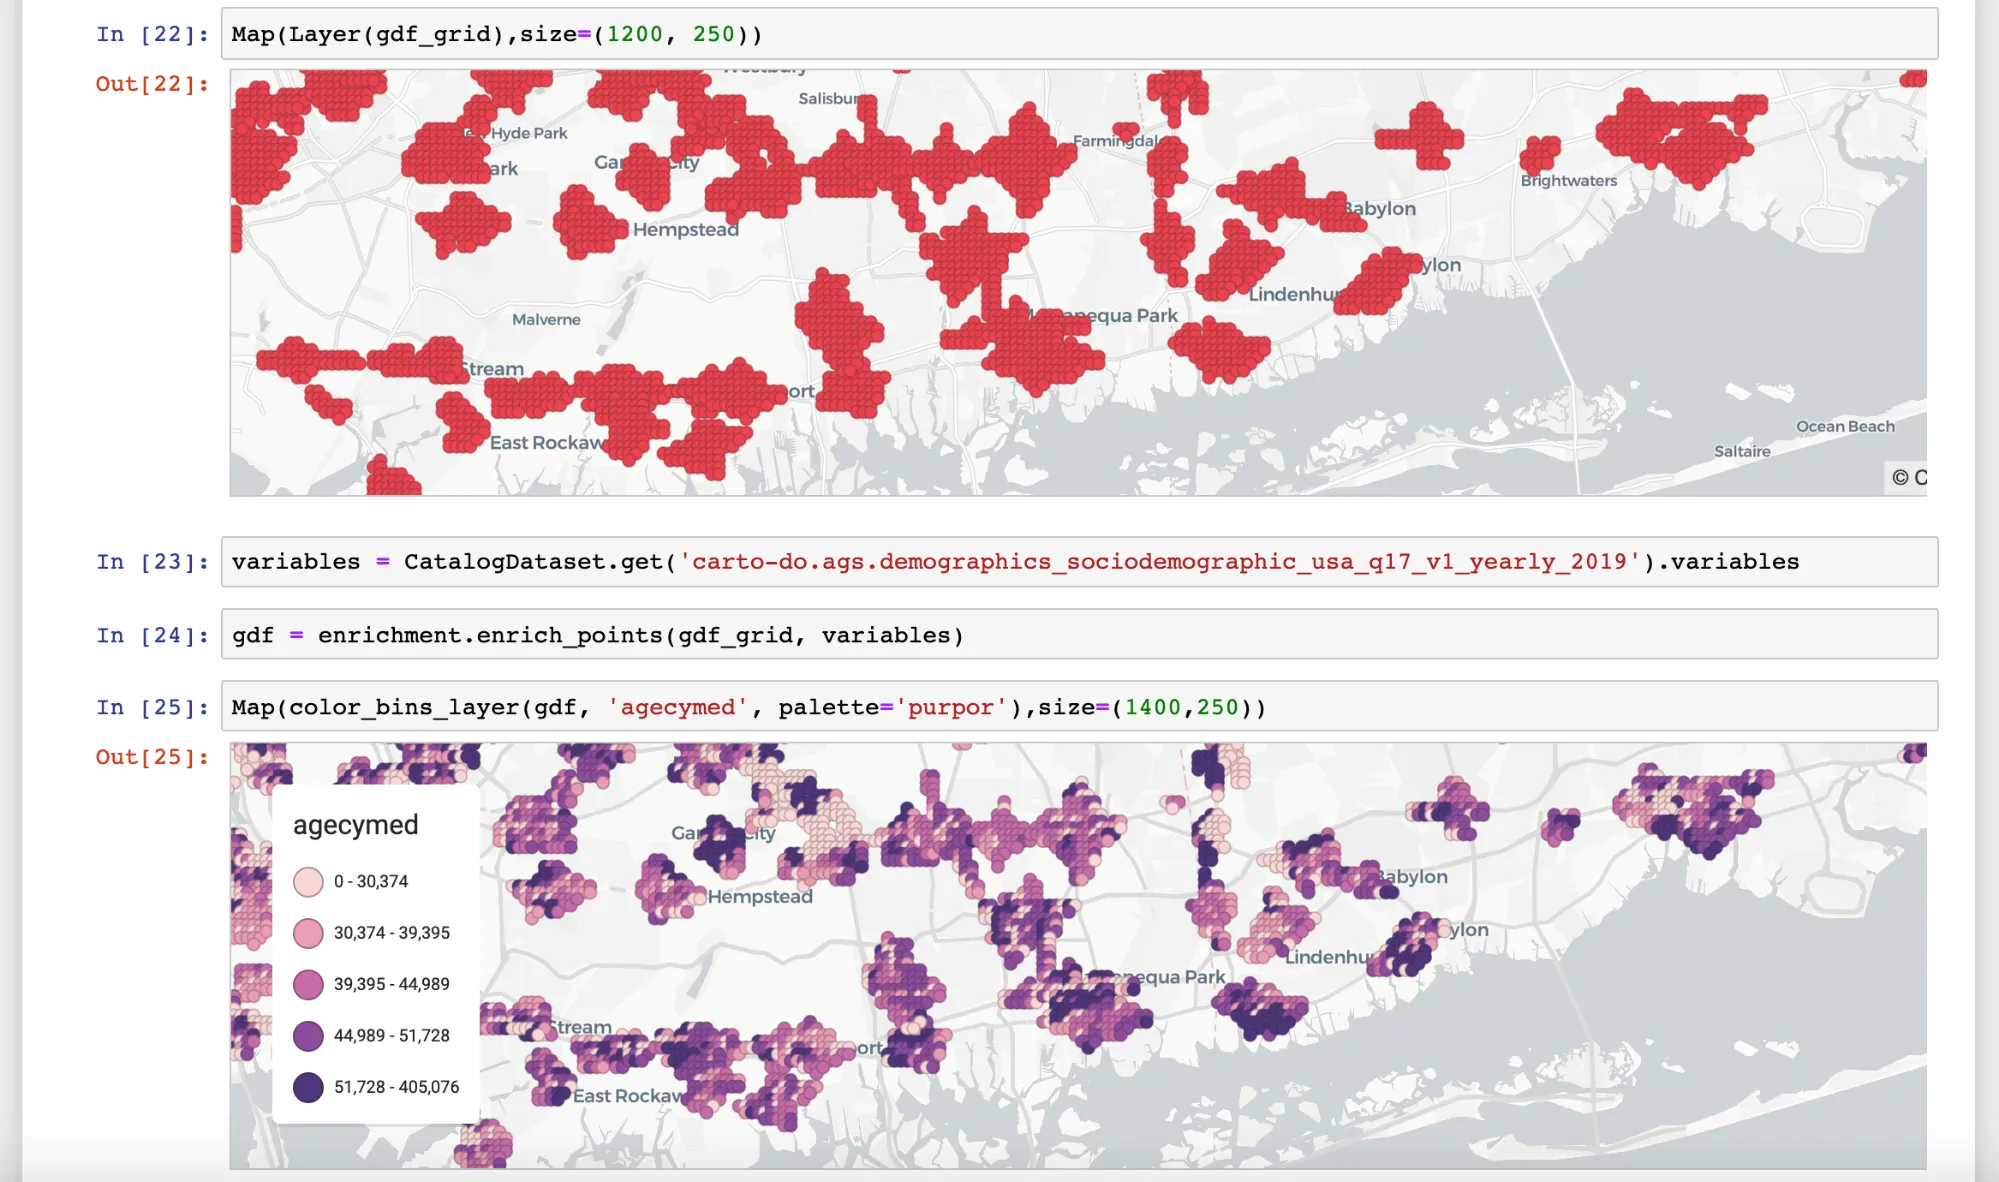
- Enrich your own dataframes with the data you have subscribed to from the Data Observatory providing you with methods for enriching both your point-based and polygon-based data.
- Receive updates and notifications at the moment there is new data available for a dataset you have a subscription to so you can re-run your spatial models and have them always updated.
How do I get started?
The new Data Observatory 2.0 is accessible via CARTOframes our Python package to selected CARTO Enterprise users in a private beta. We’re still open to more beta testers so if you’re interested please get in touch.
If you are a data provider interested in adding your datasets to Data Observatory 2.0 we’d also like to hear from you - please contact us.
Want to understand how it would work with your data? Request a demo!
 | This project has received funding from the European Union's Horizon 2020 research and innovation programme under grant agreement No 960401. |


