

Uncovering Site Selection Strategies using Point of Interest Data


In the U.S. it can cost more than $1 million to open a McDonald's Taco Bell Burger King or Wendy's restaurant. With such high levels associated with funding startup costs alongside ongoing fees for royalties advertising and other services it’s clear that ensuring the right location is paramount.
The ‘secret sauce’ of site selection in such a competitive market relies on being able to analyze the right data but with so many sources available it can be difficult to determine the relevant recipe. Alongside this is the ability to understand and interpret the site selection strategies of nearby locations in order to pre-empt their expansion plans and gain a competitive advantage. Data that can be leveraged in such analysis includes financial human mobility behavioral demographic and the widely used Points Of Interest (POI).
Does proximity to other POIs influence where a new store is located? To answer this question in this blogpost we use the locations of the largest restaurant and eating places brands in the U.S. to understand their underlying spatial planning strategy: if their locations are not random what are the main factors influencing their distribution and do they include the proximity to other POIs?

Expanding your brick & mortar network?
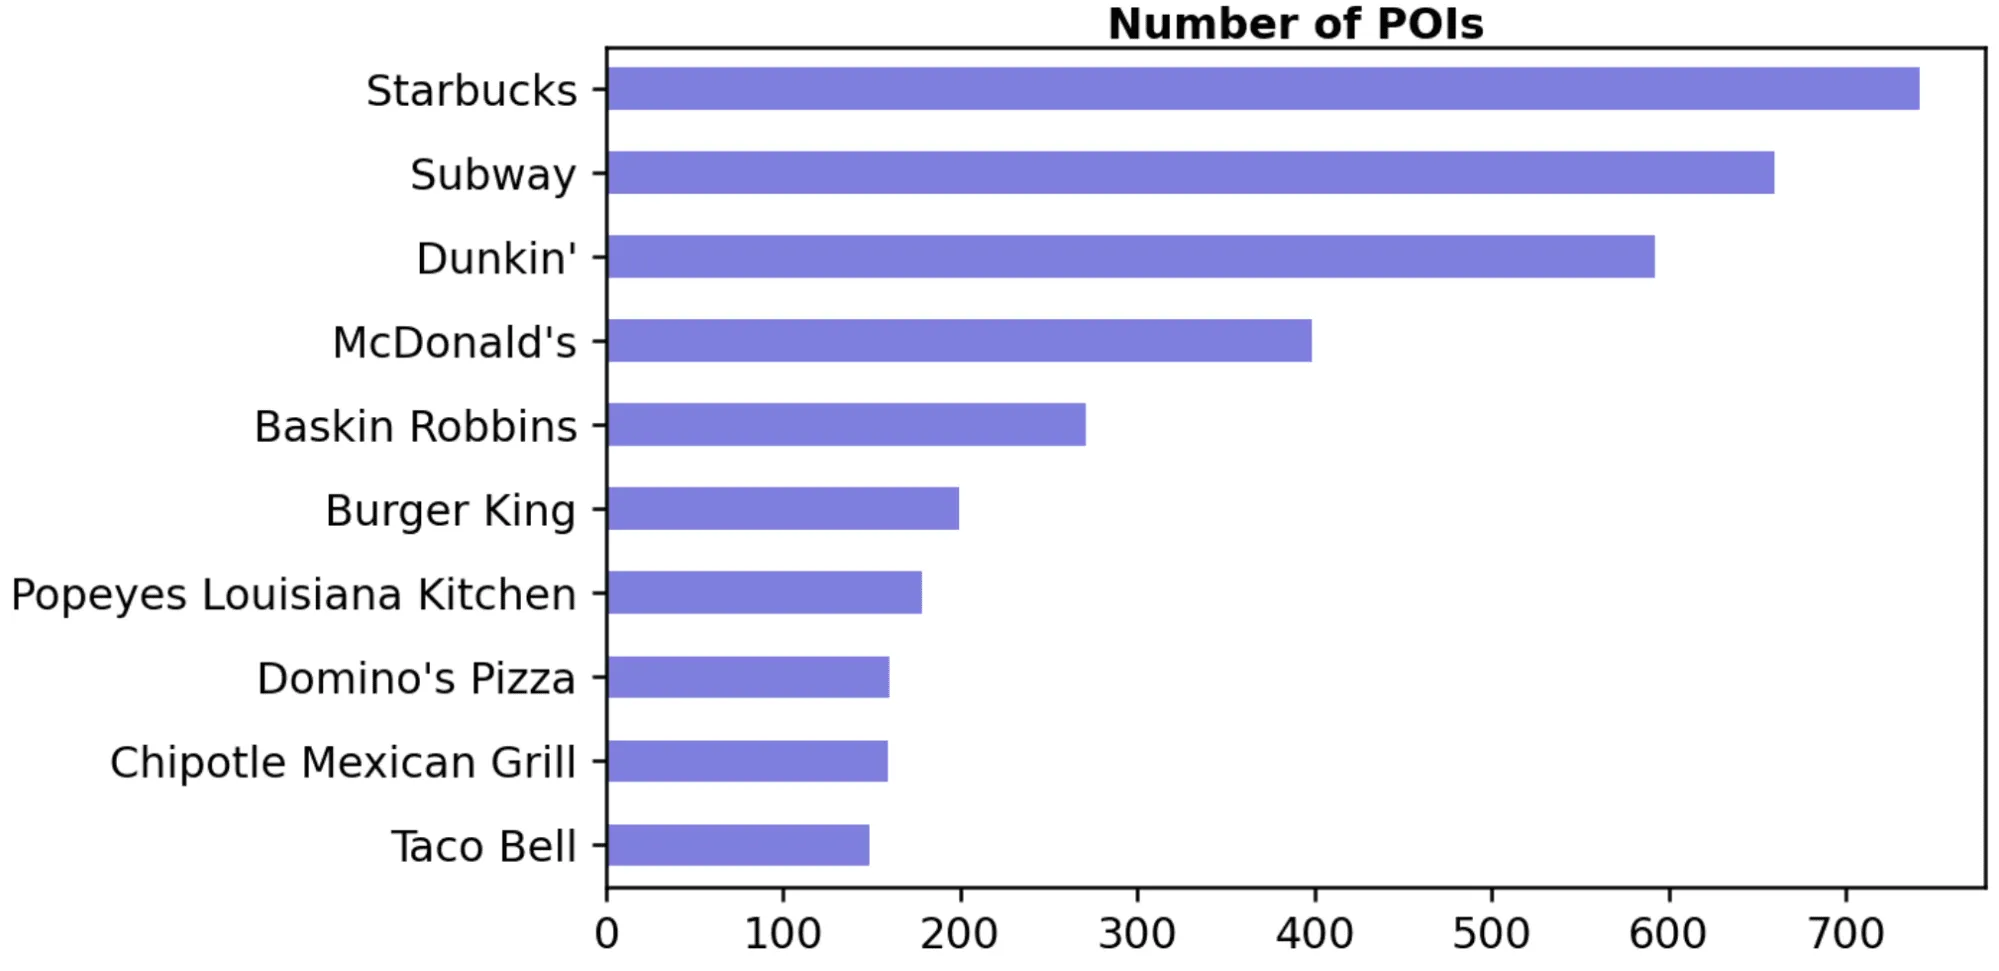
See how CARTO can helpIn this case study we will use Safegraph’s Core Places data which is available from CARTO’s Data Observatory and provides complete business listings information for nearly 10 million POIs in the U.S. For this analysis we will consider the locations of the main restaurant and eating places brands in the urban areas of New York Los Angeles Chicago and Houston. The main brands were identified as those with the largest number of POIs in all of the selected urban areas:
Analysis of the proximity network
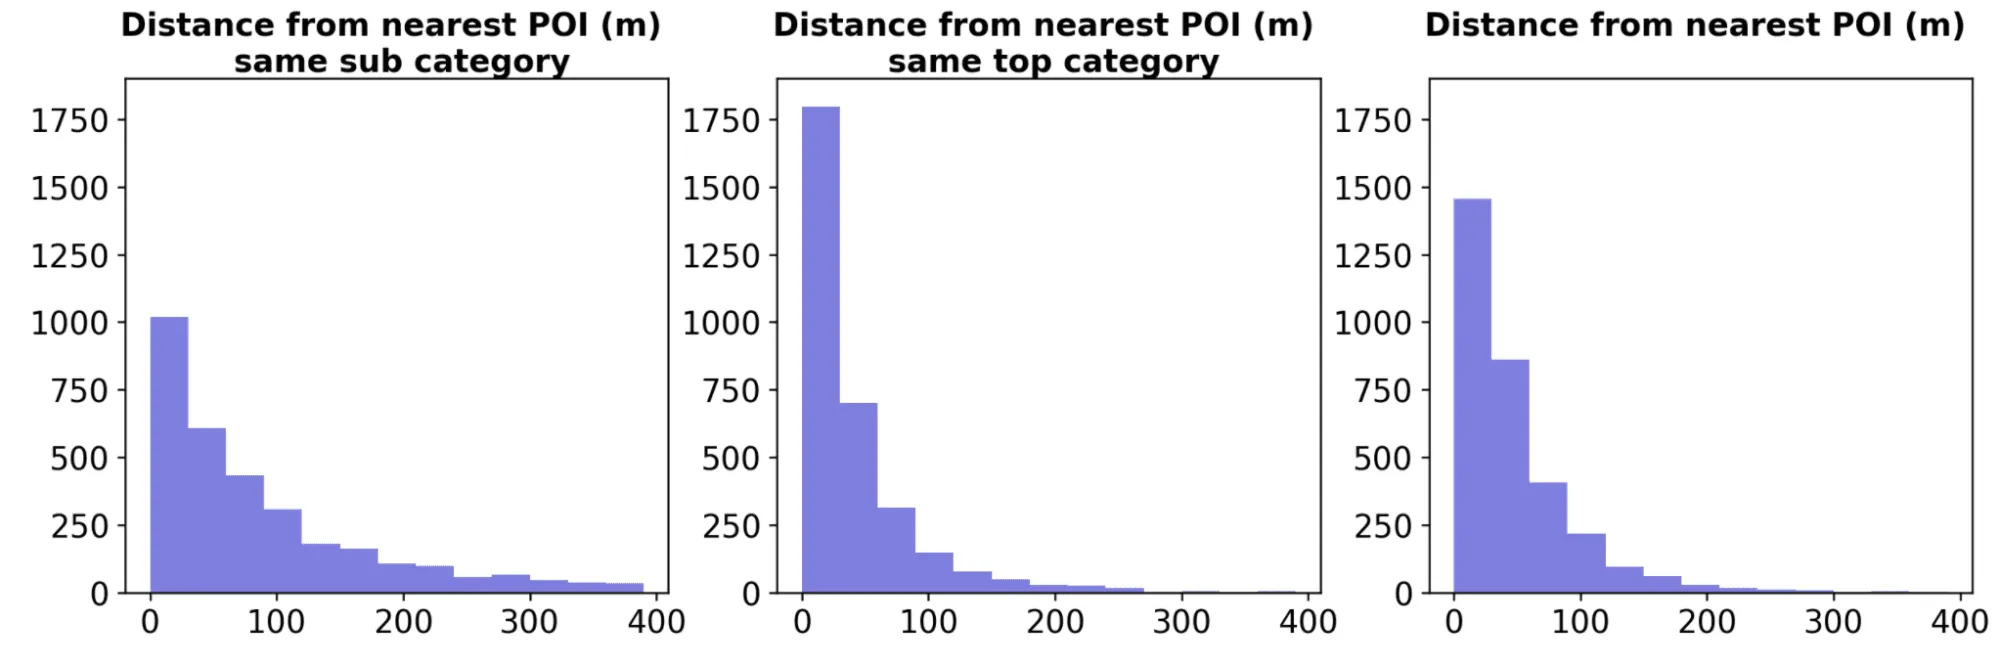
To test whether the pattern of the locations of the selected POIs is determined by the proximity to other POIs we start by constructing and analyzing the networks connecting each POI from the largest restaurant brands to its nearest 10 POIs. The first network is constructed deriving the nearest neighbors from POIs of the same sub-category (i.e. Full-Service Restaurants Limited-Service Restaurants Snack and Nonalcoholic Beverage Bars Cafeterias Grill Buffets and Buffets). Similarly the second network is obtained from the 10 nearest neighbors of the same top-category (i.e. Restaurants and Other Eating Places) and finally the third network considers the neighbors from any POI category (e.g. Clothing Stores Grocery Stores etc.).
The histograms below show the frequency of the first-neighbor distances derived from each of the three networks. As expected the distribution has heavier right tails for the distance from the nearest POI of the same sub-category: although the majority of similar POIs fall within 100m there is also some repulsion between POIs of the same sub-category compared to POIs of the same top-category or of other categories.
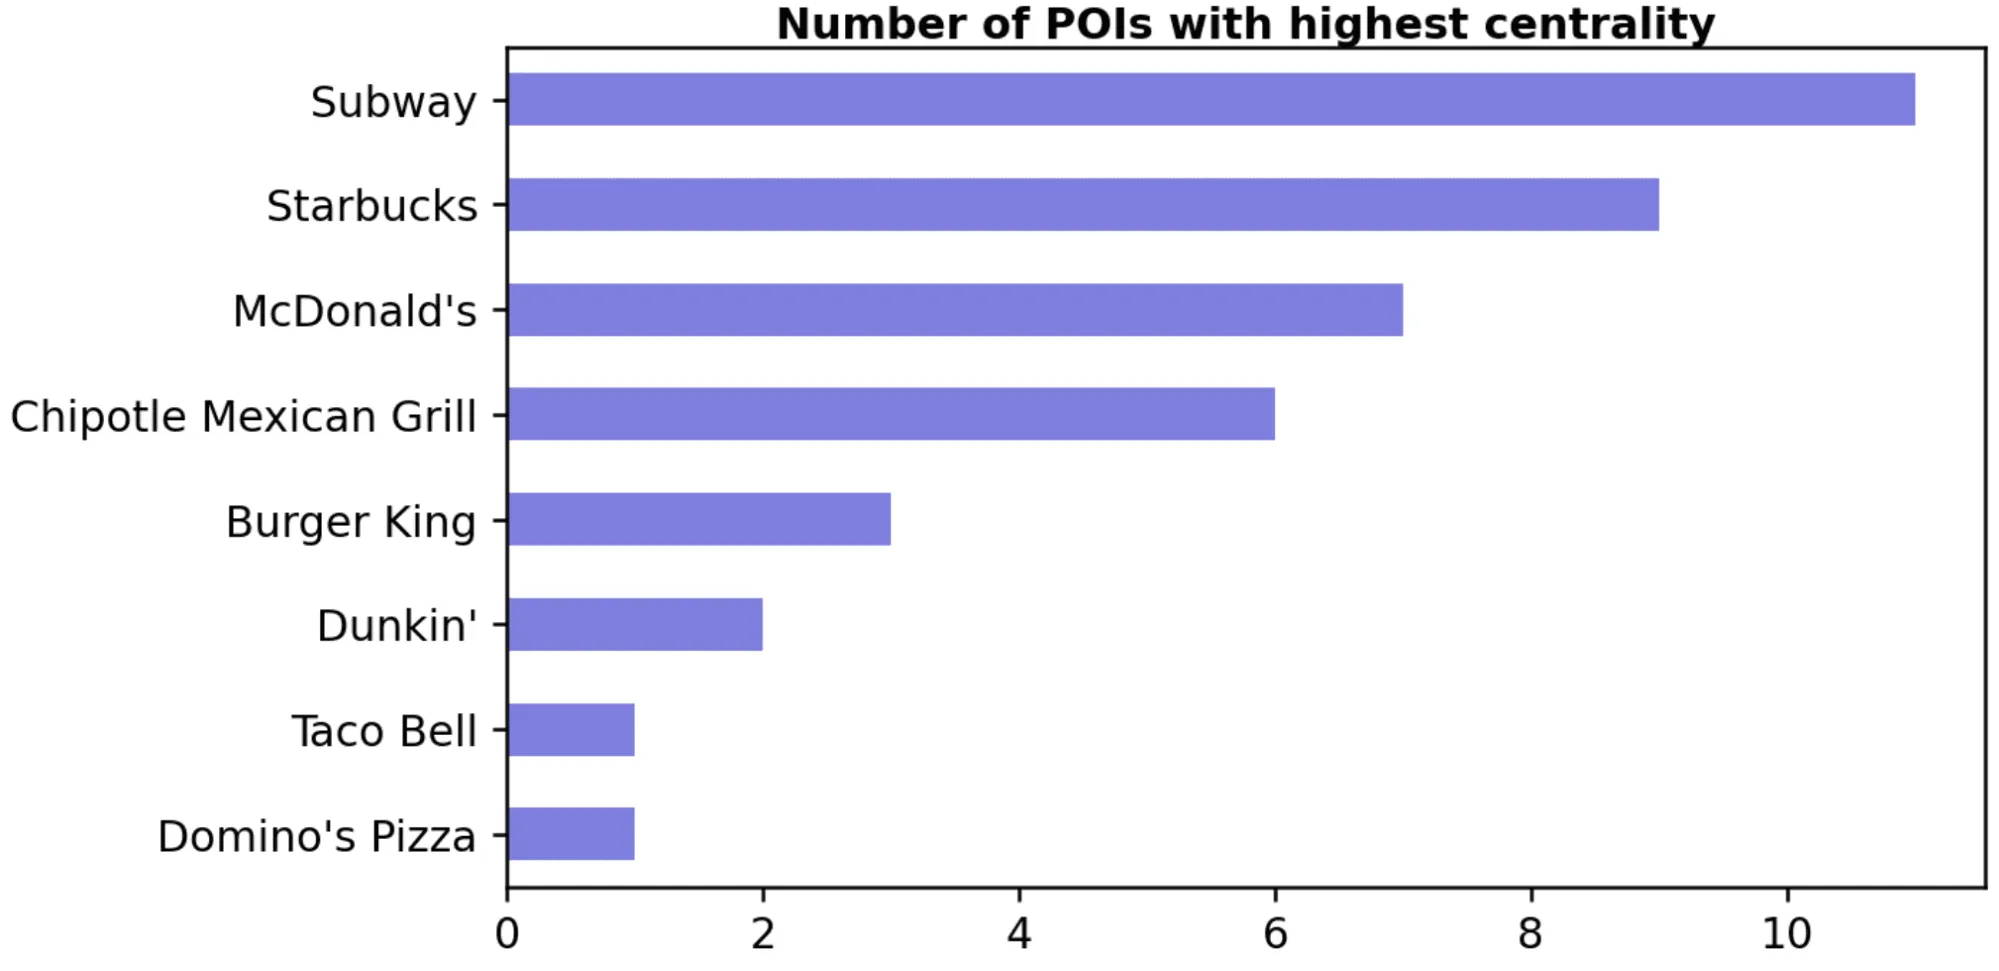
We can also plot the network and compute the centrality of each node as shown in the map below for the network constructed from the nearest neighbors of the same sub-category.
The centrality of each node was computed as the normalized closeness centrality: nodes with higher centrality have the shortest distances to all other nodes in the network. From this map we can derive the POIs with the 10 highest centrality scores in each city: over all urban areas Subway fast foods are more connected to the 10 nearest restaurants of the same type (i.e. their sub-category is “Limited-Service Restaurants”) compared to Dominos’ Pizza whose restaurants are typically located in areas that are less crowded (in terms of similar POIs). All these insights start to provide clues on the different site selection strategies of the selected brands in relation to locating their restaurants in areas with high density of other similar places.
For the same network graph we can also look at the inter-category network using a chord plot. These plots show the flow (represented by the arcs) between the nodes with each node represented by a fragment on the outer rim of the circular layout. The size of the arc is proportional to the importance of the flow i.e. to the number of connections. This plot shows the connections when we only consider nodes represented by POIs of the selected restaurant brands:
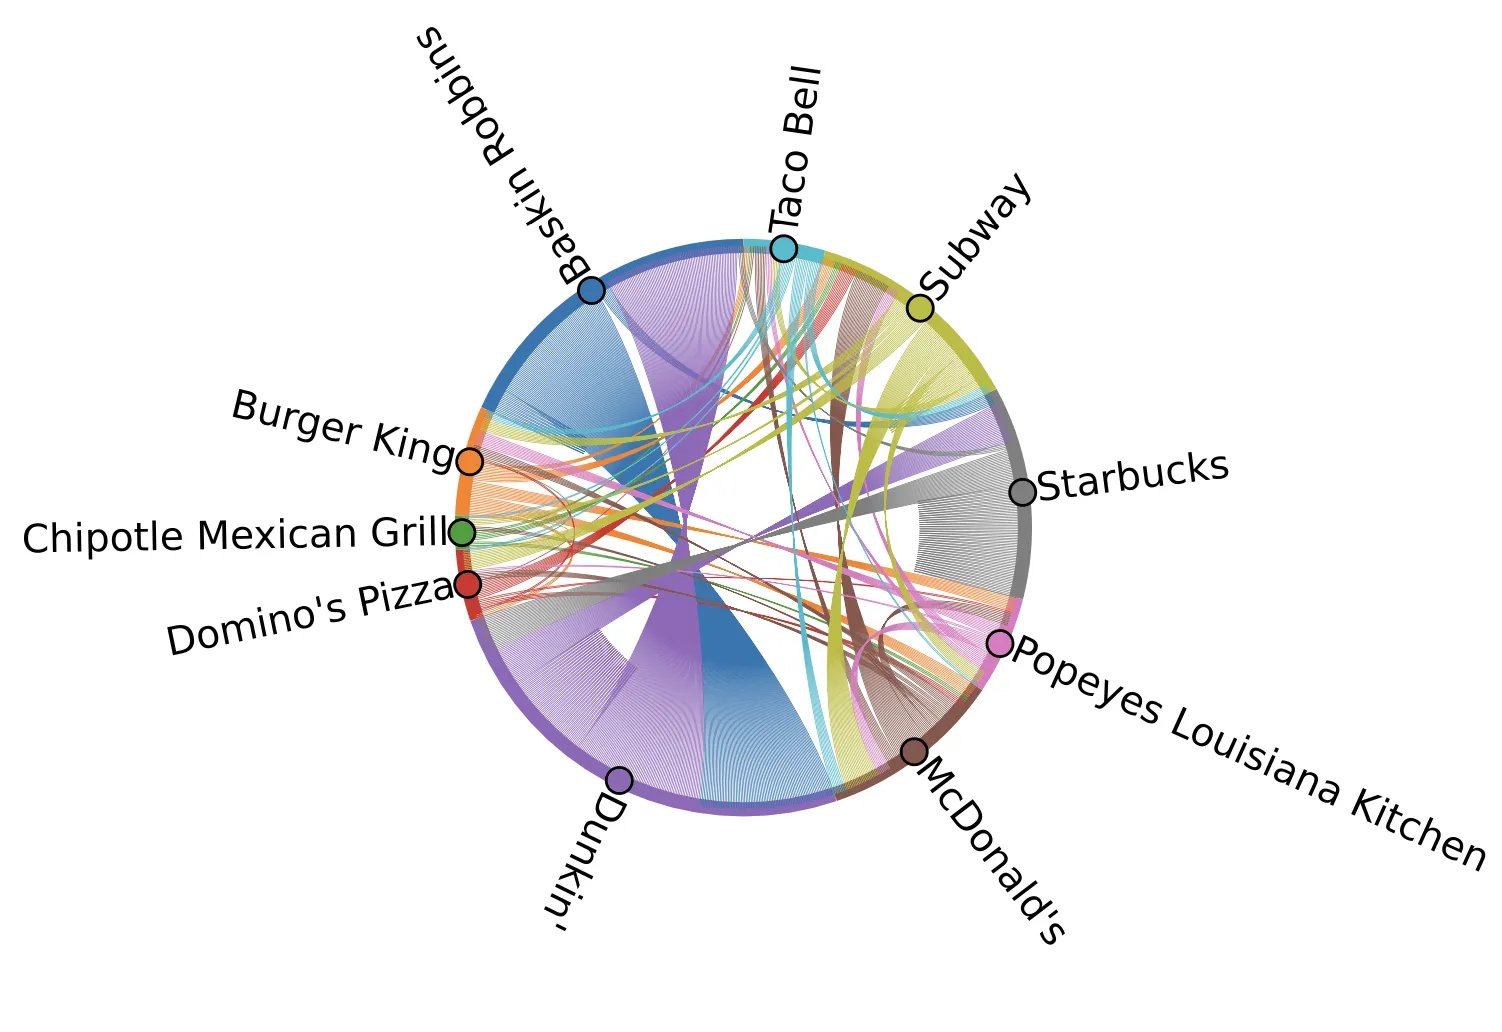
When only the largest brands are considered Dunkin’ and Baskin Robbins stores are generally linked together with a Dunkin’ store being almost always the first-order neighbor of a Baskin Robbins store while Starbucks stores are often the first-order neighbors of themselves.
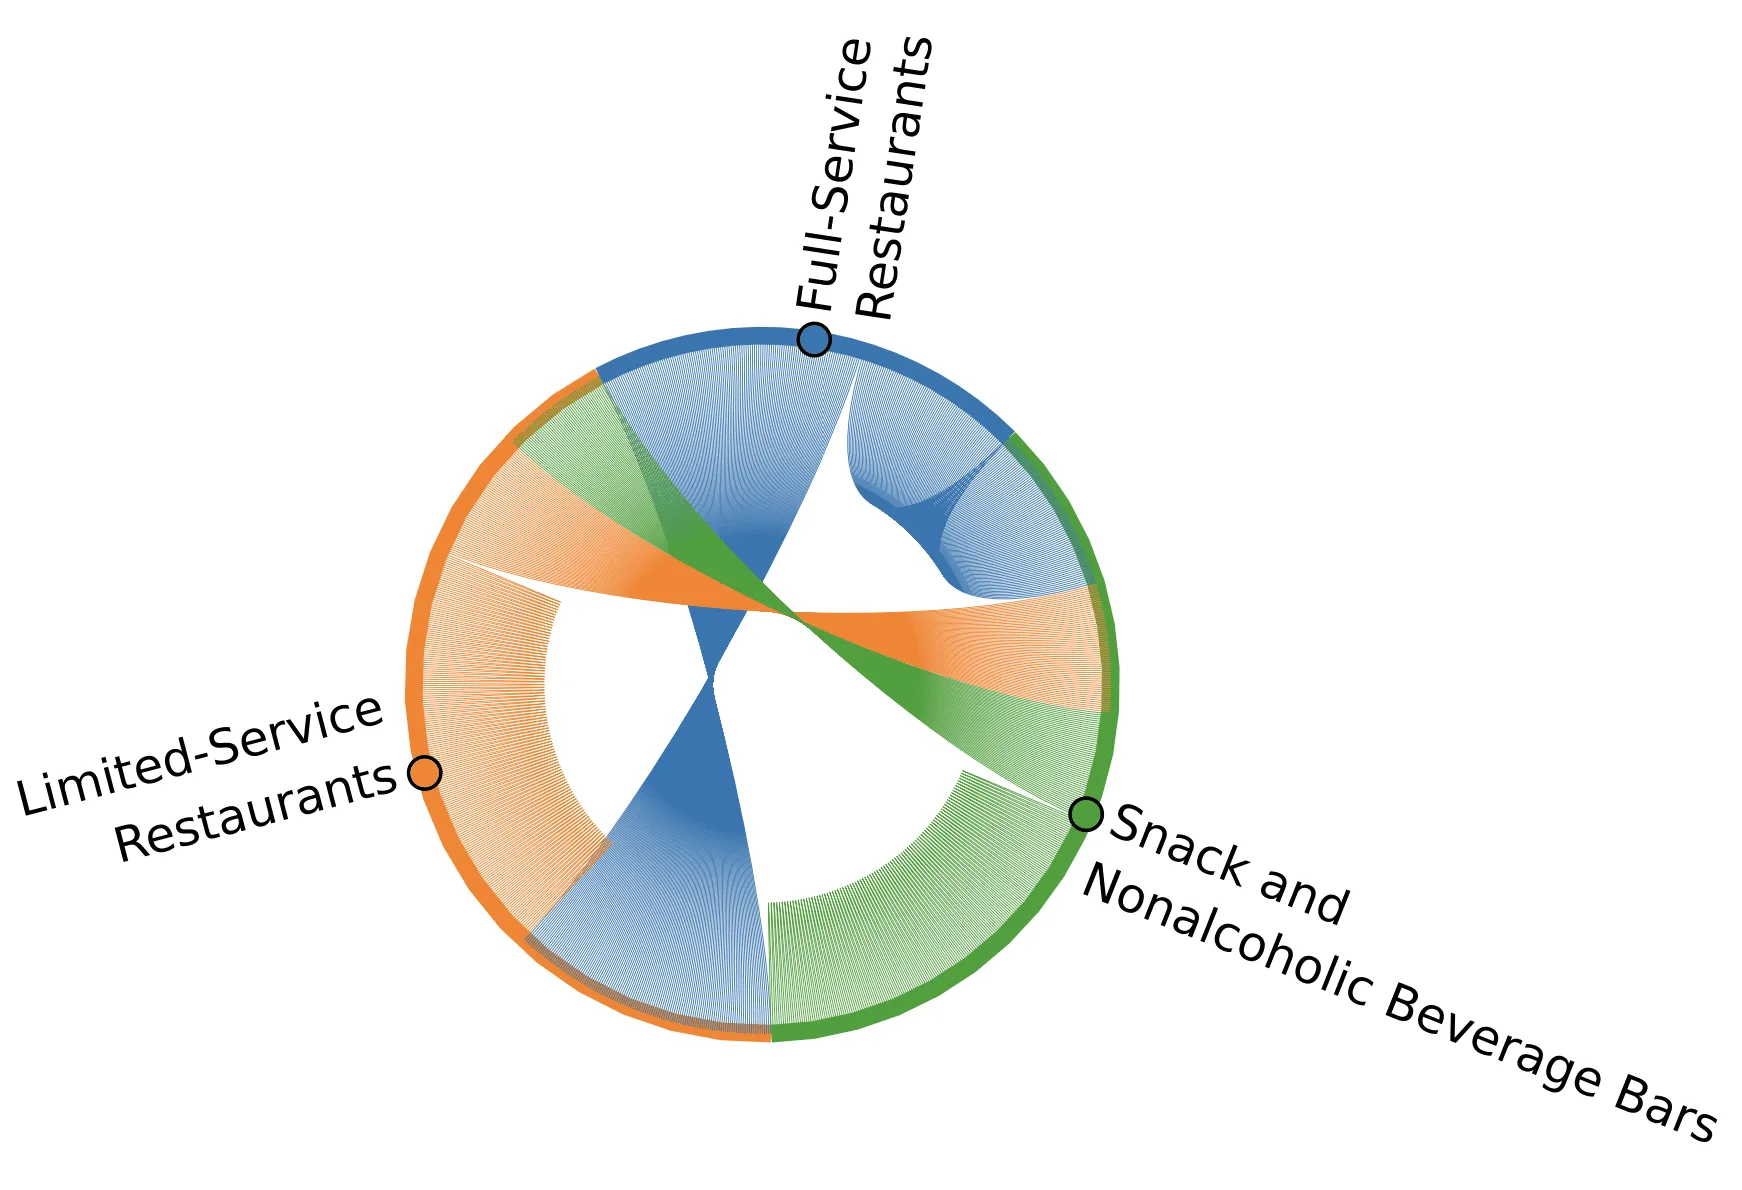
Similarly when considering the graph for the first-order distances of the selected POIs from POIs of the same top-category we can see that in the majority of the cases Limited-Service Restaurants and Snack and Nonalcoholic Beverage Bars have as first neighbors another Limited-Service Restaurant and another Snack and Nonalcoholic Beverage Bar respectively.
Finally we can also look at the intra-categories links as shown in these plots for Starbucks stores.
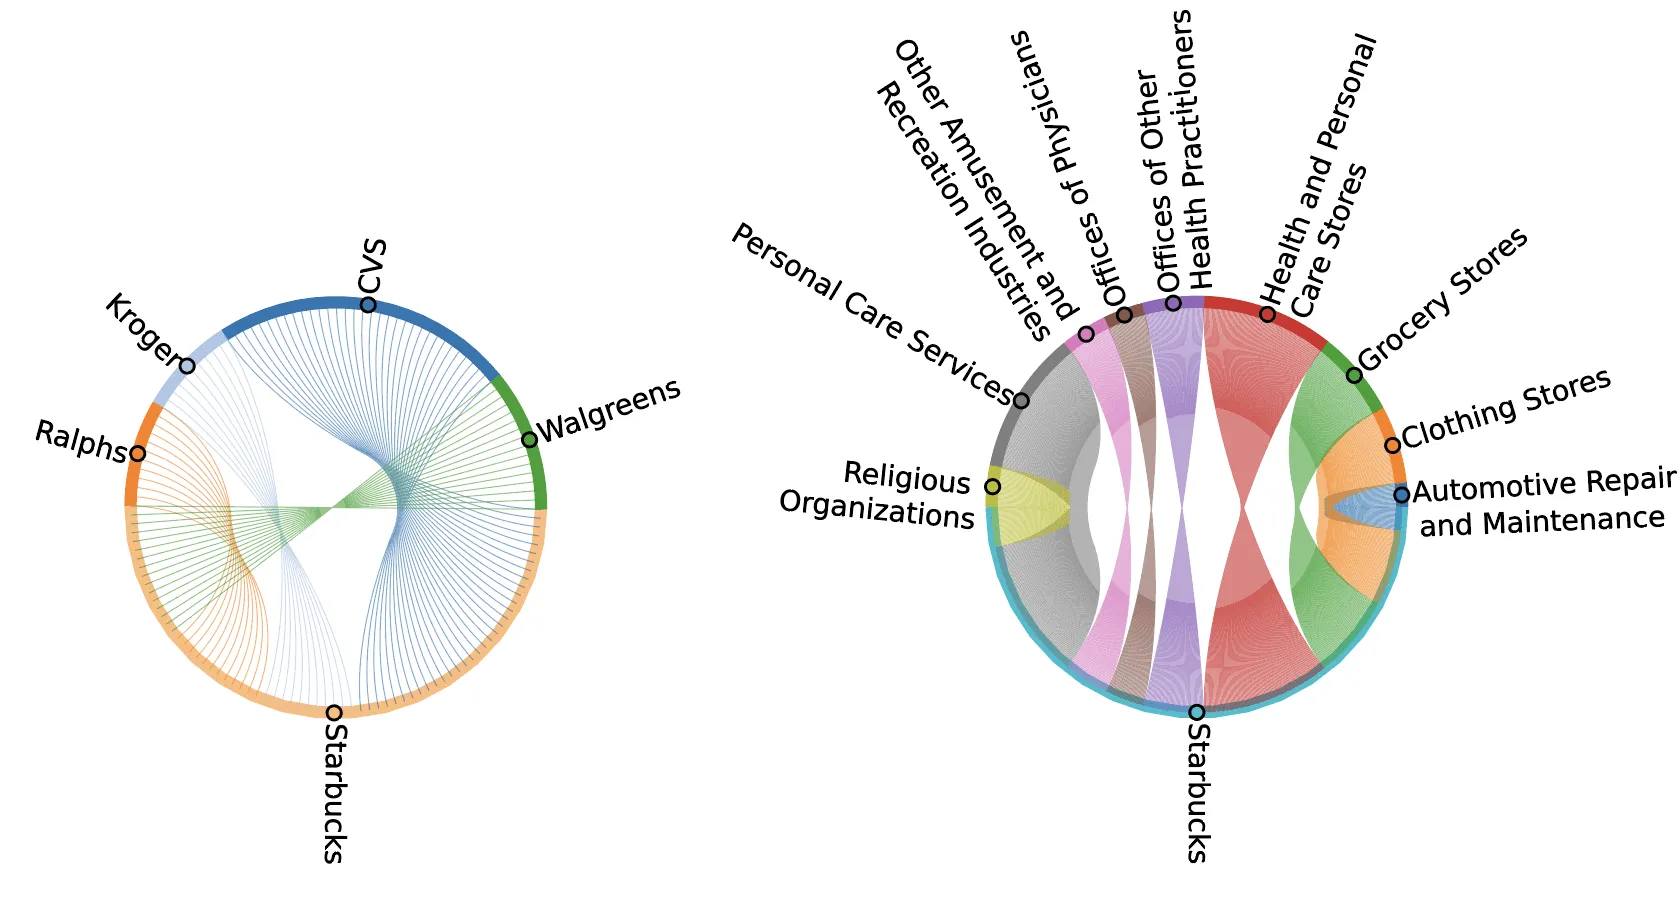
The first plot shows the links between the Starbucks stores in the selected urban areas and the nearest stores of known brands of other top-categories with the largest number of links. We can see how Starbucks cafeterias are connected mainly to personal care stores and services (CVs Walgreens) and grocery stores (Ralphs Kroger) as also suggested by the second plot which shows the connections by top-category.
Distance-based modelling of the density of POI locations
While the preliminary analysis based on the nearest neighbor graphs has shown the importance of proximity effects on the pattern of the POI locations it does not allow any comparison of these effects with other attributes that might also influence such pattern.
Specifically we are interested in testing the size of the effect of the first-order distances (derived in the previous section) on the pattern of the selected POIs and compare it to the size of the effect related to other relevant attributes such as the density of businesses in the areas (restaurants clothing stores other amusement and recreation industries etc). Here the density for each business category was computed using CARTO’s Spatial Extension for BigQuery as the number of POIs of that category in each quadkey grid at zoom 15 (ca. 1 km) as shown in the map below.
The pattern of POI locations can be modelled assuming that the set of locations is generated by some random process and is known as a spatial point pattern. The hypothesis that we want to test here is that the pattern of the locations of the largest U.S. restaurant brands is not random and is instead based on an underlying latent field which describes the dependence on the proximity to other POIs as well as their density and the level of urbanity.
To test the contribution of the distance-based covariates to the intensity (i.e. the density)

of the selected POIs we can test two different models. The baseline model is a log-Gaussian Cox process where the linear predictor only includes as covariates the level of urbanity (

) of the quadkey cell associated with each location of the selected restaurant brands and the density of relevant businesses (

) namely: the density of restaurants and other eating places the density of clothing stores and the density of other amusement and recreation industries:
The level of urbanity is available in CARTO’s Spatial Features dataset and is modelled as an

random effect.
The extended model also includes the distance-based covariates (

) namely: the distance from the nearest POI of the same sub-category of the same top-category and the nearest POI from all categories.
where

is a smooth function modelled as a Random Walk model of order 1 that accounts for non-linear dependencies and

are zero mean Gaussian distributed variables.
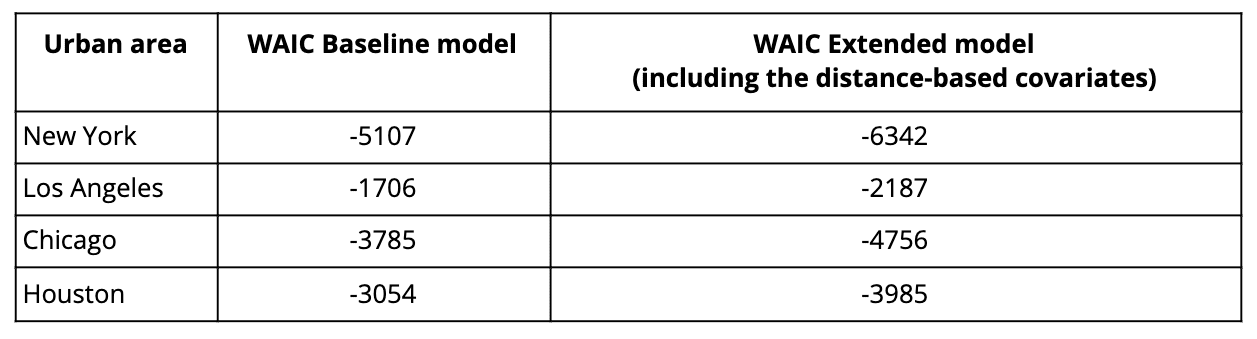
By comparing the Watanabe-Akaike Information Criterion (WAIC) which represents the fully Bayesian approach for estimating the out-of-sample expectation we can conclude that the second model which also includes the distance-based covariates has a better predictive accuracy for all the urban areas tested in this study as shown in this table (lower values indicate better accuracy).
We also plot the random effects of each covariate starting with the smooth functions for the distance-based covariates as shown for the New York urban area:
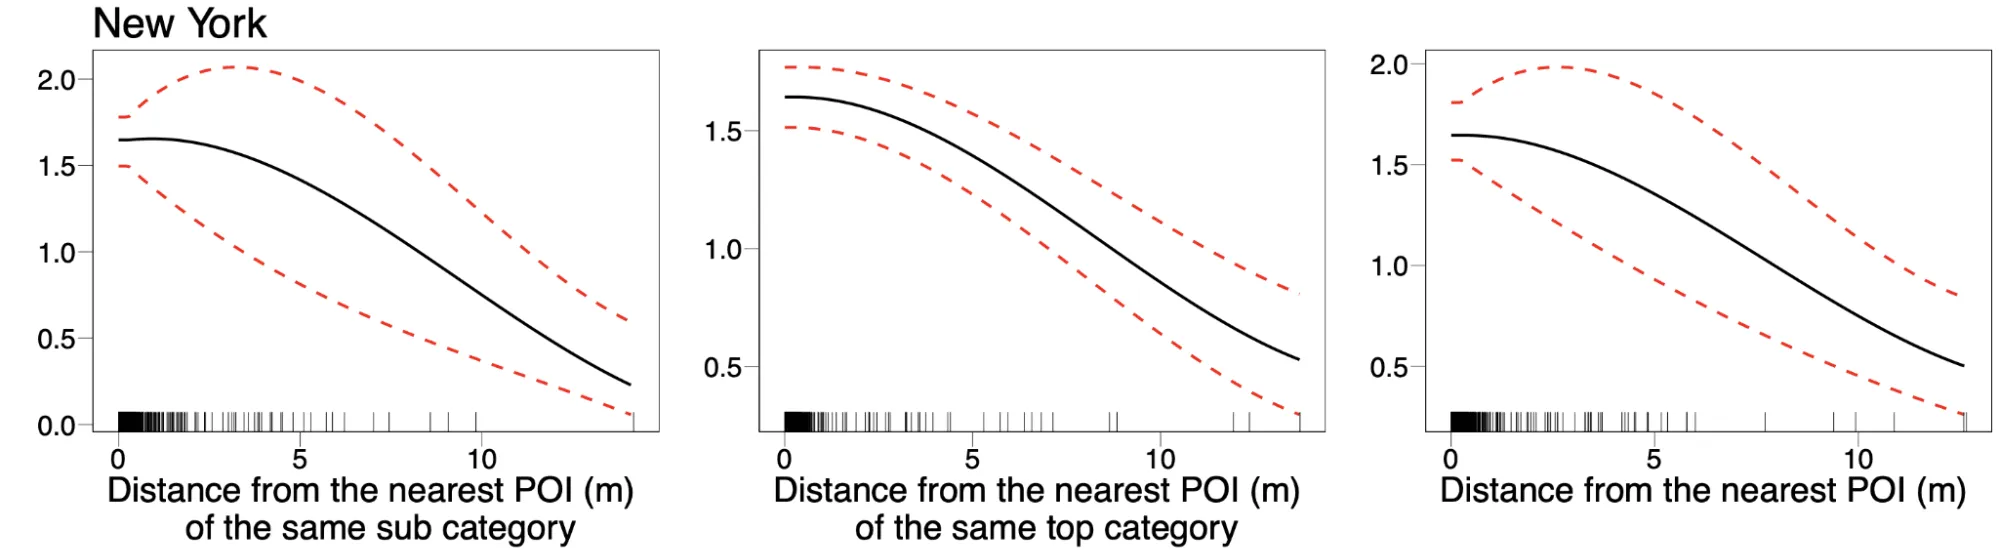
In this plot (and similar results are obtained for the other urban areas) we can see that overall the density of the selected POIs decreases with the distance from the nearest POI of the different categories although with some differences. For example the density of locations decreases less rapidly with the distance from the nearest POI of the same category.
Finally we can also plot both the random effects for the urbanity-related covariates and the fixed effects of the density-based covariates as shown in these plots for the New York urban area.
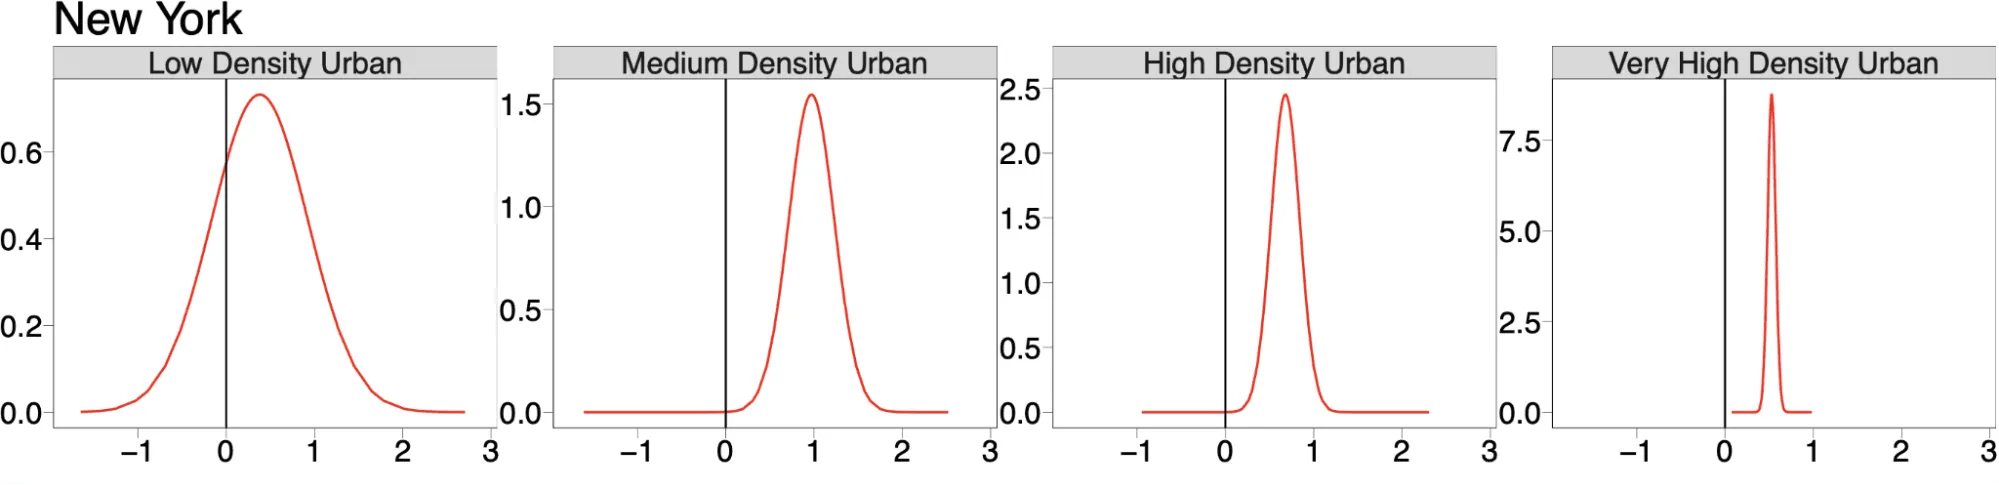
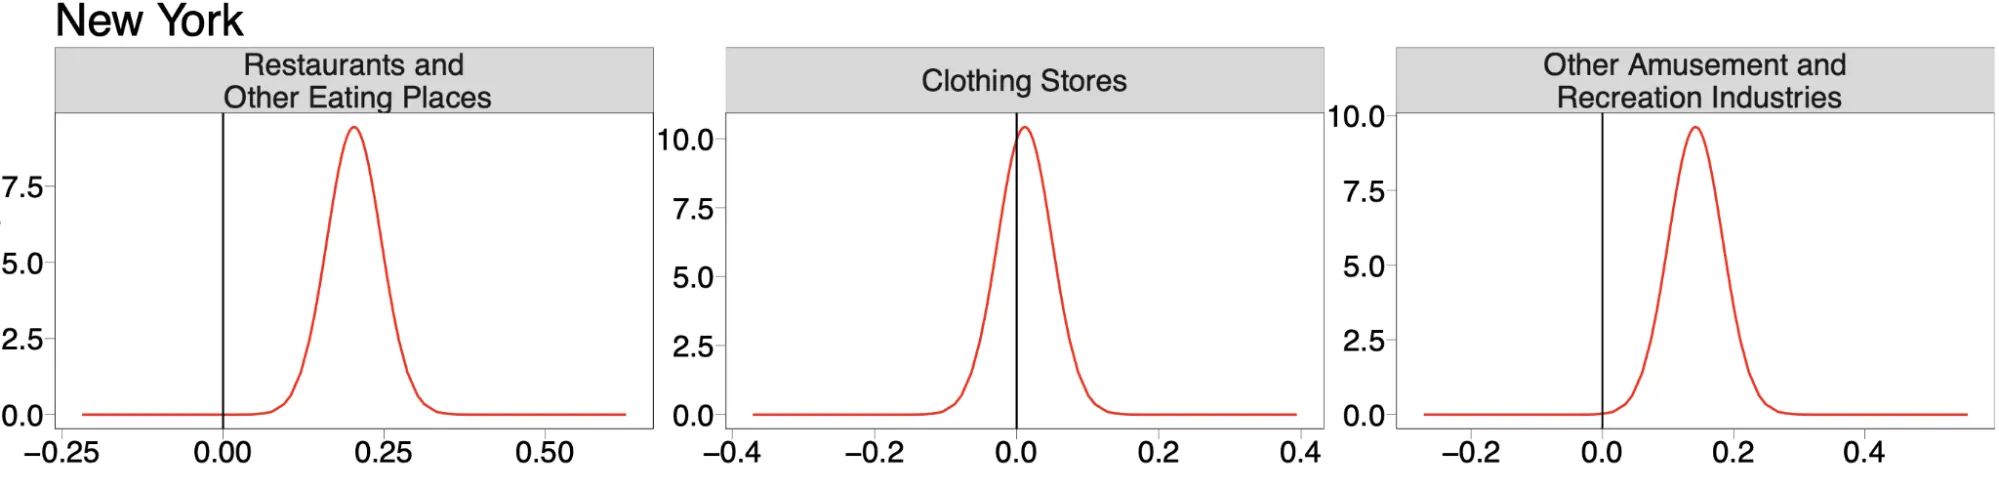
These plots suggest that the density of the largest restaurant brands also depends on the level of urbanity with larger densities associated with medium and high density urban areas as well as to areas where there is a larger density of other restaurants and other amusement-related POIs.
Conclusions
In this blog post we analyzed the pattern of the locations of the largest U.S. restaurant brands and found that similar and/or competitor brands “attract” each other. First we found that the first-order neighbor is often from the same sub-category (e.g. the nearest business to a fast food restaurant is almost always another fast food restaurant). Secondly when modeling the density of the selected POIs we showed how the nearest neighbor distance-based attributes significantly improves the model's predictive accuracy compared to a model only including the level of urbanity and the density of other relevant businesses. Moreover the density of the selected POIs is found to decrease with the distance to the closest POI of the same sub- and top-category (as well as overall with the distance from the closest POI).
This analysis was facilitated by the comprehensive data offer of CARTO’s Data Observatory which includes not only third-party and public data but also CARTO’s Spatial Features offering a set of spatial features in standardized formats with global coverage. Fast and scalable analytics was made possible thanks to CARTO’s Spatial Extension which provides a suite of cloud-native geospatial functions and procedures on top of the modern cloud data warehouses including BigQuery and Snowflake.
Learn more about CARTO’s location data streams today to discover thousands of public & premium datasets to enrich your data and how to perform scalable spatial analysis on data hosted on Google BigQuery using CARTO’s Spatial Extension.
Technical note: modelling spatial point patterns
Given the intensity or density surface
over a study region

and a point pattern

the likelihood of an inhomogeneous Poisson process is
Treating the intensity surface as a realisation of a Gaussian random field
yields a particularly flexible class of point processes known as log-Gaussian Cox processes. These processes are typically used to model aggregation in point patterns resulting from observed or unobserved spatial variation. A common method for performing inference with log-Gaussian Cox processes is to take the observation window construct a fine regular grid over it and then consider the number of points observed in each cell of the lattice. These are independent Poisson random variables and can be modelled with a generalized linear model framework. However this approximation is wasteful (the covariance matrix is dense) and cannot be applied when gridding of the model covariates is not an option as for example in this case where we are interested in the effect of the first-order distances for each POI.
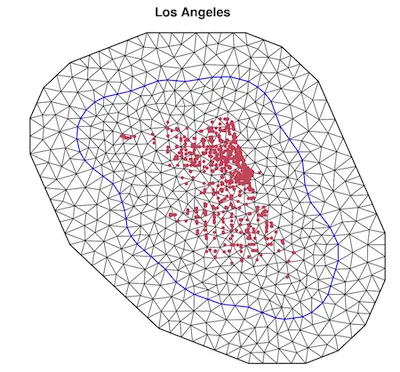
Rather than defining a Gaussian random field over a fine lattice an alternative method consists in approximating the random field as
where

is a multivariate Gaussian random vector and

following the Stochastic Partial Differential Equation (SPDE) approach for Matérn random fields and implemented within a Bayesian framework in the inlabru R package is a set of piecewise linear functions defined on a triangular mesh. We can construct a mesh for each urban area as shown in this plot for the Los Angeles area where the locations of the largest restaurant brands (red dots) are overlaid on the mesh.
Want to get started?%3C%2Fp%3E%0A%20%20%20%20%20%20%3Ca%20href%3D"https://app.carto.com/signup" class="button is-cartoRed button--arrow" target="_blank" rel="noopener noreferrer"> Sign up for a free account
 | This project has received funding from the European Union's Horizon 2020 research and innovation programme under grant agreement No 960401. |


