

US Social Determinants of Health Atlas - Map of the Month


Seeking an understanding of resident health based on the social factors within a neighborhood is not a new concept. But efforts to do so have long been overly simplistic with analysis that largely explores only common factors such as poverty education and minority status.
In a recent study "Quantification of Neighborhood-Level Social Determinants of Health in the Continental United States " Marynia Kolak from the Center for Spatial Data Science at the University of Chicago and colleagues from the Center for Health Innovation at the American Hospital Association sought out a deeper understanding of the social factors that determine health outcomes in the US.
Deriving Social Determinants from the Data
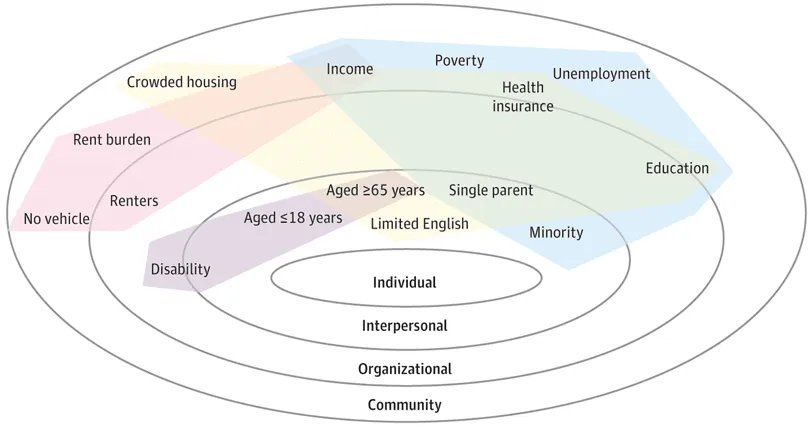
In their study the team used 15 social factors to build 4 distinct indexes allowing for a more comprehensive view of social determinants and simpler classification of neighborhoods when examining these factors against health outcomes. Data on these 15 variables was derived from the 2014 American Community Survey 5-year mean and they limited their variable selection to factors with data available for census tracts all across the country.
Social Factors:
- Ethnic/racial minority population (Defined as persons of all racial/ethnic ancestries with the exception of white non-Hispanic ancestry.)
- Population aged ≥65
- Population aged ≤18
- Population with a disability
- Population with no high school diploma
- Population with limited english proficiency
- Population of single parent
- Population living in poverty
- Per capita income
- Unemployed population
- Uninsured population
- Number of renters
- Rent burdened population (Renters paying more than 30% of their household income for rent.)
- Population in crowded housing (Defined as occupied housing units consisting of more people than rooms.)
- Population with no vehicle.
These factors was then grouped to form four indexes:
- Socioeconomic Advantage Index
- Limited Mobility Index
- Urban Core Opportunity Index
- Mixed immigrant cohesion and accessibility index
The factors broken out into these indexes are visualized below:
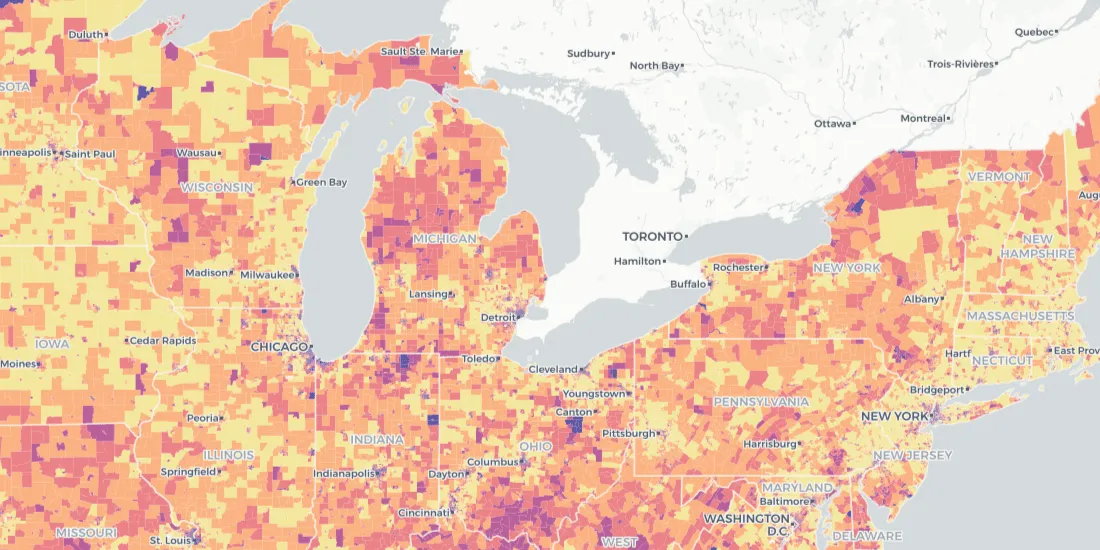
In order to quantify these factors into their respective indexes the team performed an Exploratory Factor Analysis. They then used CARTO to visualize these indexes making the data interactive and filterable:
Regionalization Analysis to Create Typologies
In addition to creating the visualized index the team also performed a regionalization analysis to create 7 distinct neighborhood typologies that appear across the country. Looking at these distinct typologies against health incomes would provide further insight into which factors impact distinct community types. Those 7 neighborhood typologies are also visualized as a layer on the above map and include:
- Rural Affordable
- Suburban Affordable
- Suburban Affluent
- Vibrant Urban Core
- Extreme Poverty
- Multilingual Working
- Sparse Areas
Understanding the Impact of Social Factors on Health
In order to quantify the impacts of these social determinants the team then performed a regression analysis to estimate the association between these indices and premature mortality rates in Chicago while controlling for violent crime. Based on this analysis they determined that "60% of the variation in premature mortality at the neighborhood level was associated with Social Determinants of Health dimensions alone even after accounting for violent crime and underlying spatial structures."
This direct relationship between mortality rates and these social determinants is eye opening showing how neglecting to address social inequity can have dire consequences. It is the hope of the publishers of this study that through spatial analysis they are providing a deeper understanding of the complexities of social and economic disparity and the impacts that these disparities have on health outcomes.
By acknowledging and quantifying these impacts using publically available data they have created insights that can be leveraged in the creation of public policies at the local state and national levels that not only reduce inequity but in doing so save lives.
Want to visualize and draw new insights from your spatial data?


