What's new in CARTO - Q3 2026


AI agents are quickly becoming where work gets done. More and more of the questions teams ask every day now start in a chat with Claude, Copilot, or ChatGPT, not in a dedicated tool. But when a question turns spatial, general-purpose AI can struggle to reach accurate answers efficiently without specialized geospatial context, skills, and tools. With access to governed data and the right spatial capabilities, it can get there faster and more reliably, and deliver insights everyone can trust and understand.
That’s what we focused on this quarter. Every CARTO capability is now an MCP Tool, so any agent your team uses can create maps, run Workflows, query your warehouse, and more, with every action running in your own cloud and using each person’s own permissions. We also made our own AI Agents smarter, with semantic models that teach them your business metrics and maps that update live as they work.
At the same time, we kept investing in the map itself. Builder has a brand new layout, more ways to filter and style your data, and more control over what you export. That’s because AI Agents don’t replace the map. They make it the place where answers show up.
Now let’s take a look at the highlights from this quarter’s CARTO release, and remember to keep an eye on our What’s New page for the latest updates.
Agentic GIS
All of CARTO, in every AI Agent
Helps you to: Do real spatial work from whichever AI platform your team already lives in.
Your colleagues already ask Claude, Copilot, or ChatGPT for help every day. But as soon as a question turns spatial, they either switch to a separate GIS tool or, worse, let a general-purpose AI improvise an answer it can’t back up.
This quarter, every CARTO capability became an MCP Tool. Creating and editing maps, building and running workflows, querying your warehouse, importing data, geocoding, routing, isochrones, the Data Observatory, and even user and admin management: all of it is now available through the CARTO MCP Server. It works with Claude, ChatGPT, Microsoft Copilot, Gemini Enterprise, Snowflake Cortex, Databricks Genie, Oracle Agent Factory, Perplexity, and any other MCP-compatible host. Open-source Agent Skills teach those agents to use the tools the way a spatial expert would.
And nothing about your governance changes. Every query runs in your own warehouse, every tool call uses the person’s own credentials, and every action is logged. Read the full story in All of CARTO, in every agent, or see it in action in the AI platform your team is using:
Teach your AI Agents your business with semantic models
Helps you to: Get accurate answers from AI Agents, the first time.
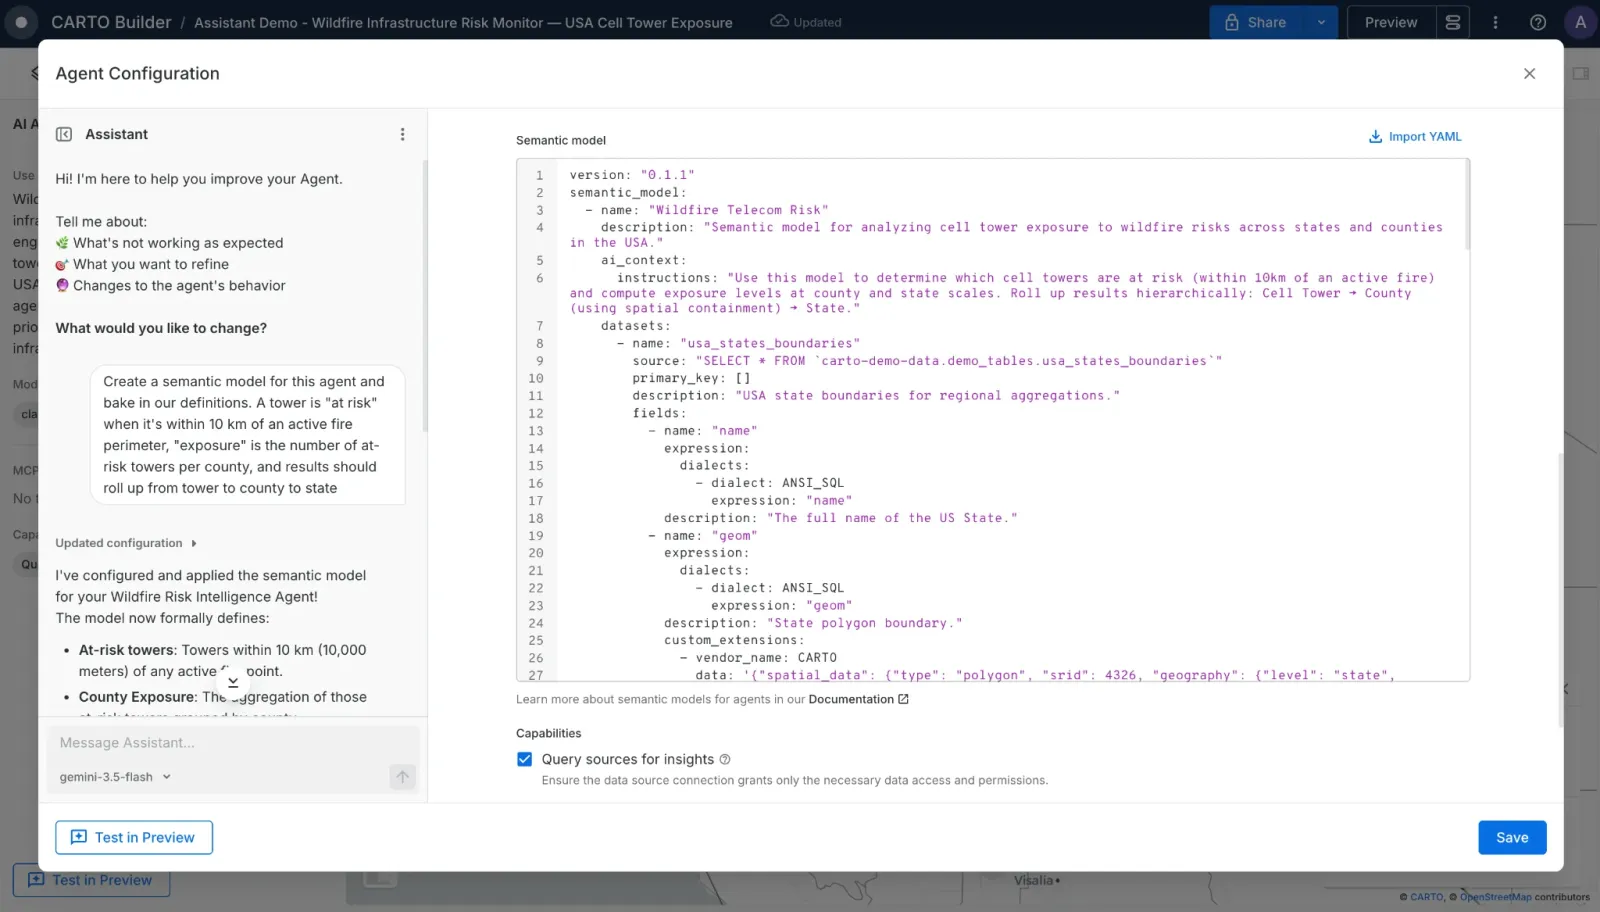
Ask an AI Agent about “revenue per store” and it has to guess which column means revenue, which table holds the stores, and how the two join. Cryptic column names and unwritten business rules are exactly where agents go wrong.
You can now give your AI Agents a semantic model that defines your tables, columns, metrics, and spatial structure, so they write the right SQL against your data. It’s built on the open Apache Ossie standard, so the business knowledge you capture isn’t locked into a single tool. Learn more in our blog on Spatial Semantics.
The latest AI models, as soon as they launch
Helps you to: Use the newest models without waiting for a platform update.
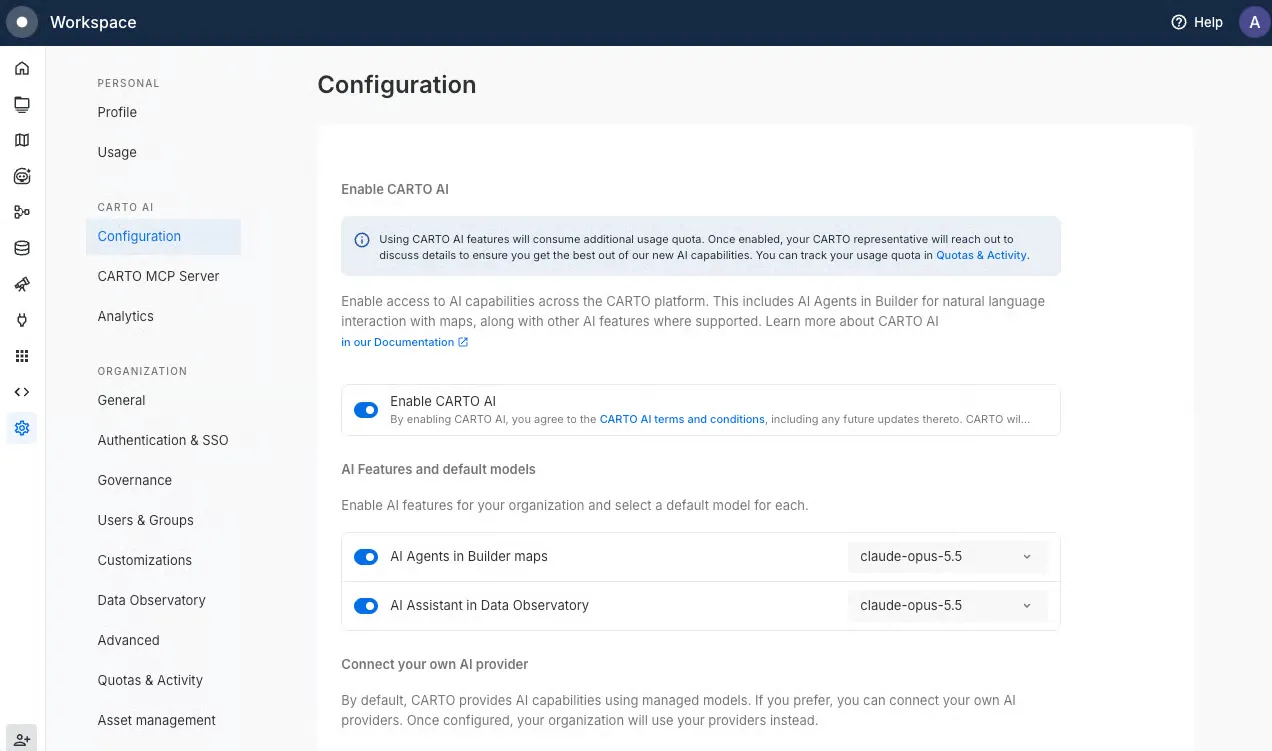
New AI models are arriving every few weeks, but if your GIS platform is slow to support them, your AI Agents run on last year’s model while your teams use the latest one everywhere else.
Claude 5, Gemini 3.8, and GPT-6 Astra are now available in CARTO, both in the CARTO-managed set and through bring-your-own-provider options. Learn more in our Documentation.
Test your MCP Tools before agents call them
Helps you to: Publish agent tools with confidence.
Once a workflow becomes a tool that colleagues’ agents can call, any mistake in it gets repeated every time someone asks a question. You want to catch problems before that happens, not after.
You can now run a Workflow-backed MCP Tool straight from the canvas, through exactly the same server path an agent uses, with step-by-step progress and a run history for the session. The analyst who built the tool catches the issue, not the colleague who relied on the answer. Learn more in our Documentation.
Visualization & App Development
This quarter was all about giving you more control over how your maps look, feel, and behave in Builder.
A brand new layout for Builder maps
Helps you to: Design maps that look great and work on any screen.
As your maps take on more interactive elements, the controls can start crowding out the data they’re meant to explore. That problem is even worse when you’re using a smaller screen.
Builder maps now have a completely new layout. Widgets live in a flexible panel you can set to one or two columns, docked or floating. SQL parameters sit in a tidy bar above the map. And maps automatically adapt to tablets and phones. You get more room for the map, more control over the layout, and a map that works wherever your audience opens it. Learn more in our Documentation.
Filter your data by clicking directly on the map
Helps you to: Ask questions of your map just by pointing at it.
“What’s happening inside this district?” Until now, answering that meant building a widget, filtering with a SQL parameter, or asking an AI Agent. But the fastest way to explore a map is often just to click on it.
You can now click any feature in Builder to filter by it, or use a spatial mask to filter every layer that intersects it. Click a district, and see only the incidents, assets, or customers inside it, with no setup required. Learn more in our Documentation.
Dashed strokes and fill patterns
Helps you to: Tell more of the story without relying on color alone.
Planned versus existing infrastructure. Disputed boundaries. Zones that overlap. Color can only carry so many distinctions, and it falls apart entirely in grayscale print or for color-blind readers.
Lines and polygon borders can now be solid, dashed, or dotted, and polygons can use hatch, cross-hatch, dot, and checkerboard fill patterns. Everything is reflected automatically in the legend. It’s a classic cartographic toolkit, now in Builder. Learn more in our Documentation.
Export your maps as high-resolution images
Helps you to: Take your maps into reports, slides, and print, no screenshots needed.
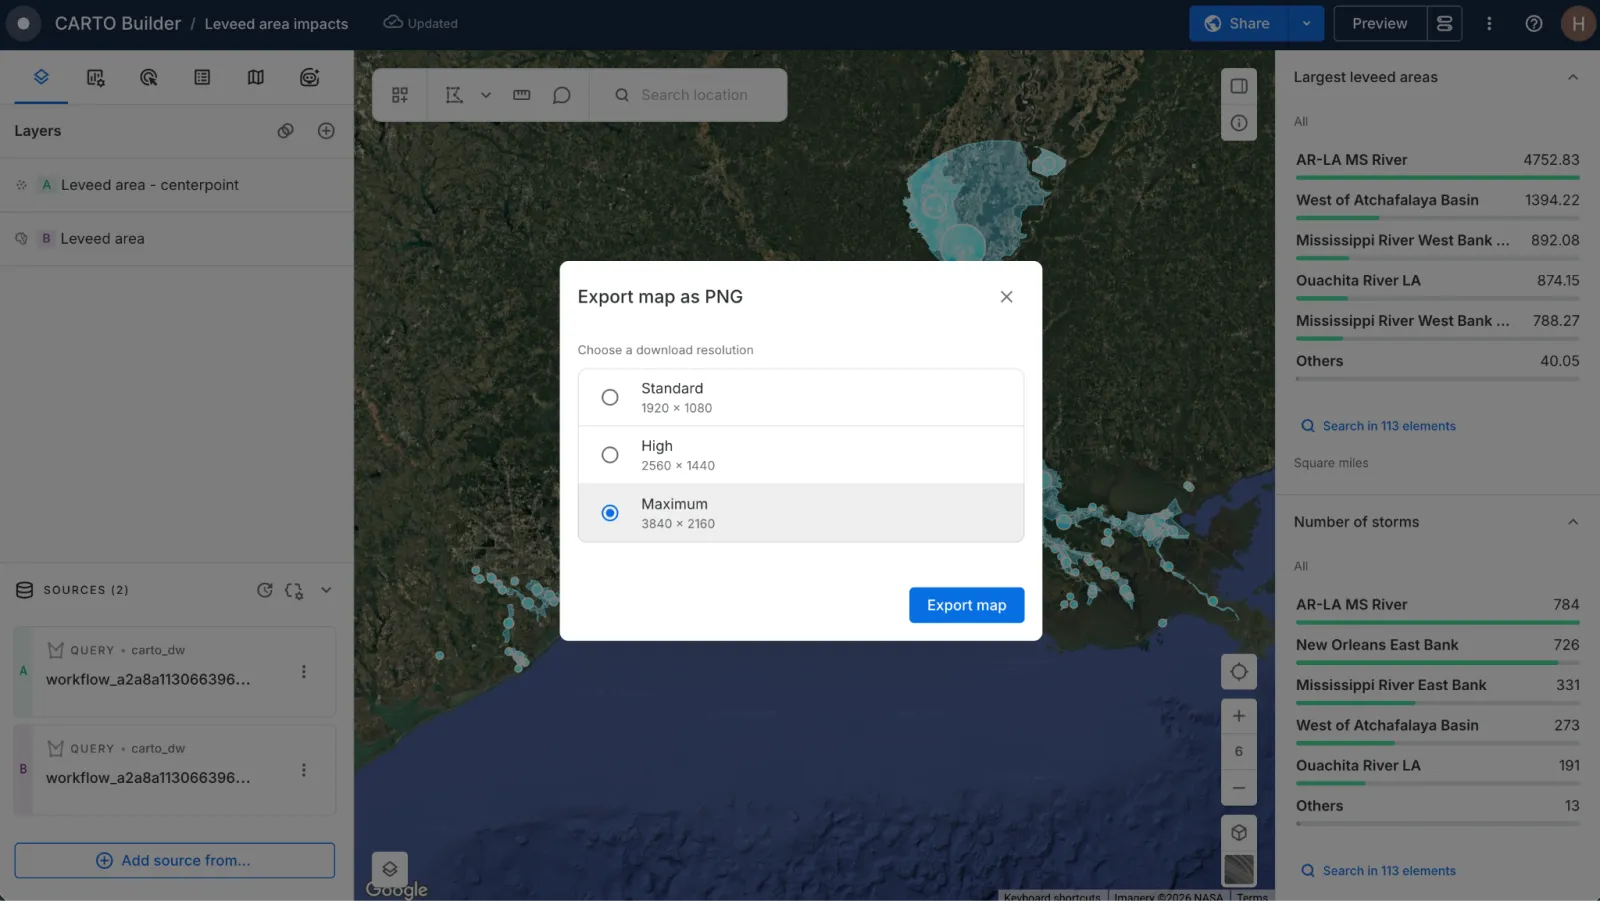
A screenshot that looked fine on your laptop rarely survives a printed report or a conference screen. And stakeholders shouldn’t have to ask you every time they need an image of the map.
You can now export a Builder map view as a PNG at exactly the dimensions you need. You can also let viewers of shared or public maps export images themselves. Learn more in our Documentation.
More export formats, with you in control
Helps you to: Share data from your maps safely, in the format people need.
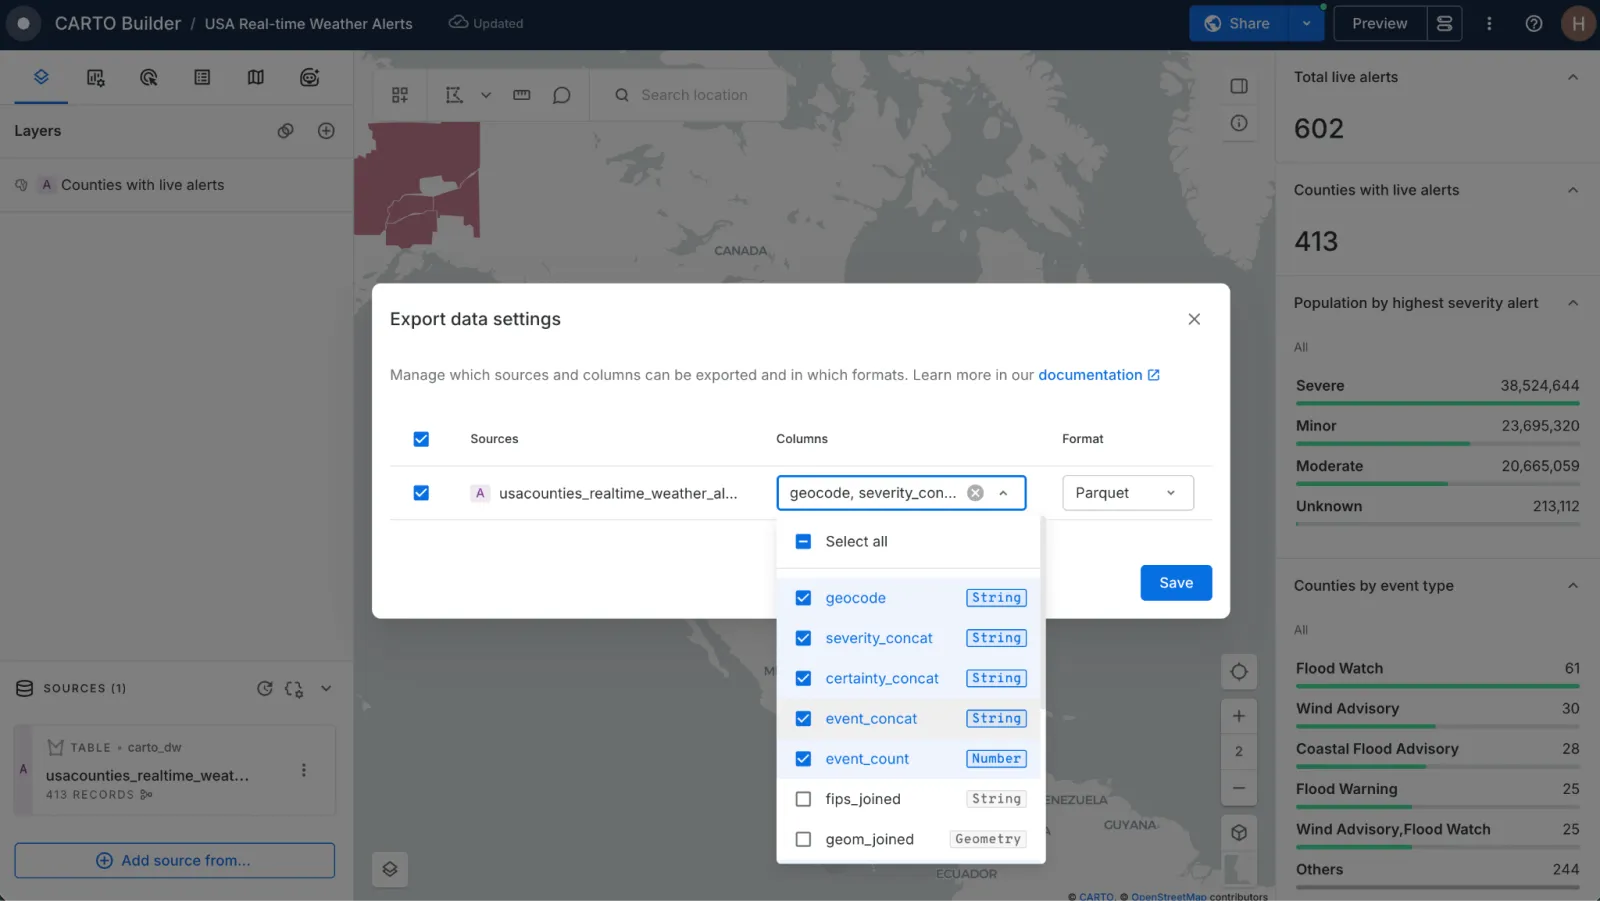
Colleagues want map data in the format their own tools use. You want to be sure sensitive fields never leave the map.
Data exports from Builder now include GeoJSON, Shapefile, GeoParquet, and KML. Editors decide exactly what can be exported: which sources, which columns, and which formats. People get data they can use, and the fields that should stay private do. Learn more in our Documentation.
And a few more Builder improvements…
- Widgets that match your layers. Pie and Time Series widgets now inherit the layer’s category colors when they use the same column, and those colors stay put as you zoom, pan, and filter. Documentation
- Single-select text parameters. Text parameters can now allow exactly one choice, shown as a radio list with a default. Documentation
Data & Analytics
Get data in and results out of any workflow, in any warehouse
Helps you to: Automate your pipelines from start to finish, whichever warehouse you use.
Too many automated pipelines end with a manual step: someone downloads a CSV, converts it to a Shapefile, and emails it on. That isn’t automation. It’s a to-do list.
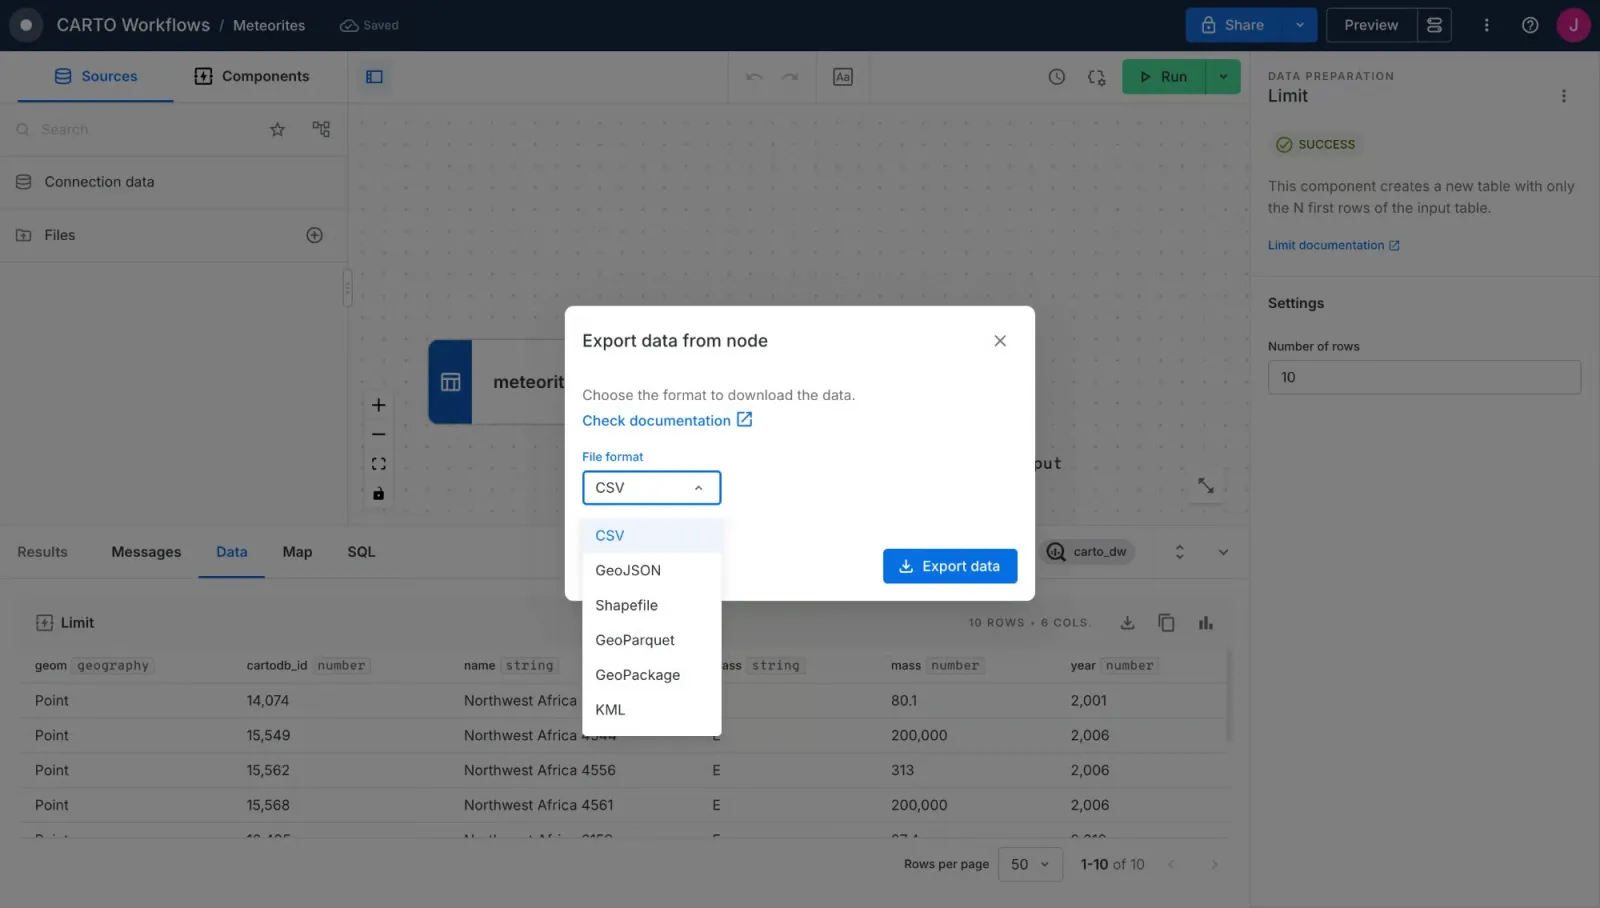
Getting data in now works the same everywhere. Teams on Databricks and Oracle can import files from their machine or a URL, and the Import from URL and export components in Workflows run across BigQuery, Snowflake, Redshift, Databricks, and Oracle. Getting results out is just as direct: new Export as File, Export Tables as PDF, and Send by Email components deliver a workflow’s results straight to the people who need them. You can also choose the format when exporting any node result: CSV, GeoJSON, Shapefile, GeoParquet, GeoPackage, or KML. Learn more in our documentation on importing data and Workflows components.
Five new tools for analyzing embeddings
Helps you to: Turn embeddings into spatial insights you can explain.
Embeddings capture what makes a place distinctive, but on their own they’re just long lists of numbers. The hard part has always been turning them into something you can map and explain to a stakeholder.
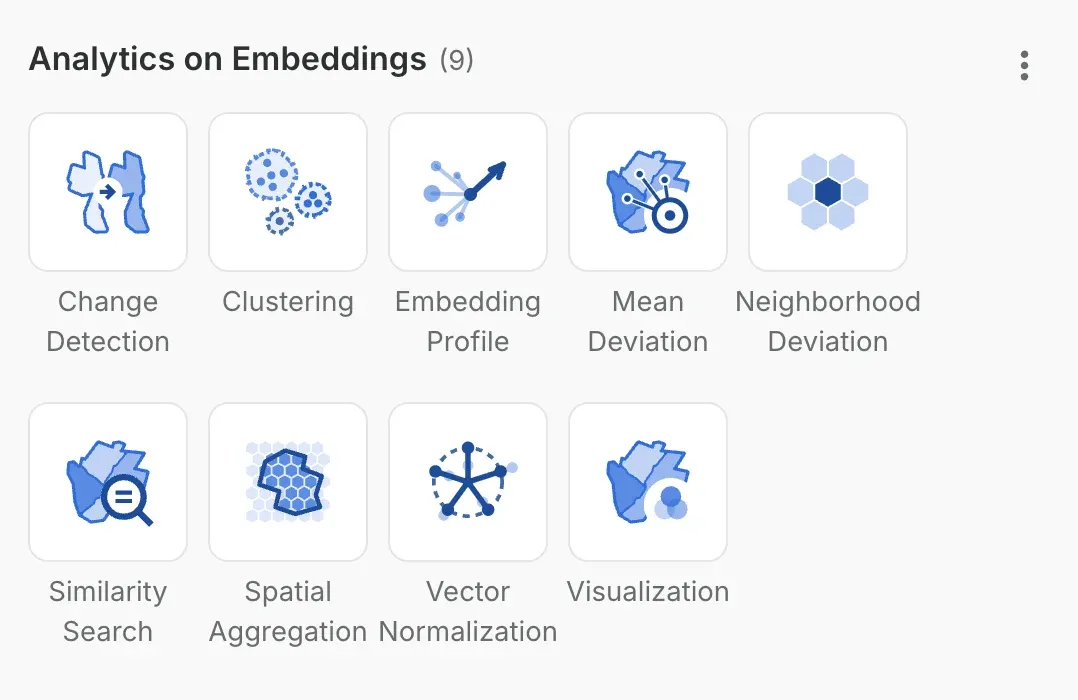
The Analytics on Embeddings package in Workflows grows from four to nine components, adding Embedding Profile, Mean Deviation, Neighborhood Deviation, Spatial Aggregation, and Vector Normalization. Profile an area, spot places that stand out from their neighbors, and roll results up to the geographies you report on. Read more in From embeddings to spatial insights.
PlacePulse Embeddings (private preview)
Helps you to: Find places that are alike across the whole US, in a single step.
Finding locations that “feel” like your best-performing ones usually means hand-picking and weighting dozens of variables.
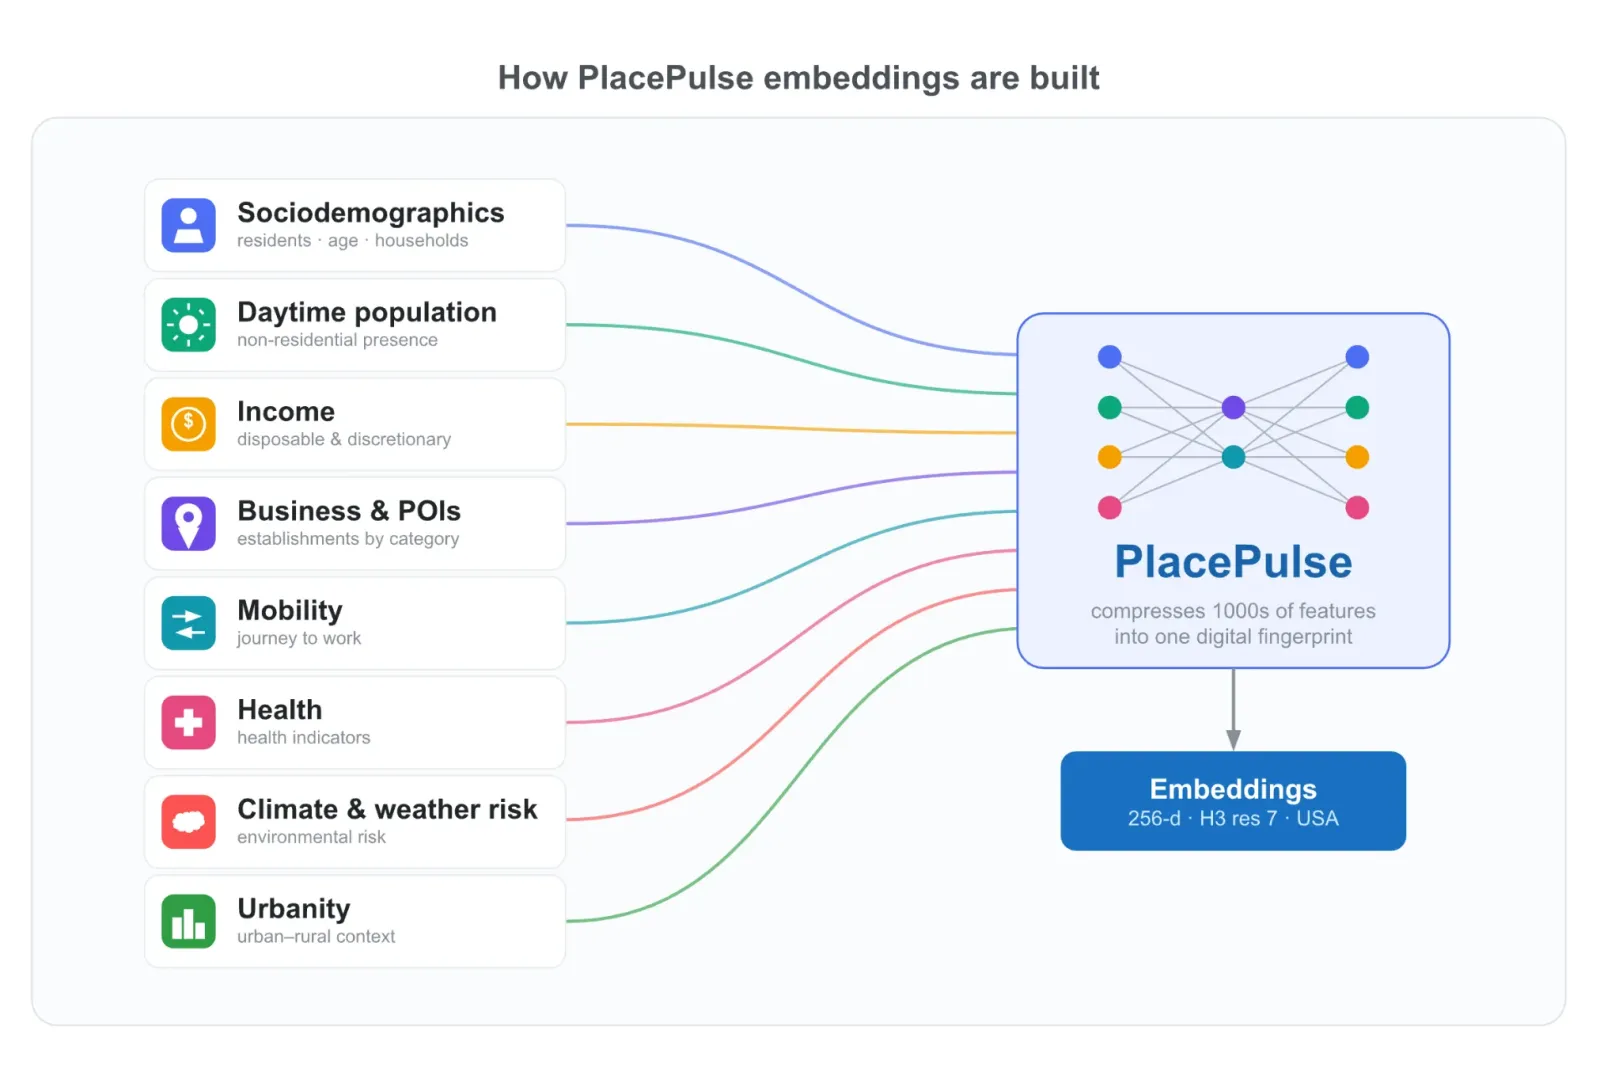
PlacePulse Embeddings, built with Applied Geographic Solutions, give every H3 Resolution 7 cell in the US a 256-dimension “fingerprint”. They’re delivered through the Data Observatory and ready to use with the Analytics on Embeddings components above. Read more in PlacePulse Embeddings: a fingerprint for every place in the US, or request early access.
Enterprise & Governance
See exactly where your usage is going
Helps you to: Understand and manage consumption without exporting a thing.
As more people, apps, and agents use CARTO, “what’s driving our usage?” becomes a question admins need answered in seconds, not after an afternoon in a spreadsheet.
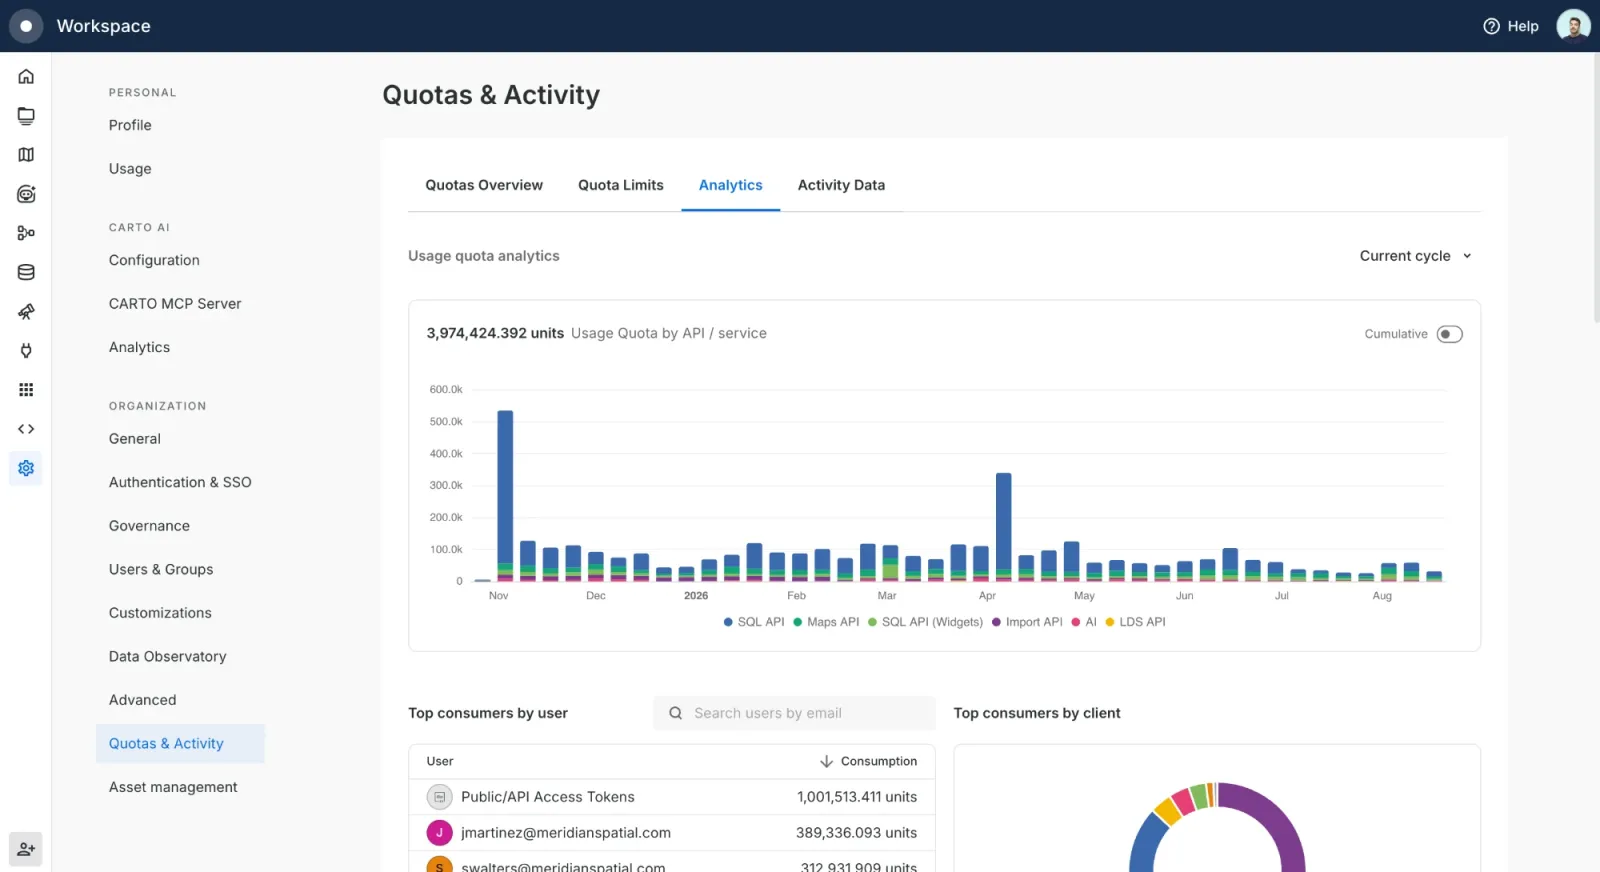
A new Analytics tab in Settings > Quotas & Activity charts usage over time and ranks the top consumers by user, client, map, and workflow. Usage from API Access Tokens is now attributed to the specific token, rather than grouped as public traffic. And every user gets a new Personal settings section to manage their profile, change their password, and track their own usage, LDS, and AI consumption. Learn more in our Documentation.
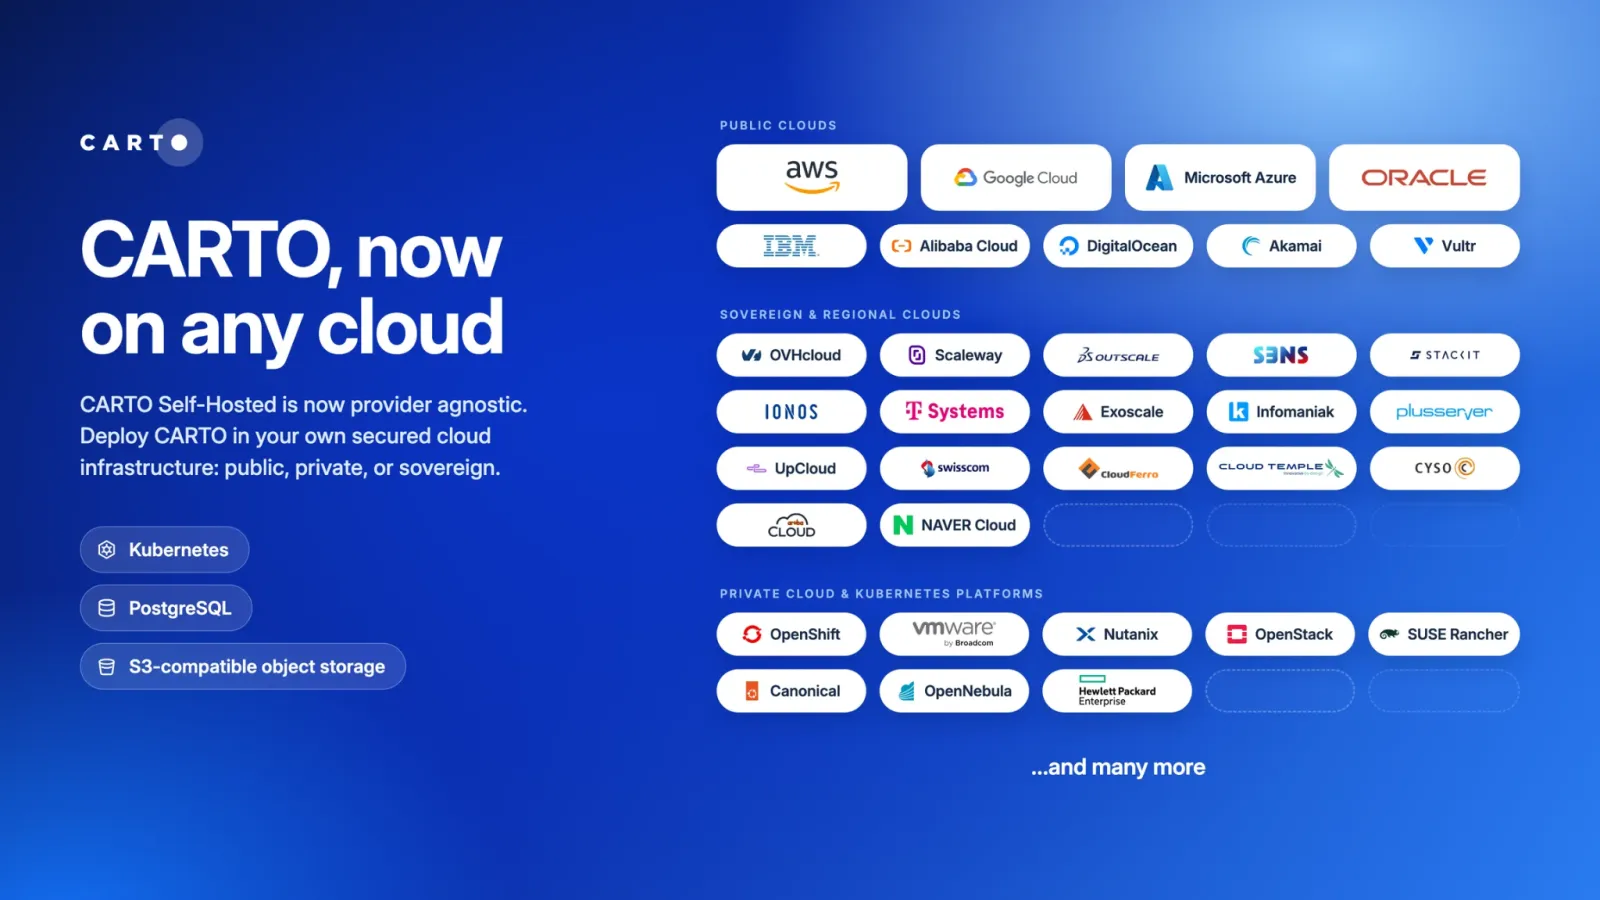
Run CARTO Self-Hosted on any cloud
Helps you to: Run CARTO wherever your data has to live, including sovereign and private clouds.
For governments and regulated industries, where data lives often isn’t a choice. It’s set by law. Until now, that could limit which clouds CARTO Self-Hosted could run on.
CARTO Self-Hosted now runs on any infrastructure with standard Kubernetes, PostgreSQL, and S3-compatible storage, including regional, sovereign, and private clouds. It’s available from version 2026.8.11. For the bigger picture, read Geospatial sovereignty in the age of AI, or get started in our Documentation.
Share with exactly the right people
Helps you to: Give access to the people who need it, and no one else.
“Everyone in the organization” is rarely the right answer for a data connection, but until now it was often the only one.
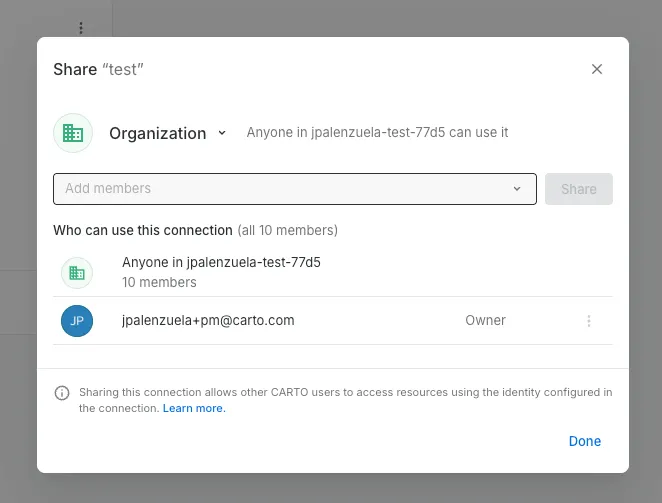
Connections can now be shared with specific users or groups. The sharing dialog also spells out whether recipients will use the connection’s own credentials or their own. Maps and workflows get the same flexibility: switch between specific people or groups, the whole organization, or public in one click, without losing existing access settings. Learn more about sharing connections and sharing maps.
And a few more admin improvements…
- Automatic user and group provisioning with SCIM. Your identity provider now pushes user and group changes to CARTO in real time, including mapping groups to roles, so new starters get the right access on day one and leavers lose it right away. Available for Enterprise Large plans and above. Documentation
- One library for your custom markers. Admins can maintain a shared library of custom point markers in Settings > Customizations > Markers. Update a marker once, and the change flows through to every map that uses it. Documentation
—
That’s a wrap on Q3 2026! CARTO now works inside every AI Agent your teams use, and Builder gives you more control than ever over how your maps look and behave.
To keep up with the latest releases, visit the What’s New page of our Documentation, follow us on LinkedIn for live updates, or sign up for our newsletter to get highlights straight to your inbox.
Want to sharpen your skills? Explore hands-on tutorials in CARTO Academy. Not a CARTO user yet? Start a 14-day free trial and try these new features yourself!
Frequently Asked Questions
What is the CARTO MCP Server?
The CARTO MCP Server makes every CARTO capability available as an MCP Tool, including creating and editing maps, building and running workflows, querying your warehouse, importing data, geocoding, routing, isochrones, the Data Observatory, and user and admin management. It works with Claude, ChatGPT, Microsoft Copilot, Gemini Enterprise, Snowflake Cortex, Databricks Genie, Oracle Agent Factory, Perplexity, and any other MCP-compatible host. Every query runs in your own warehouse, every tool call uses the person’s own credentials, and every action is logged.
What's new in CARTO Builder in Q3 2026?
Builder maps have a new responsive layout with a flexible widgets panel and a SQL parameters bar. You can also filter data by clicking features on the map, style lines and polygons with dashed strokes and fill patterns, export map views as high-resolution PNGs, and export data as GeoJSON, Shapefile, GeoParquet, or KML, with editors controlling which sources, columns, and formats can be exported.
Can CARTO Self-Hosted run on a sovereign or private cloud?
Yes. From version 2026.8.11, CARTO Self-Hosted runs on any infrastructure with standard Kubernetes, PostgreSQL, and S3-compatible storage, including regional, sovereign, and private clouds.