Taking a look at NBC's realtime Zika dashboard created with CARTO Builder


The Zika virus has been around for over 50 years but it wasn't until this year that the World Health Organization declared it a Public Health Emergency of International Concern as the virus continues to spread to new areas.
Recently NBC Washington published a map of real time Zika cases in the United States built with CARTO's new Builder! This visualization is one of the first applications of our new technology for providing people with a clear and accessible view into a real-life situation. With CARTO Builder it is our hope that media businesses and citizens are empowered to quickly and easily perform analysis to tell important stories while discovering new insight within their data.
How does CARTO Builder enable this level of interactive design? Using the NBC Washington map let's take a look at some of CARTO Builder's unique features that transform this visualization into an exceptionally helpful piece of location-based data analysis.
One of the most prominent features you will notice right away is the interactive dashboard on the right side that allows for a granular level of analysis. In moments anyone can use the Builder's user interface to create fully equipped dashboards with no coding required.
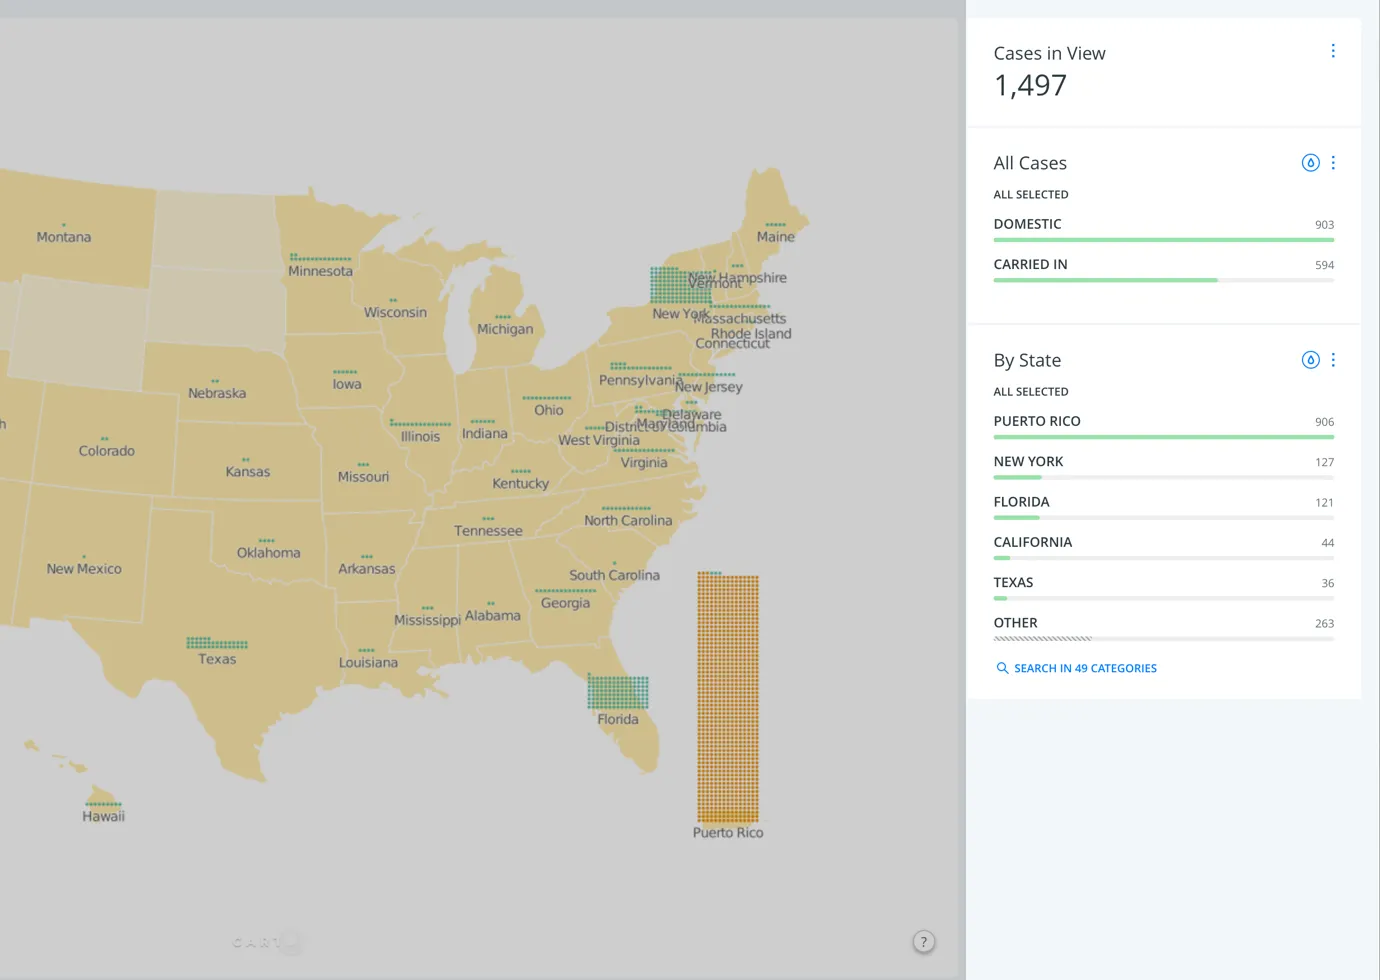
Using dashboard widgets the real time Zika map enables storytelling that empowers users to understand and indicate patterns over time to catch an accurate glimpse into a very critical and important situation.
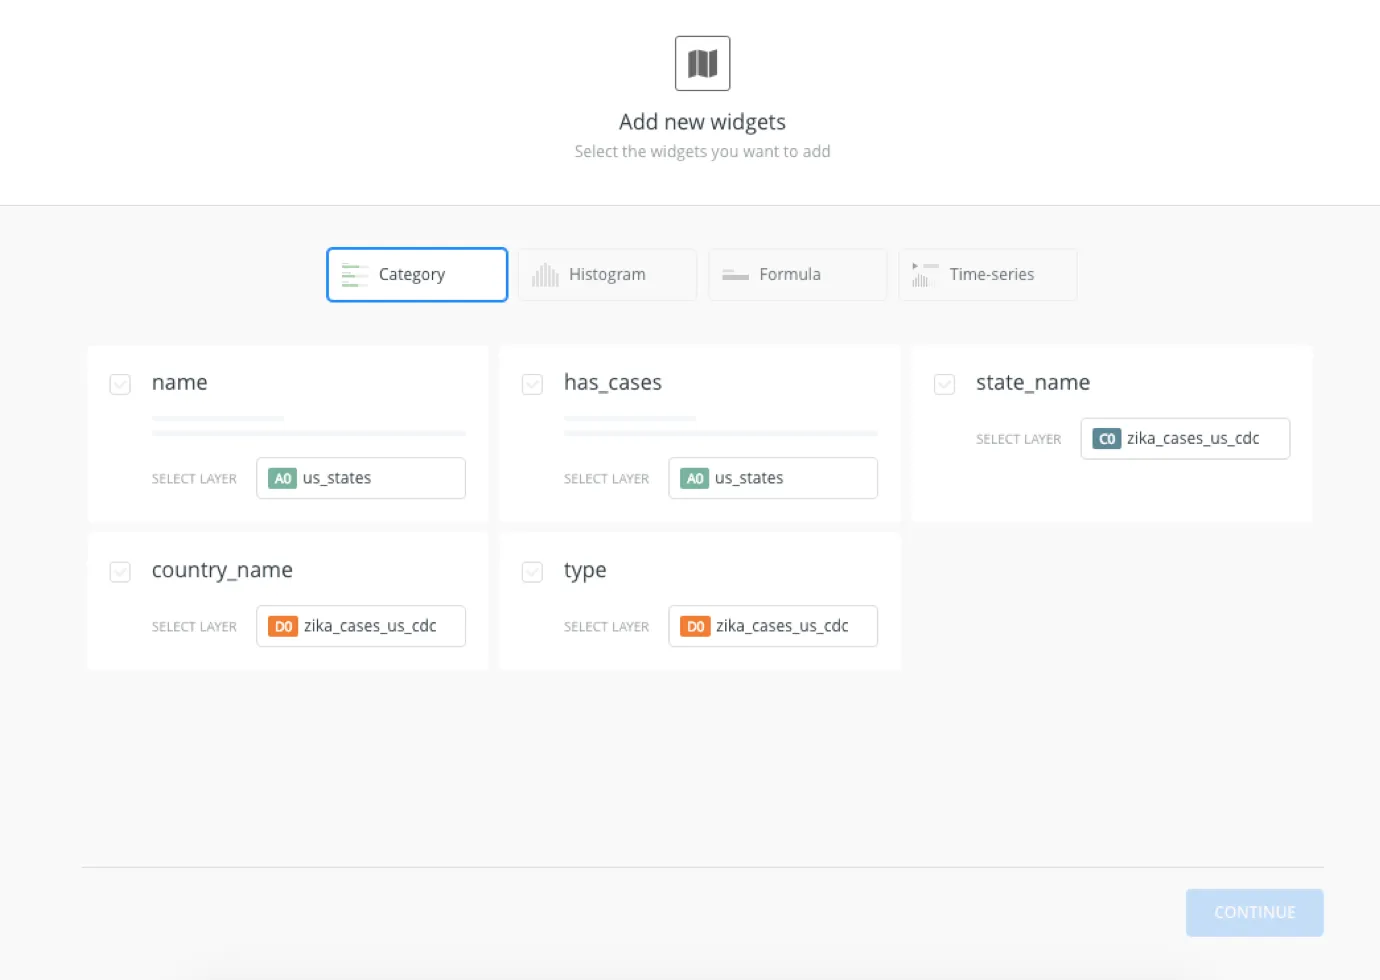
The widgets are one of CARTO Builder's most easy to implement and intuitive features. You can select from a wide variety of widgets out of the box. Everything from mathematical formulas to categorical and histogram selectors to time series sliders allowing for versatility and ease in dashboard creation.
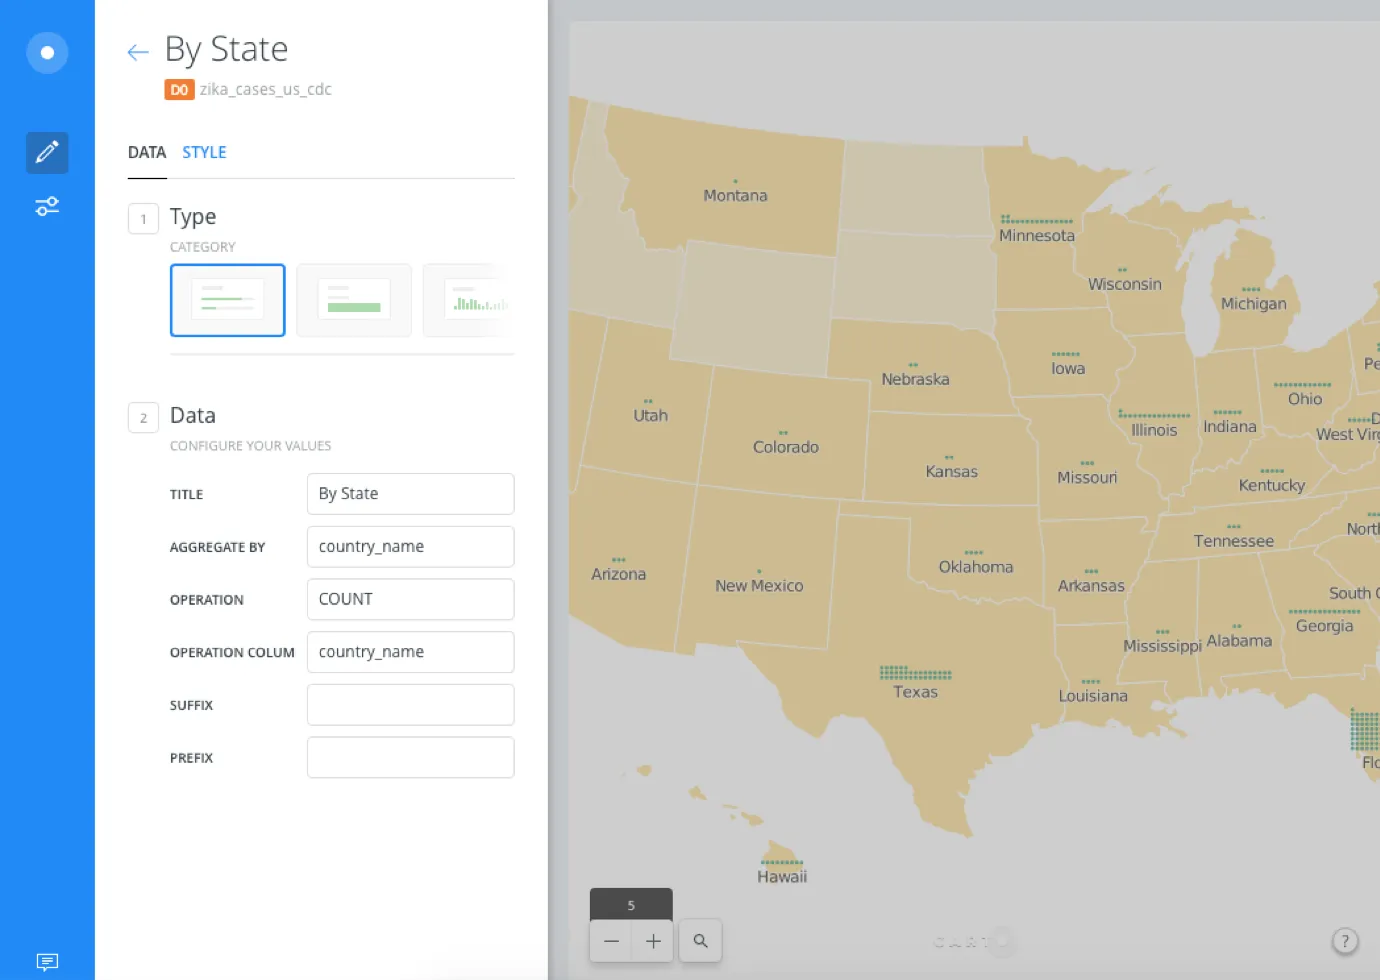
Once widgets are in place the Builder allows users to quickly position and modify the widgets themselves. In just a few clicks users are able to change texts positioning aggregation methods and a variety of other variables that make the Builder's dashboard look and feel as sophisticated as its analysis.
Another notable element of CARTO Builder is it's ability to remain dynamic when working with real time data. We wanted to focus on experience and make the interface intuitive but also increasingly powerful for data analysis. While CARTO Builder makes complex analysis and design simple we've retained the advanced SQL and CartoCSS functionalities available from the Editor and improved the coding interface.
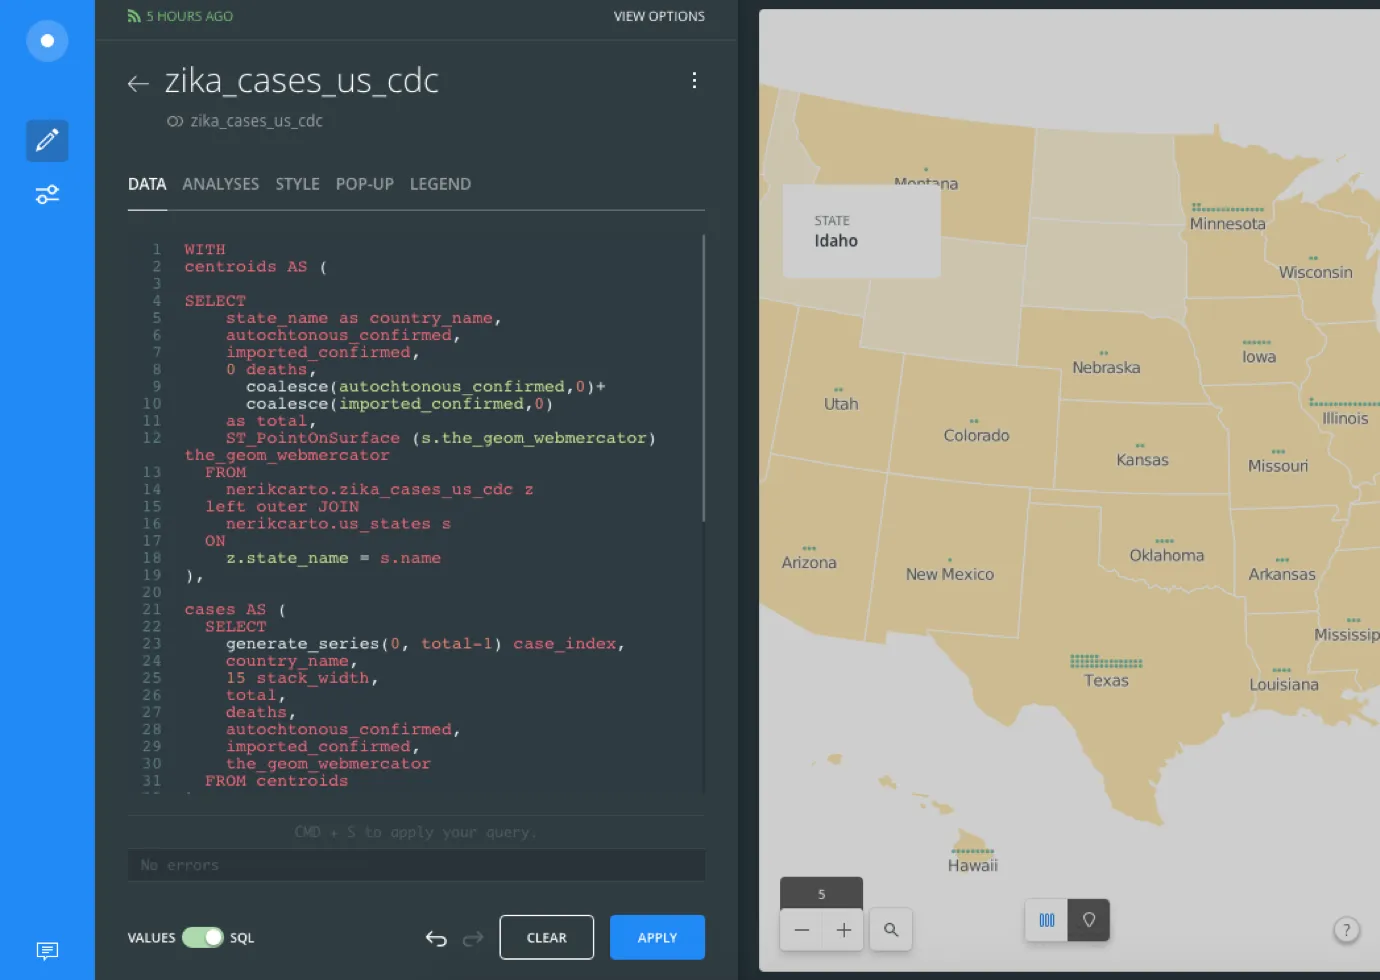
The data we used in creating the map is directly synced with the Center for Disease Control. Because of this it was essential for us to modify the data on the fly as it came so that formatting and design could remain consistent as the case numbers grew. With CARTO Builder we were able to automate both how the data was presented and how it populated on the map in real time.
We hope you enjoyed taking a look into CARTO Builder and how it's being used sign up and stay tuned for more news and interesting applications.
Happy data analysis!