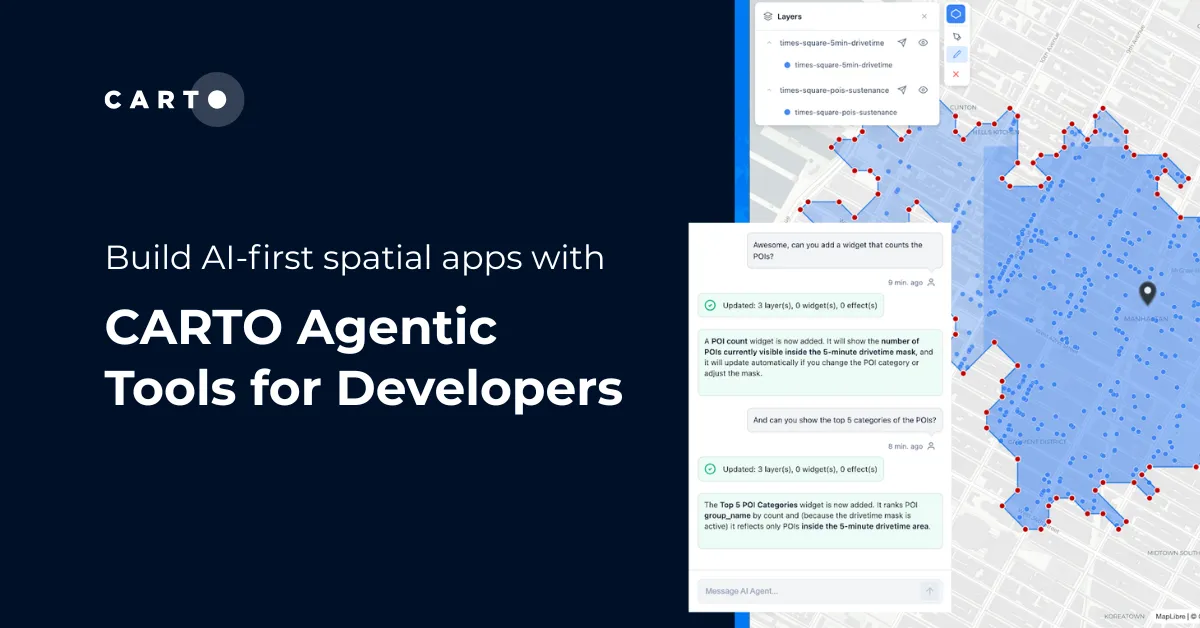
Personalizing services with spatial analytics in Google Cloud

Personalizing services with spatial analytics in Google Cloud

Personalize services at scale with spatial analytics on Google Cloud. Learn how to boost ROI using CARTO for location-based insights.

Use cases

Top Posts

Cloud Native

Geospatial & AI at the Databricks Data + AI Summit 2025

Cloud Native

Snowflake Summit 2025 - highlights for geospatial

Cloud Native

How Iceberg, GeoParquet & CARTO are reshaping geospatial

CartoDB Migration Complete, Welcome to 2.0

CartoDB Migration Complete, Welcome to 2.0

Explore CartoDB 2.0 migration: enhanced spatial data visualization, improved performance, upcoming features. Share your feedback with the community.

Spatial Data Science
Visualizing 50 Years of Rolling Stones Concerts

Visualizing 50 Years of Rolling Stones Concerts

App Development
Powering Real-Time Election Results

Powering Real-Time Election Results

Cloud Native
Things are moving fast in the mapping community #SOTMPDX

Things are moving fast in the mapping community #SOTMPDX

Explore the significant events of 2012 in the world of maps, from Google's charging to OpenStreetMap's rising influence. Exciting times ahead for online mapping

Cloud Native
CartoDB backs your apps

CartoDB backs your apps

CartoDB simplifies map-driven applications with tools like the Backbone library. Learn to leverage your data effectively online.

App Development
A round-up of maps build by CartoDB users

A round-up of maps build by CartoDB users

Discover projects from the US Dept. of Energy's Alternative Fueling Station Locator to Baltimore's Vacant Buildings map and Moscow's DIY traffic counter.

Customer Stories
A Code for America's open city tool powered by CartoDB

A Code for America's open city tool powered by CartoDB

Explore NeighborDiff by Code for America: a collaborative mapping tool reshaping Macon, GA, powered by CartoDB.

Cartography & Visualization
Our first collaboration with The Guardian, a time lapse map of Syrian casualties

Our first collaboration with The Guardian, a time lapse map of Syrian casualties

Use cases
The Political Moneyball

The Political Moneyball

Uncover the web of political contributions with WSJ's Political Moneyball, powered by CartoDB. Visualizing over a million connections in real-time.

News
Meet us at the International Open Government Data Conference

Meet us at the International Open Government Data Conference

Events
The Wall Street Journal's 2012 election map done with CartoDB

The Wall Street Journal's 2012 election map done with CartoDB

Discover the 2012 election map by WSJ, powered by CartoDB. Explore presidential and Senate races, filter data, and delve into economic indicators.

Cartography & Visualization
A trip back in time to 1940s in New York City

A trip back in time to 1940s in New York City

Explore 1940s New York through an interactive map showcasing local market analysis, color-coded maps, and photos. A fascinating glimpse into city life 70 years ago!

Cartography & Visualization

Academy

Personalizing services with spatial analytics in Google Cloud

Personalize services at scale with spatial analytics on Google Cloud. Learn how to boost ROI using CARTO for location-based insights.

Use cases

Overture Maps data now on the cloud: how to use it with CARTO

Announcing Overture Maps data in the cloud! Seamlessly access, analyze, and visualize data on global buildings, POIs, boundaries & more with CARTO!

Spatial Data

Geospatial & AI at the Databricks Data + AI Summit 2025

Explore the biggest geospatial & AI highlights from Databricks Data + AI Summit 2025, including Agent Bricks & native Spatial SQL.

Cloud Native