

Transcription
This customer story has been adapted from a presentation given at SDSC 2019.
The Future of Cities
Today we are going to talk about a project that we have been doing together with CARTO called the Atlas of Inequality. This is a project I have been working on both at MIT and at the University Carlos III de Madrid. Based on social problems that we have in our cities. Today I’m presenting one of the last reports of the European Commission entitled “Future of Cities” which can be read anywhere on the web today. Cities are where our social life is happening today and is going to happen in the future. By 2050, 75% of people in the world are going to live in cities, but cities have a lot of problems and actually this report outlines seven of these which are very intertwined between them.
One of them has a significant mental impact, the aging in our cities, the housing problems that we have in our cities, the labor markets – because most of our companies are actually embedded into our urban fabrics, the new forms of a governance, and you can also see about the new modes of mobility that we have in our city.
Social Segregation in US Cities
But today I’m going to talk about one specific problem that we have in our city which is social segregation. I’m also going to talk today about the where and the why of this social segregation. I’m going to talk about the places and why we are segregating in our cities.
When you talk about segregation in our cities this is a typical picture that you have and is referencing the where. This is Mexico City and you can see two areas, one which is on the left is very slum-like so you might think it’s a poor area, which is only 10 meters away, from a rich area. This is what people have in mind when they talk about social segregation or inequality in our cities. Actually, we want to challenge the idea that most of the segregation that is happening in our cities and most of the inequality has to do only with the where. We are going to challenge this by using highly precise and high frequency location data that comes from Cubic which is a company that deals with location-based services. We have gathered data from 11 cities in the United States, these are the most populated metropolitan areas in the US. What you’re going to see today is not about just the city but the whole metropolitan area, so for example the Boston metropolitan area contains large areas of New Hampshire and the area around New York contains Long Island, New Jersey, etc.
We have a lot of people in this database, around 4.8 million people up to six months of data. So one of the things that we wanted to do is to challenge this idea that only the where matters and we found the following thing: we found that anybody on average, around 75% of the people we encounter/interact with daily live more than 15 kilometers away..
75% of the people you work with, 75% of the people you collaborate with & 75% of your friends live more than 15 kilometers away from where you live. So if you want to understand the segregation of our city we might have to go beyond the where, we have to start thinking about the why.
Calculating the Inequality of a Place
Where and why is segregation happening? It’s not happening in our neighborhoods because most of the things that we do happen away from our neighborhood. So, where is it happening and why is it happening? Let me show you a video in which you’re going to see our data set from downtown Boston. What you can see here is that each dot is a person that is staying for more than 5 minutes in one place with the colors a proxy for income and cycling through the day. You can see that when the day starts there’s a lot of people actually getting together from different economic backgrounds downtown, in the hospital areas, even within the airport, also here at the Media Lab, at Harvard Square, etc. You can see places in which people from different incomes get together and those places are not segregated. But there are also other places in which only red people get together with red people which means that low-income people get together only with low-income people here in these areas.
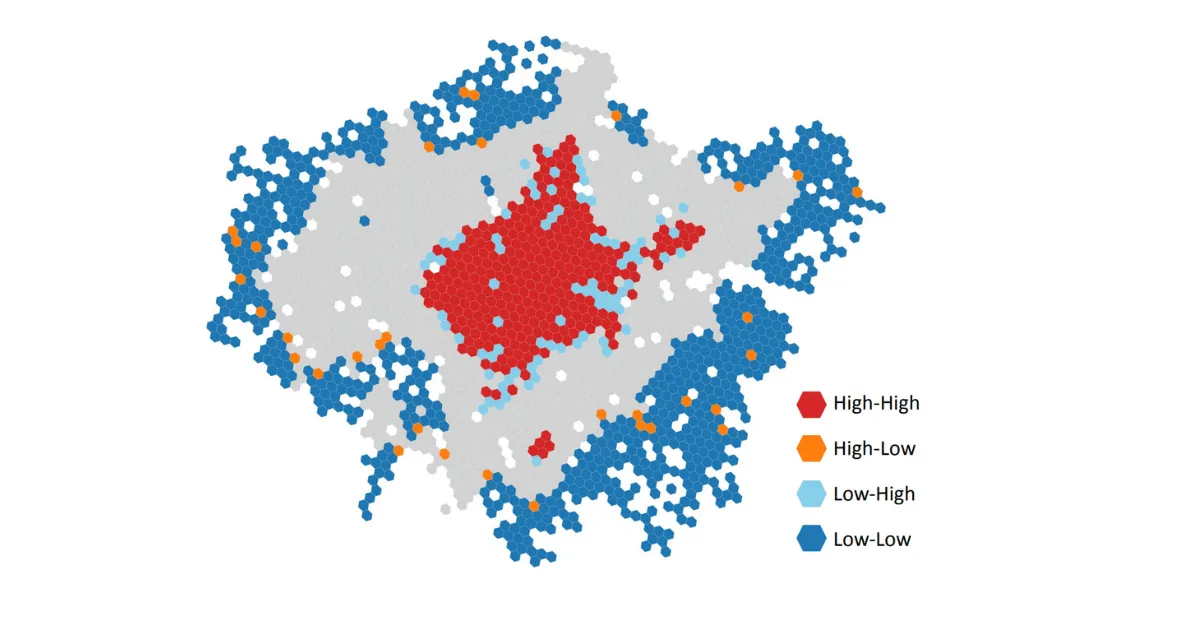
So we want to understand where are those places, what are those places, which people from different incomes get together and why those places are visited by people from different incomes. In order to do that the first part was to develop this Atlas of Inequality, which is online at inequality.media.mit.edu in which basically we have 1.2 million points of interest in our cities, for example a restaurant, a university etc. Here you can actually go around and see all the restaurants, the shops, the train stops, etc. and all of them are colored according to what we call the inequality of the place.
The inequality of the place is how uneven the distribution of incomes of the people visiting that place is. So, a very unequal place with 100% inequality is a place which is visited only by 1 income group and a place which is very equal is a place which is visited by all the income groups in the city. You can see here something which is astonishing to us, you can see a lot of red points together with blue points. Even just across the street you can see points which are red and blue which means that in 10 meters you can go from being in an unequal place to being in an equal place. You don’t have to move from the Bronx to downtown Manhattan you just have to go from one side of the street to the other to actually meet different people.
Segregation & Choices
Actually, it is so astonishing that what we did next was get all these 1.2 million points of interest and what we produced is this plot – which is a very complicated plot, where each point is the average of all the places in our dataset that belong to one of the categories in the Foursquare hierarchy of categories.
This shows us places such as schools, work, healthcare, and leisure and entertainment. This dimension measures how segregated those places are, on average in the 11 cities that we have in the United States and this dimension measures how far you have you need to travel to reach these places. Typically places Iike grocery stores, supermarkets or schools you have to travel less than 10 kilometers to go to these places, but if you want to go to the airport or to a science museum you have to travel a lot much further. This shows there is a correlation between inequality and distance traveled.
Of course there are probably few airports in a city so most of the people that have to travel by plane have to go to the same place. So, this is very unequal but not everything is explained by the distance you have to travel. You can see here for example that offices are as segregated as the average place segregation in the United States but factories and warehouses are around 30% more segregated than offices. So, workplaces are less segregated but not all of them are segregated and actually you travel the same amount of distance to go to a factory than to your office and they have different segregations. So the category of the place matters and I’m going to convince you that the choices you make in your life and the opportunities that you have in your life matter and those choices and those opportunities are going to determine how segregated you are.
Even the type of food that you like matters - the most segregated restaurants in the United States are Latin American and fast-food. Those restaurants are highly segregated and the less segregated restaurants are American, tex-mex and Asian restaurants except Chinese. Just the choice of food that you are going to make today is going to matter for the segregation that you are going to experience.
Does the opening of a single business in my neighborhood have an impact on inequality? We decided to monitor the impact of a famous restaurant opening in the Boston area. The Prudential Center is an upscale mall in downtown Boston and in November 2016 Eataly opened there. Eataly is a restaurant with a grocery store where you can find many Italian products. What we measured there was the inequality of the area before and after the opening of that business. Of course malls are less segregated in general than any place in the city, they are less segregated because they put together a lot of people from different backgrounds. So in general malls in this case were 15% less segregated than the whole area but just the opening of Eataly decreased inequality by 10%. Just a single business opening in a mall actually decreased the total segregation of the area by 10%.
The Why Behind the Where
So we wanted to go further than this, I’m still talking about the where & I haven’t talked about the why. I kind of hinted a little bit why we are segregated is because of our choices. For example, if you spend a lot of time in schools, in offices, doing grocery shopping, or at home you’re probably segregating.
So what we did was the following: we took our 4.8 million people and we ran a model, actually this is a very complicated machine learning model in which basically we included all the variables that we expected to have an impact on the segregation of individuals. What do I mean by the segregation of an individual? I mean the amount of people that you see everyday of your life and how unequal is that distribution of people they see every day in your life.
So a person who is segregated means that this person is only encountering people of his own group and a person who is not segregated is a person encountering people from many different income groups. What we found is actually that 55% of the inequality that a typical person experiences in the United States comes from behavioral features, from the choices that you make - from the restaurant that you choose across the street not from where you live, only 45% comes from your race, age, employment, income, etc.
This is very simple modeling in which basically we split the variables. What matters is the why, what matters is the places that you visit, not actually where you live. Where you live is still important, it amounts for 40% of the segregation that you experience in your life, but more than half of the segregation that you experience in life comes from behavior.
So, if you want to understand our cities you have to start with the where – it is still important because it’s actually where things happen, but we have to start thinking more about the why because as I was telling you if we are segregated and there is inequality in our cities that is happening 15 kilometers away from where you live.
We have to still talk about neighborhoods but probably we have to start to talk about behaviors and that is very good news for the people that are working in equality, because I cannot helicopter people around the city, but what I can probably do is steer people’s behavior a little bit to change how unequal the everyday experiences are of everybody in big cities in the United States.
Thank you very much!