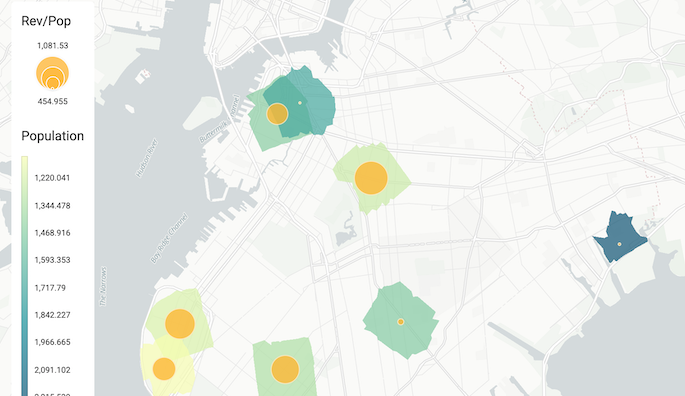
A Python package for integrating CARTO maps, analysis, and data services into data science workflows.

This component is still under support but it will not be further developed. We don’t recommend starting new projects with it as it will eventually become deprecated. Instead, learn more about our new Python packages here.

What is CARTOframes?

CARTOframes is a Python package for integrating CARTO maps, analysis, and data services into data science workflows.

Python data analysis workflows often rely on the pandas and jupyter notebook de facto standards. Integrating CARTO into this workflow saves data scientists time and energy by not having to export datasets as files or retain multiple copies of the data. To understand the fundamentals of CARTOframes, read the guides. To view the source code, browse the open-source repository in GitHub and contribute. Otherwise, read the full reference API, or find different support options.

Guides

Quick reference guides for learning how to use CARTOframes features.

Reference

Browse the interactive API documentation to search for specific CARTOframes methods, arguments, and sample code that can be used to build your applications.

Check Full Reference API
1
2
3
4
5
6
7
8
9
10
from cartoframes.auth import set_default_credentials
from cartoframes.data.observatory import Enrichment

set_default_credentials('creds.json')
enrichment = Enrichment()

enriched_df = enrichment.enrich_points(
    df,
    variables=['total_pop_3cf008b3']
)

Examples

Play with real examples and learn by doing.

In [1]:
import pandas
from cartoframes.auth import set_default_credentials
from cartoframes.data.services import Geocoding

set_default_credentials('creds.json')
In [2]:
file_path = 'https://libs.cartocdn.com/cartoframes/samples/london_stations.xls'
df = pandas.read_excel(file_path, header=6, sheet_name=1)
df.head()
Out[2]:
nlc Station Borough Note Weekday Saturday Sunday Weekday.1 Saturday.1 Sunday.1 million
0 500.0 Acton Town Ealing 9531.0 6716.0 4744.0 9382.0 6617.0 4785.0 6.040516
1 502.0 Aldgate City of London 15080.0 4397.0 3261.0 16023.0 5909.0 4230.0 8.846940
2 503.0 Aldgate East Tower Hamlets 22327.0 16166.0 13323.0 21071.0 13893.0 11347.0 13.998292
3 505.0 Alperton Brent 4495.0 3279.0 2345.0 5081.0 3392.0 2445.0 3.052230
4 506.0 Amersham Chiltern 3848.0 1876.0 1232.0 4025.0 1797.0 1121.0 2.321692
In [3]:
df = df.rename(columns={
    "Saturday.1": "saturday_exit",
    "Sunday.1": "sunday_exit",
    "Weekday.1": "weekday_exit",
    "Saturday": "saturday_entry",
    "Sunday": "sunday_entry",
    "Weekday": "weekday_entry"
})

df.head()
Out[3]:
nlc Station Borough Note weekday_entry saturday_entry sunday_entry weekday_exit saturday_exit sunday_exit million
0 500.0 Acton Town Ealing 9531.0 6716.0 4744.0 9382.0 6617.0 4785.0 6.040516
1 502.0 Aldgate City of London 15080.0 4397.0 3261.0 16023.0 5909.0 4230.0 8.846940
2 503.0 Aldgate East Tower Hamlets 22327.0 16166.0 13323.0 21071.0 13893.0 11347.0 13.998292
3 505.0 Alperton Brent 4495.0 3279.0 2345.0 5081.0 3392.0 2445.0 3.052230
4 506.0 Amersham Chiltern 3848.0 1876.0 1232.0 4025.0 1797.0 1121.0 2.321692
In [4]:
gc = Geocoding()

london_stations_gdf, london_stations_metadata = gc.geocode(
    df,
    street='Borough',
    city={'value': 'London'},
    country={'value': 'United Kingdom'}
)
Success! Data geocoded correctly
In [5]:
london_stations_gdf.head()
Out[5]:
the_geom nlc station borough note weekday_entry saturday_entry sunday_entry weekday_exit saturday_exit sunday_exit million gc_status_rel carto_geocode_hash
0 POINT (-0.30421 51.51335) 500.0 Acton Town Ealing 9531.0 6716.0 4744.0 9382.0 6617.0 4785.0 6.040516 0.55 985f9d318280297b6108bc30e92d92e1
1 POINT (-0.08895 51.51333) 502.0 Aldgate City of London 15080.0 4397.0 3261.0 16023.0 5909.0 4230.0 8.846940 0.88 7abfcd5c0283e877a275f0d059836a09
2 POINT (-0.03228 51.51740) 503.0 Aldgate East Tower Hamlets 22327.0 16166.0 13323.0 21071.0 13893.0 11347.0 13.998292 0.75 c1ba0efb09cc8e5caf79092547a7a3e7
3 POINT (-0.24564 51.55493) 505.0 Alperton Brent 4495.0 3279.0 2345.0 5081.0 3392.0 2445.0 3.052230 0.55 c9f07eb29a060527ca81a613cca80007
4 POINT (-0.15566 51.52048) 506.0 Amersham Chiltern 3848.0 1876.0 1232.0 4025.0 1797.0 1121.0 2.321692 0.54 518e37ccd63a56df5d5758fb8e52a5dd
In [6]:
from cartoframes.viz import Map, Layer

Map(Layer(london_stations_gdf), viewport={'zoom': 10, 'lat': 51.53, 'lng': -0.09})
Out[6]:

Support

Get help or learn about known issues.