Geocoding with Builder using Street Addresses
Apply the Geocode analysis to convert street data into point geometries with CARTO Builder.
Why do you need this?
-
 You have a dataset with street addresses that you need to visualize.
 -
 You are a Builder user.
Types of Geocoding
Check out this article to learn about all the different ways you can geocode your data using CARTO.
To learn more about our different geocoders that we use in CARTO, check out this article.
To learn more about data best practices for geocoding street addresses, check out this article
Objective
For this guide, let’s apply the Geocode analysis to visualize the street addresses of fire stations within the Austin, Texas area. Different types of street data from Austin’s Open Data Portal is provided.
Street geocoding is subject to quota limitations and extra fees may apply. A permitted amount of credits are allowed per month. Any geocode matches to the indicated street address consumes credits from your account. It is recommended to view the Preparing Geocoded Data documentation before importing data to CARTO. You can also request a demo if you are interested in testing this service with your account.
It is highly recommended to materialize analysis results to avoid undesired quota consumption, especially in combination with Sync Tables, since synchronizations could trigger un-intended analysis re-run operations.
Geocode an Empty Layer into Street Address Data
This section describes how to geocode an empty layer to visualize street data.
-
Import the template .carto file, packaged from “Download resources” of this guide and create the map.
Click on “Download resources” from this guide to download the zip file to your local machine. Extract the zip file to view the files used for this guide.
Builder opens with Austin Fire Stations as the first and only map layer. The layer also indicates that no geometry can be shown and provides a shortcut to apply the GEOCODE analysis.
- Click on GEOCODE from the Austin Fire Stations map layer.
The ANALYSIS tab opens and Geocode is automatically selected. If you switch to the Data View, you will notice that the_geom column contains null values, even though there is an address, city, and state column.
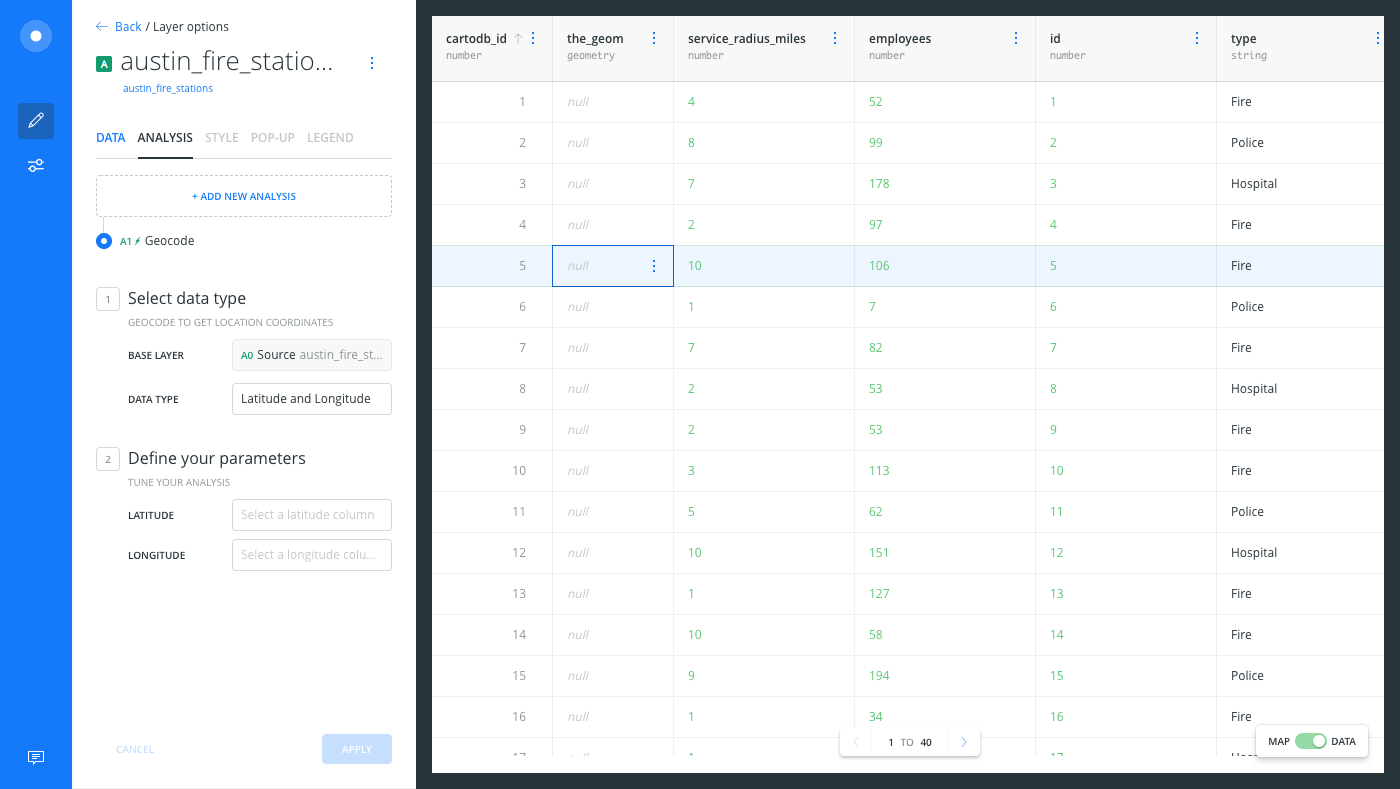
The Data View and Map View appear as buttons on your map visualization when a map layer is selected. Click to switch between viewing your connected dataset as a table, or show the map view of your data.
-
Change the geocode TYPE to Street Addresses.
Once Street Addresses is selected, you are notified how many credits will be consumed from your account.
-
Apply the following street geocoding parameters:
When geocoding by Street Addresses, there are two modes for entering parameters, NORMAL and ADVANCED.
- NORMAL MODE is the default, which enables you to select a single column to be used for the street address.
- ADVANCED MODE enables you to enter free-form text. The Concatenate Street Addresses with Advanced Mode section of this guide describes how to use ADVANCED MODE.
- For the STREET ADDRESS parameter, select the
addresscolumn from your dataset. - Click the checkbox next to CITY and select the
citycolumn from your dataset. - Click the checkbox next to STATE and select the
statecolumn from your dataset. - Click the checkbox next to COUNTRY. Since this dataset does not have a country column, you can add a custom column by typing United States. Click to add it as the custom value.
<img src="/help/images/building-maps/geocode-street-addresses-into-point-geometries/custom_country.png" alt="Enter custom geocode value" />
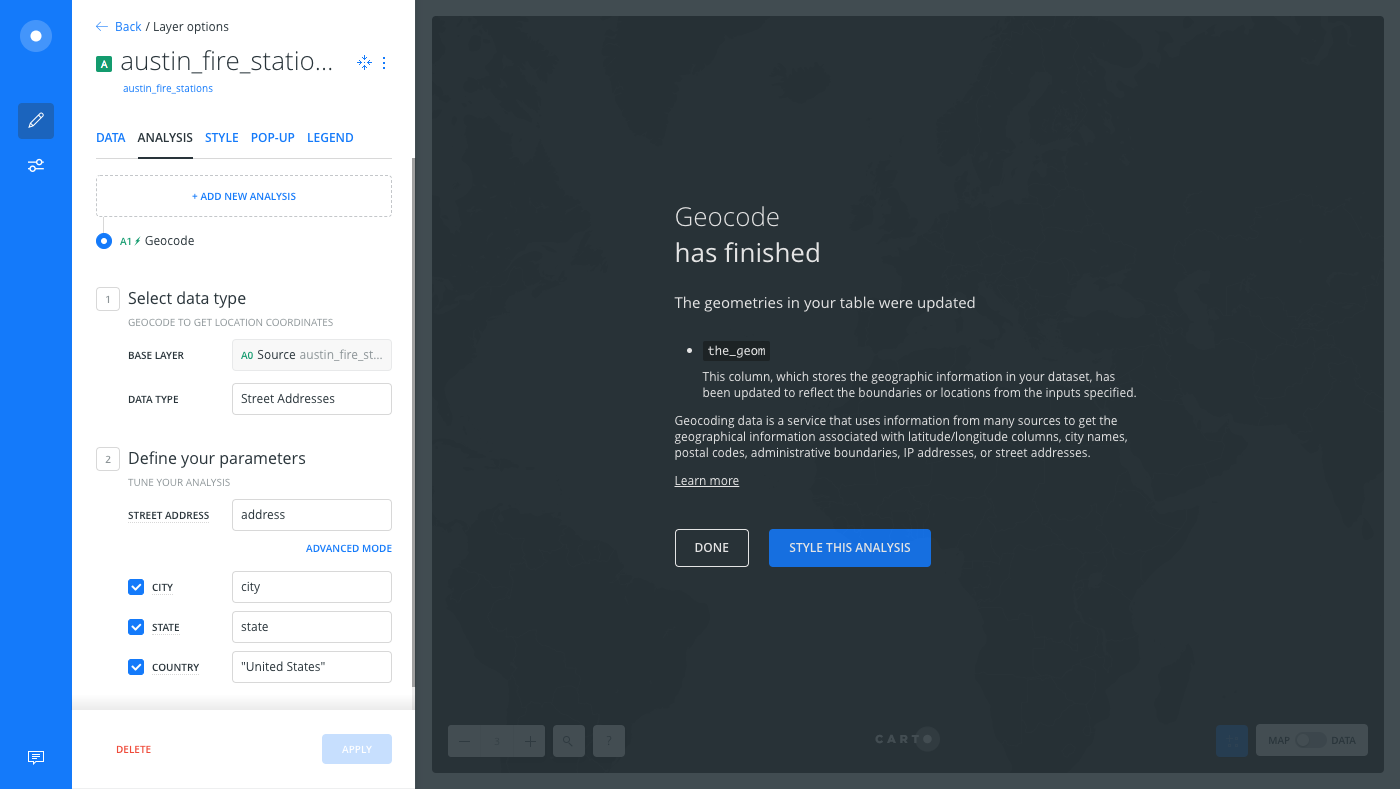
- Click CONFIRM to run the analysis.
-
Switch to the Data View to see how the specified street addresses were converted to points in
the_geomcolumn.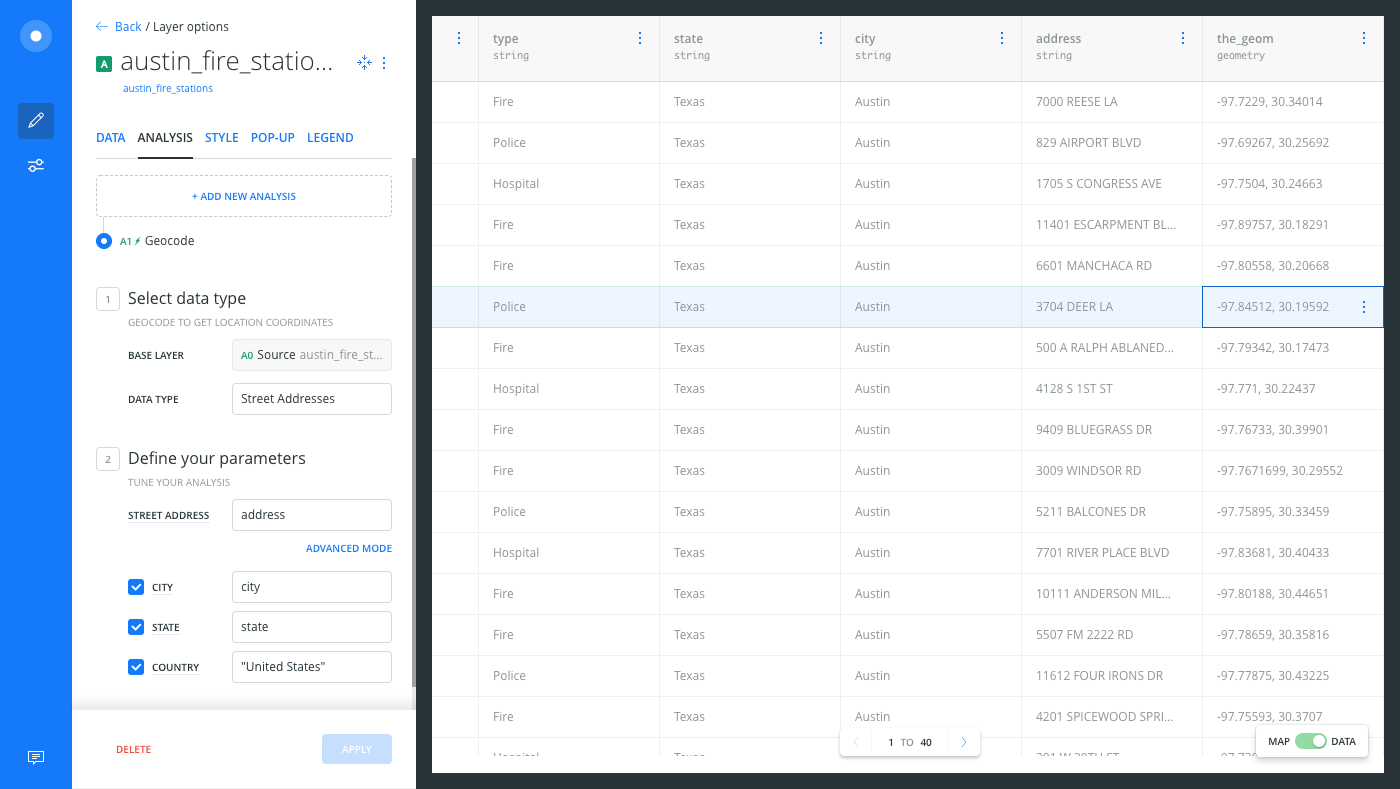
-
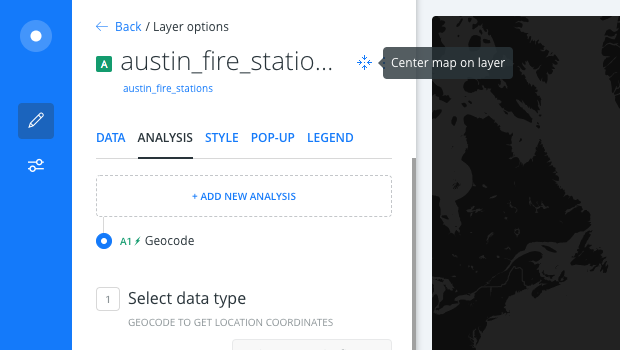
From the Map View, click Center map on layer (next to the layer name) to visualize the street data as points on your Map View.
Concatenate Street Addresses with Advanced Mode
In the example above, we were able to geocode street data in NORMAL MODE, since our map layer contained a complete street address in the address column.
If you have a dataset where street data is fragmented across multiple columns, you need to string together the street values in order to create a geometry. The street geocode option provides an ADVANCED MODE, which enables you to enter free-form text that concatenates street data from multiple columns into the_geom column.
This section describes how to geocode a map layer that contains fragmented street data.
-
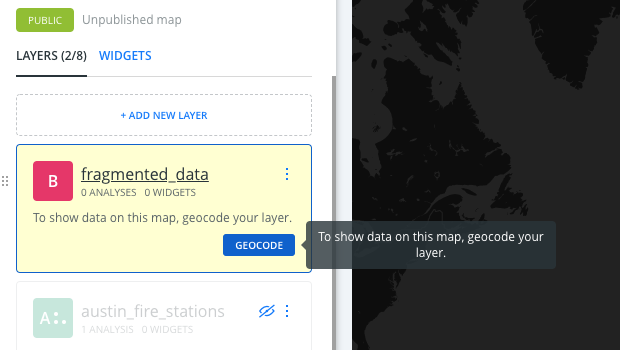
From the LAYERS list in Builder, hide the Austin Fire Stations layer.
-
Click ADD NEW LAYER and connect the
fragmented_data.csvdataset as a map layer.This file is provided from the “Download resources” of this guide.
-
Click the GEOCODE shortcut from the fragmented data layer.
If you switch to the Data View, you will notice that
the_geomcolumn contains null values. The actual street address values are fragmented across multiple columns;steet_no,street_name,street_type, andsteet_opt. -
Change the geocode TYPE to Street Addresses.
Once Street Addresses is selected, you are notified how many credits will be consumed from your account.
-
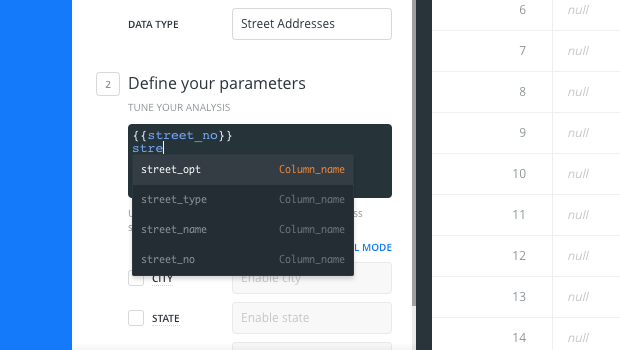
Apply the following ADVANCED MODE parameters:
- Click ADVANCED MODE to manually define the street address values.
An example of how columns should be formatted appears.
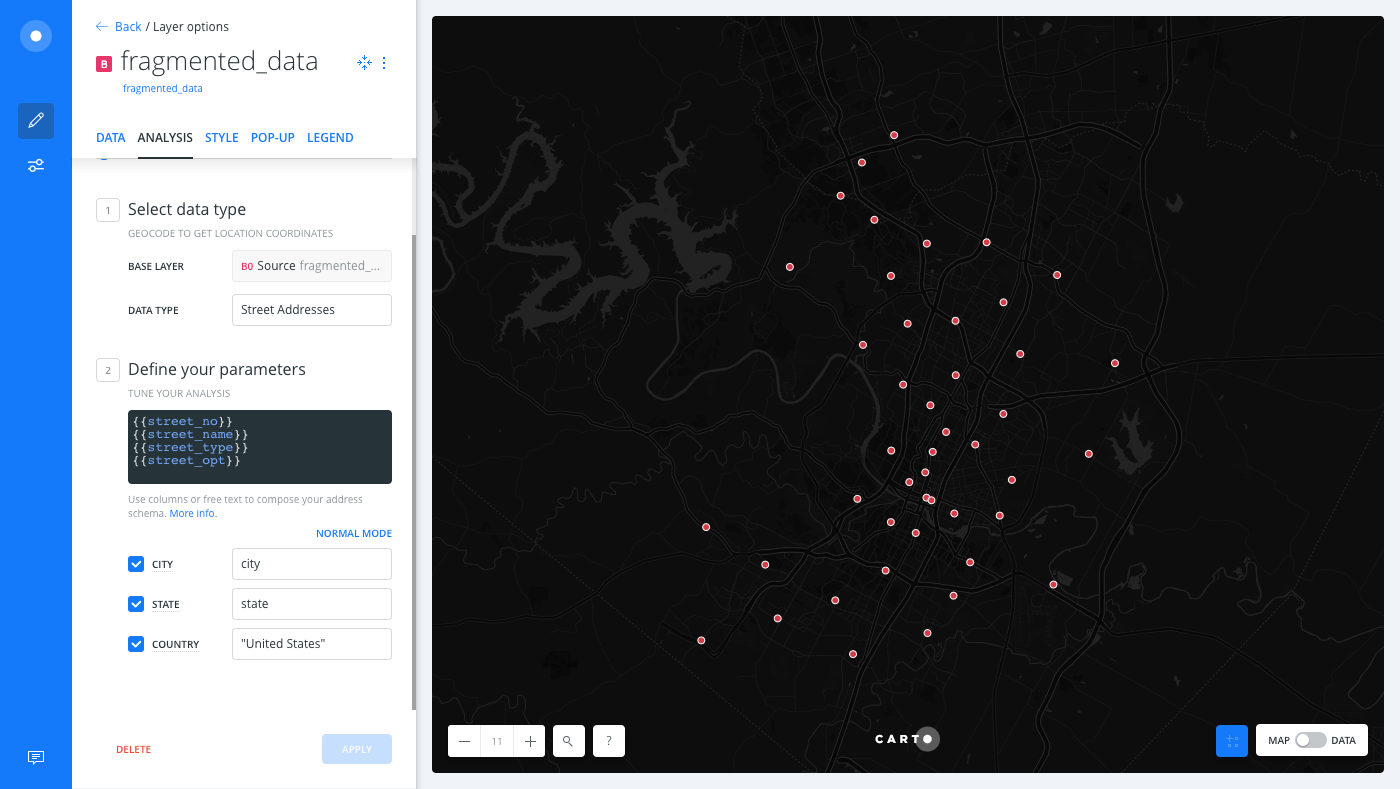
- Type free-form text by entering the four columns from your dataset that contain street data, as shown in the following example:
- Click the checkbox next to CITY and select the
citycolumn from your dataset. - Click the checkbox next to STATE and select the
statecolumn from your dataset. - Click the checkbox next to COUNTRY. Since this dataset does not have a country column, you can add a custom column by typing United States. Click to add it as the custom value.
- Click CONFIRM to run the analysis.
Street addresses appear as points on your visualization!
Download the final .carto file from the “Download resources” of this guide, and explore additional analysis and cartography applied. For example, apply the Filter by column value analysis as the next chain in the workflow to show only the fire stations on your map layer. Additionally, the layer was styled by image markers and contains POP-UP information windows.
External Resources
If you are using the Data Services API with CARTO Engine to manage your data, view the Street-Level Geocoder documentation.