How to Edit Geometries in Layers with Analyses Applied
Describes how to edit geometries in your CARTO dataset based on analysis results.
This guide describes how to edit geometries in your CARTO dataset, based on the results of an analysis. Drawing a shape on your map adds the geometry to your dataset, applies the map layer styling, and automatically recalculates the analysis!
For this example, you will draw additional data points for store locations, based on the results of an analysis that calculates the distance of Domino’s stores near MTA Subway stations in NYC. The calculated results include the Select points in polygon, and the Create Travel or Distance Buffers analyses as part of a chained workflow.
Add Points
Add new store locations to the existing dataset, and see if the results are within the subway buffers.
-
Import the template .carto file packaged from “Download resources” of this guide and create the map.
Click on “Download resources” from this guide to download the zip file to your local machine. Extract the zip file to view the .carto file(s) used for this guide.
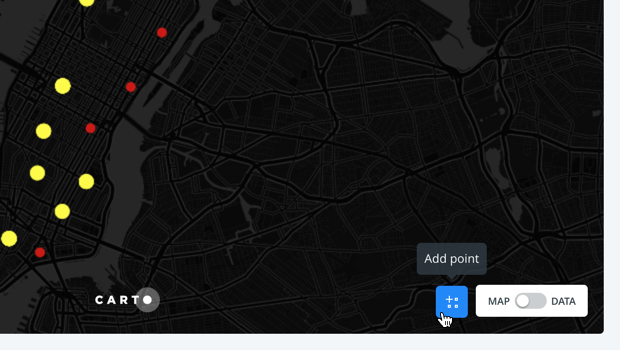
CARTO Builder displays three map layers; Dominos store locations (red dots), a hidden MTA Subway buffers layer, and the stores within the buffers (yellow dots). The number of Domino’s stores within a 200 meter buffer of subway entrances was queried. The stores are filtered into two categories - within the buffer (yellow) and outside the buffer (red).
-
From the Dominos Store Locations layer, click the point icon from the Map View. The edit point geometry and attributes appear.
-
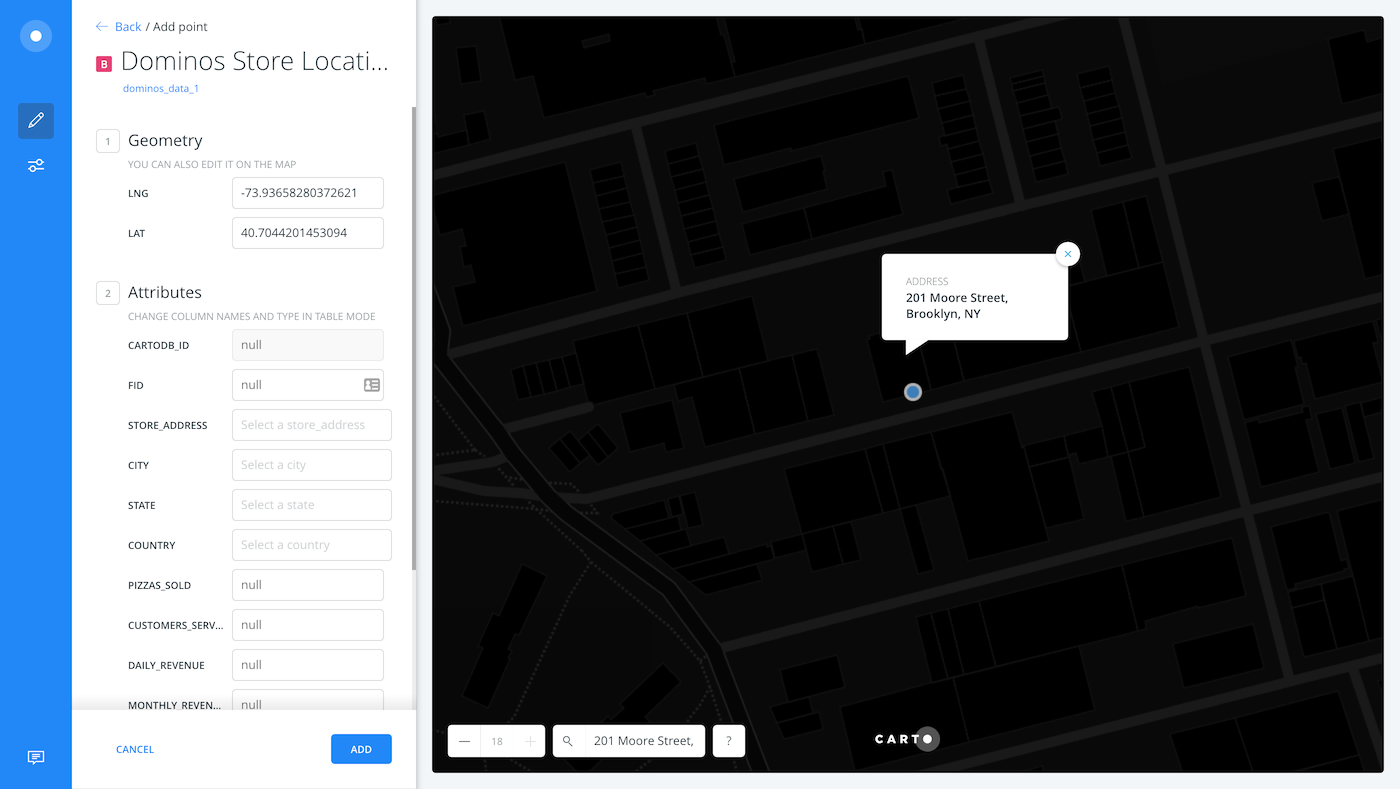
Click the search location magnifying glass from the Map View. This enables you to search for named locations and add points. Type 201 Moore Street, Brooklyn, NY and press Enter.
The map moves to the matched location and displays a marker. Click to add the point at the named location.
-
Typically, you would edit values for the new store point with the Geometry and Attributes options. In this case, you can keep the values blank, as the analysis will recalculate around the added point.
If you know the latitude and longitude coordinates, you can enter it directly in the LNG and LAT fields of the Geometry options. Additionally, once you are in edit mode, you can click and drag the point to modify the location, the latitude and longitude coordinates will update automatically.
-
Click ADD to create the point and continue the process. (Download the final .carto file from the “Download resources” of this guide, and explore the additional store points that we added in Williamsburg, Times Square, and Greenpoint).
Once all the points are added and you re-center the map, notice how the analysis automatically recalculates whenever a new point is added. The result appear as either a yellow dot to indicate that the point is within the subway buffer, or a red dot indicating the location is outside of the defined buffer.
Try adding more points and see how the analysis recalculates. You can also add a new, empty layer and create your own point, polygon or line dataset from scratch.