Point in Polygon
Describes how to select points from a second dataset that intersect a polygon layer, using CARTO Builder.
When your map contains several layers with multiple geometries, the Select Points in Polygons analysis is a simple method of viewing points that fall within a polygon, without having to apply any other aggregation option.
If you are interested in choosing the aggregation method for transforming geometries into polygons, use the Create Polygons from Points analysis instead.
This analysis performs a spatial intersection on the polygon layer. The filtered results display only the rows that intersect with the target layer, as points.
For this guide, apply the Select Points in Polygons analysis to view customer locations within the areas of influence, using the provided Sales Territories (Portland) Demo map.
Visualize Boundaries Around Groups of Customers
Create the map used for identifying sales territories around groups of customers in the Portland, Oregon area.
-
Import the template .carto file packaged from “Download resources” of this guide and create the map.
Click on “Download resources” from this guide to download the zip file to your local machine. Extract the zip file to view the .carto file(s) used for this guide.
Builder opens with Customer Locations as the first map layer, Centroids as the second map layer, and Areas of Influence as the third map layer.
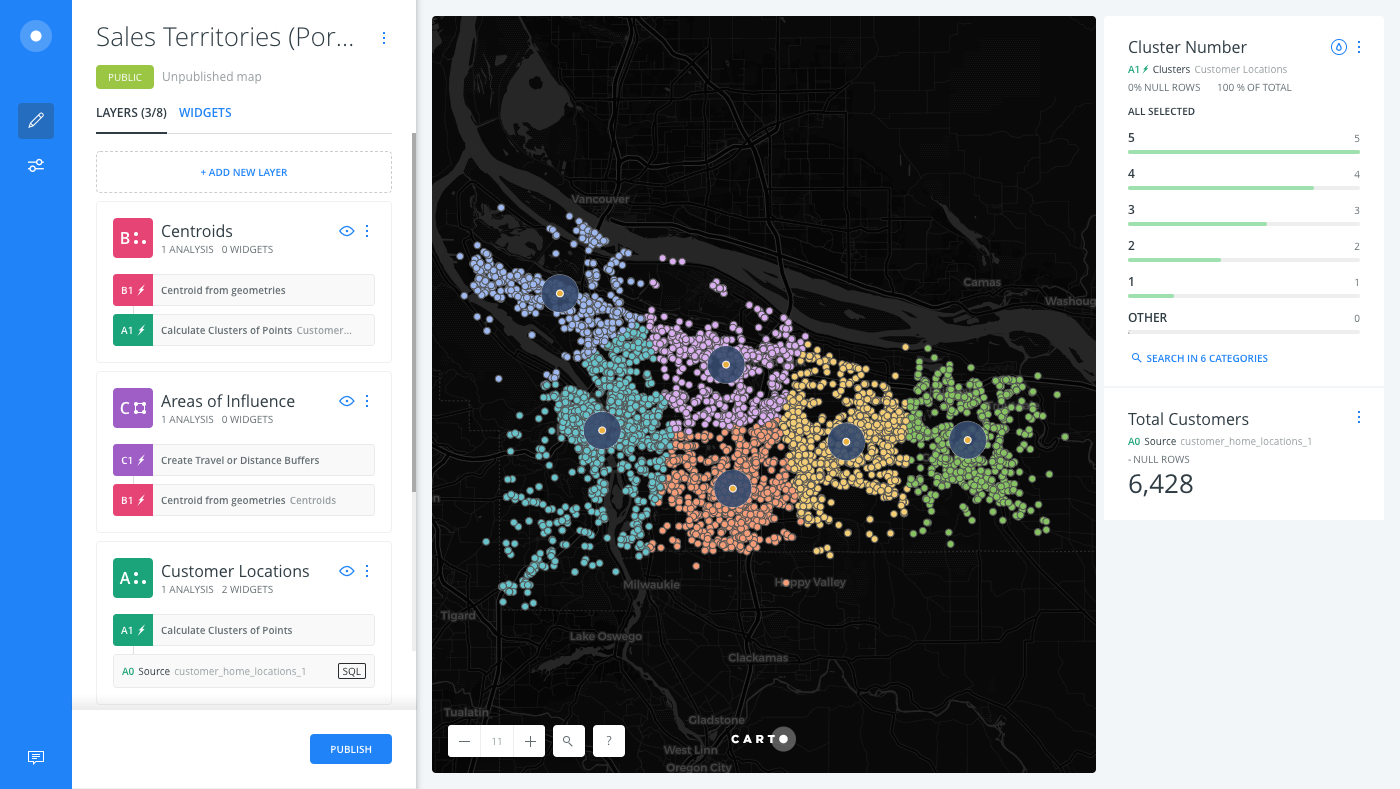
If this map looks familiar, this is an enhanced version of the map created in the Calculate Clusters of Points guide, which calculated clusters of points to determine store locations.
The Areas of Influence layer displays the boundaries around the identified customer locations, which appears as polygon data. We will use this layer to filter points of customer locations within the area of influence.
-
Switch to the Data View of the map layer to visualize how the areas of influence appears as polygon data.
The Data View and Map View appear as buttons on your map visualization when a map layer is selected. Click to switch between viewing your connected dataset as a table, or show the map view of your data.

Filter Customer Locations within the Area of Influence
Apply the Select Points in Polygons analysis as the next chain in the workflow for the Areas of Influence layer.
-
From the LAYERS list, click the Areas of Influence layer.
-
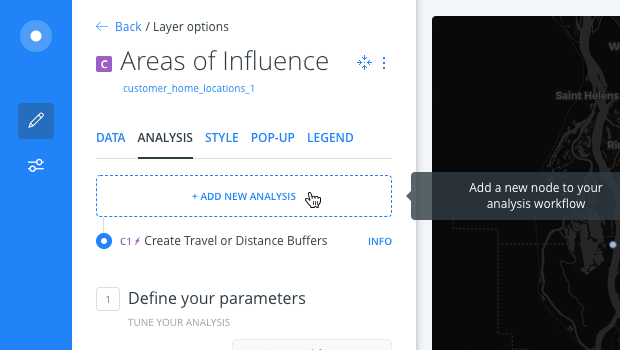
Click the ANALYSIS tab.
-
Click on ADD NEW ANALYSIS to add a second analysis to the chain.
-
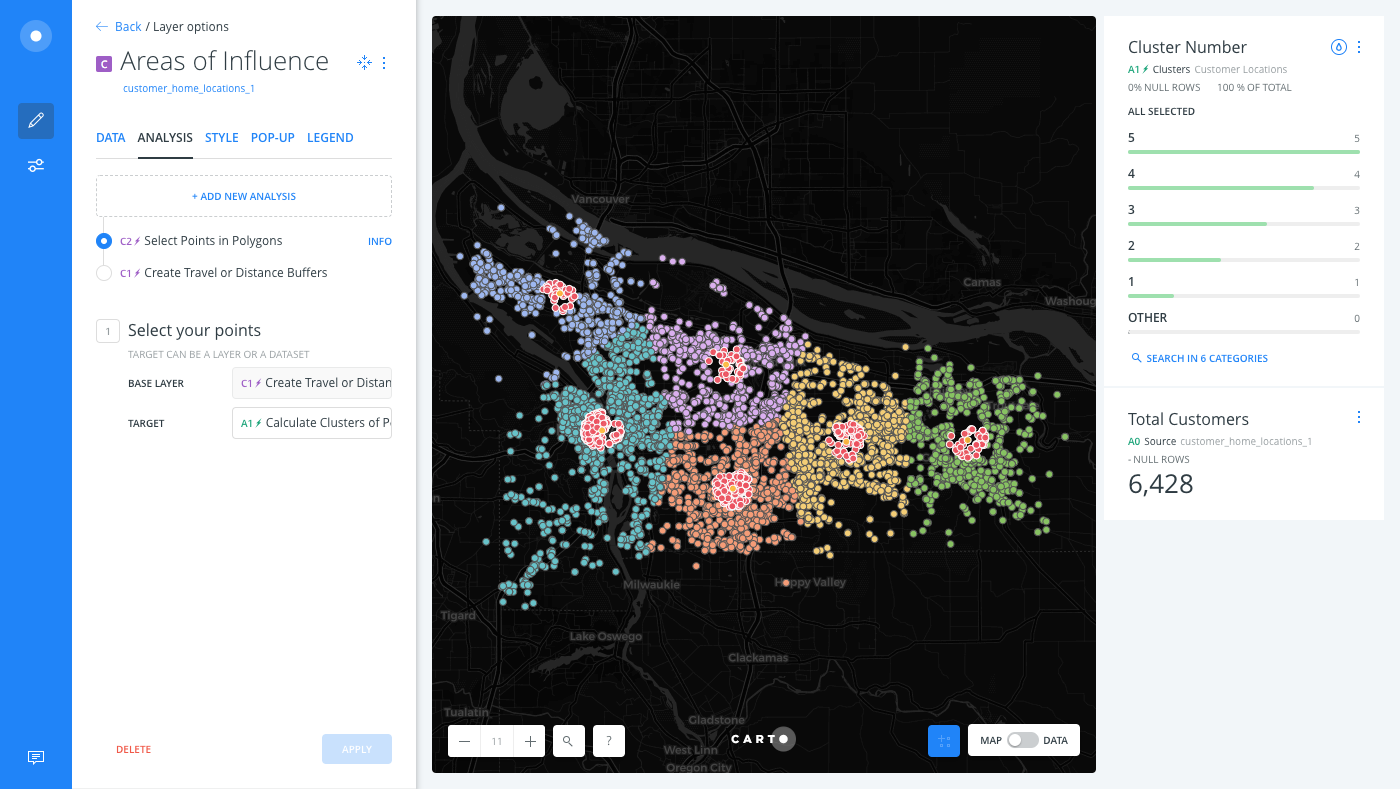
Select Select Points in Polygons as the analysis.
Select Points in Polygons should only be applied to a map layer containing polygon geometries.
-
For the TARGET, select the
A1 Calculate Clusters of Pointsnode of data.A1 Calculate Clusters of Pointsis the result of the calculated clusters of points analysis that was applied to the original source of data (Customer Locations). View the Understanding Map Layers guide for more details about how to work with map layers in Builder. -
Click APPLY.
The result transforms the polygon areas of interest into points, around the group of customers.
-
Switch to the Data View of the map layer to see how your polygon data was changed.