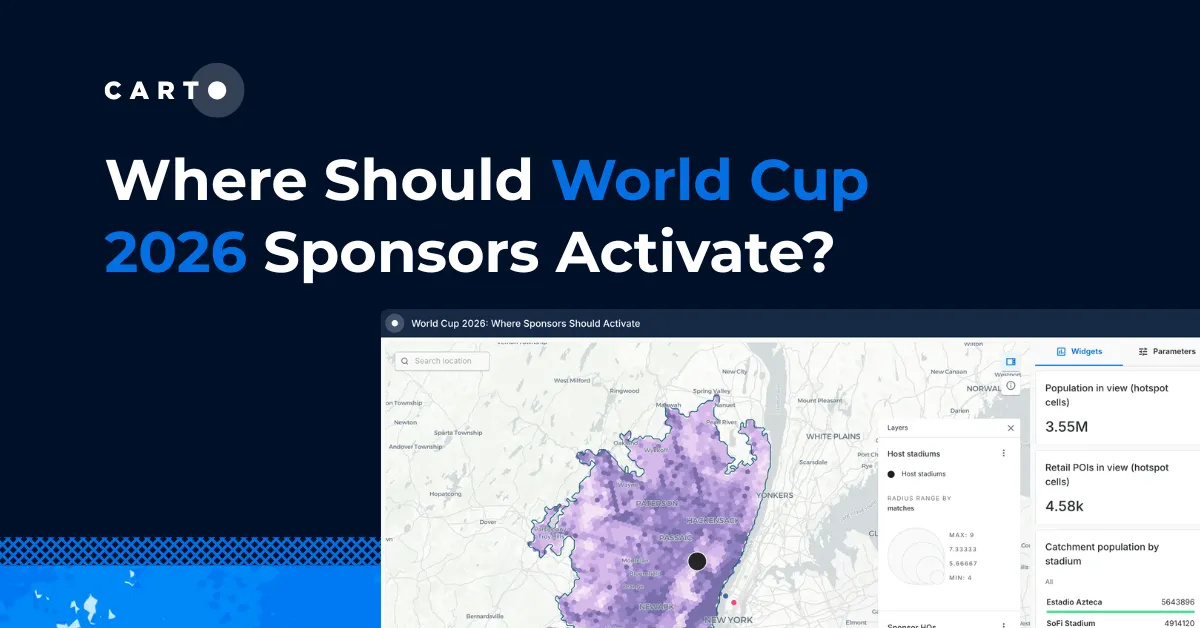
A Better Approach to Sales Territory Management Using Spatial Clustering


Successfully managing sales territories is not an easy task but the consequences of doing it poorly are severe: higher overhead (the average business trip costs $2 600) lower employee retention decreased productivity and piecemeal inconsistent customer service.
Despite these drawbacks though we discovered in a recent CARTO webinar that only 10 percent of participants have a fully automated and integrated process for managing their sales territories and over 40 percent have no internal process at all.
Many sales teams carve out their territories based on arbitrary antiquated systems (like zip codes) instead of using data intelligence to increase business growth and productivity.
Create Sales Territories That Make Sense
In the example below we plotted 461 Fortune 500 companies on a map with three pieces of publicly available data: their revenue profit and number of employees.
Using a spatially constrained clustering analysis (called SKATER) we created 10 distinct groups of customers taking into account the metrics as well as the headquarters location of the location of the Fortune 500 companies' headquarters.
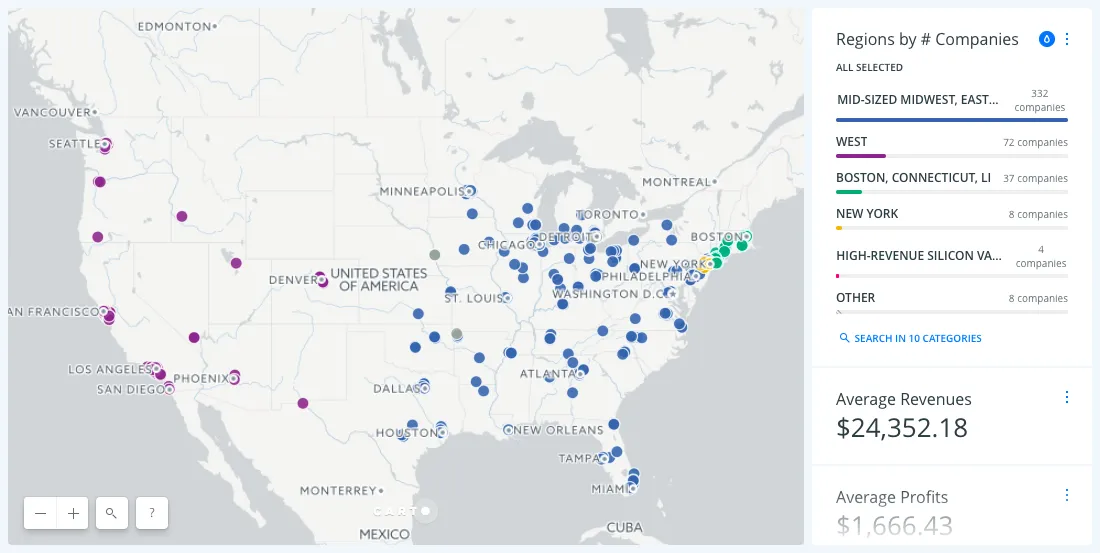
You may be wondering: “But these segments don’t have the same # of target accounts in them isn’t that unfair?”
The opposite is true. It would be blatanly unfair to balance sales territories by the # of opportunities within them without taking into account any other criteria like revenue or size or to carve out territories based on arbitrary geographic boundaries. Remember not all opportunities are created equal.
By clustering these accounts based on multiple criteria including but not exclusively limited to location we get a better sense of the different types of customers or prospects this sales team needs to handle.
Staff Your Sales Team Appropriately
Using those three simple metrics (profit revenue and number of employees) also shows us a few outliers in our portfolio. While most of our companies are mid-sized and in the Midwest East and South 15% are in the West where it isn't immediately obvious how to segment the sales territories as seen below in a map of the San Francisco / San Jose region.
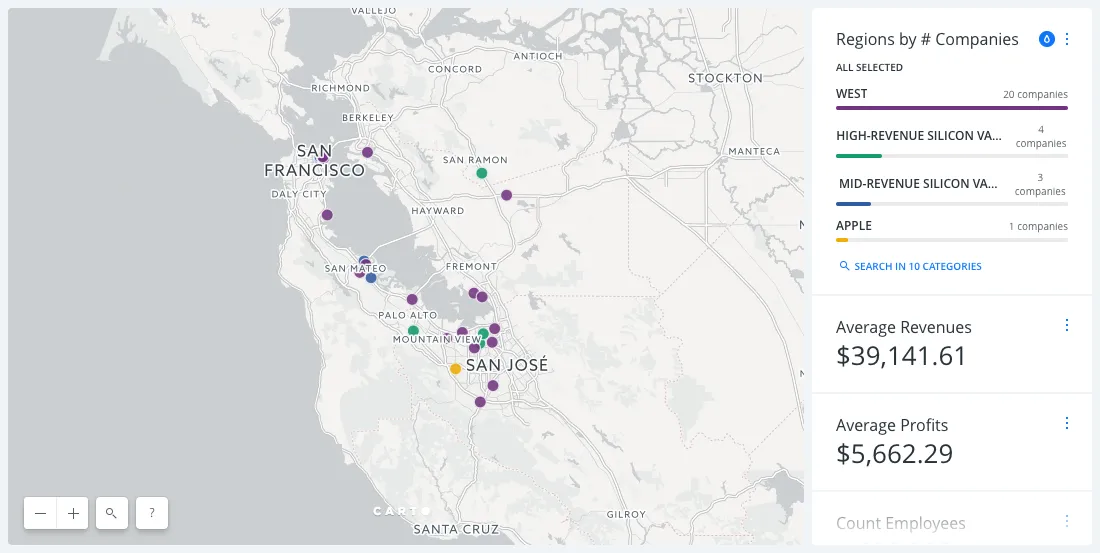
Santa Clara has two high-revenue companies (the green dots) Fremont has only two medium-sized companies (the blue dots) and San Paleo has the crown jewel of any portfolio: Apple (the yellow dot). Assigning reps based on geography would be more or less arbitrary leaving one scrambling from meeting to meeting and another twiddling her thumbs at her desk.
If you were the sales director for a sales team with this certain group of target accounts you might experiment with assigning one rep to Apple one to mid-revenue companies one to high-revenue companies and one to the more general “West” companies.
Even looking at only three high-level metrics it's clear that our hypothetical sales team would need a more sophisticated and efficient way to tackle this region which is exactly what data visualization offers. Your sales team might want to incorporate more data into this visualization like industry or competitor data.
Determine the Best Location for a New Sales Office
Knowing where — and if — to open a new office is a difficult and costly decision. With data visualization though you can immediately see how the addition would affect nearby sales territories. With those Fortune 500 companies visualized we added hypothetical regional offices (the dark blue dots) to manage those accounts (the end of the aqua blue lines).
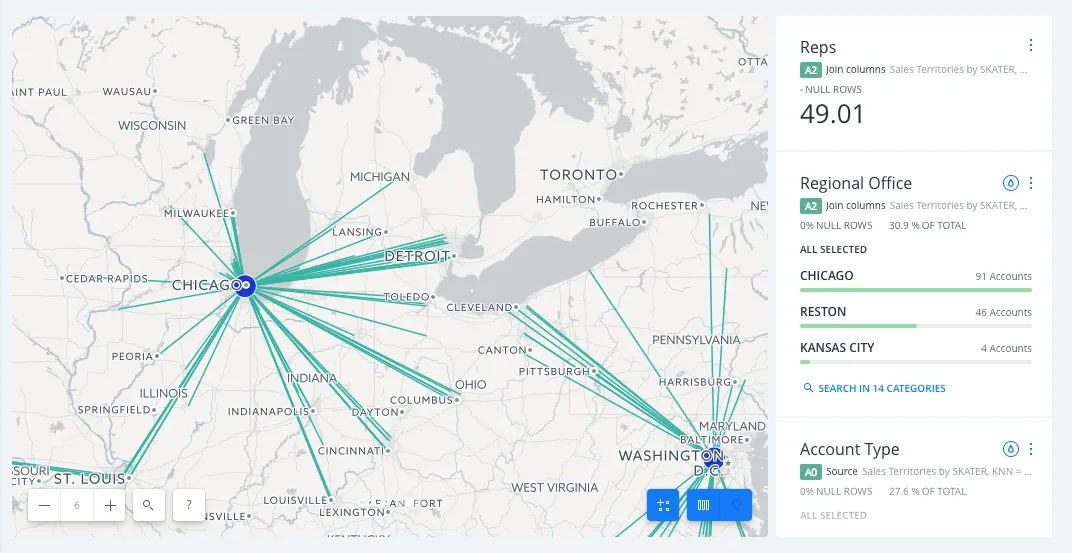
In the map below we have several accounts in Detroit but our reps are constantly having to travel there from Chicago so we're considering adding a new office. But how would that affect the territories adjacent to Detroit? Spatially speaking what would be the smartest way to distribute clients with this new regional hub?
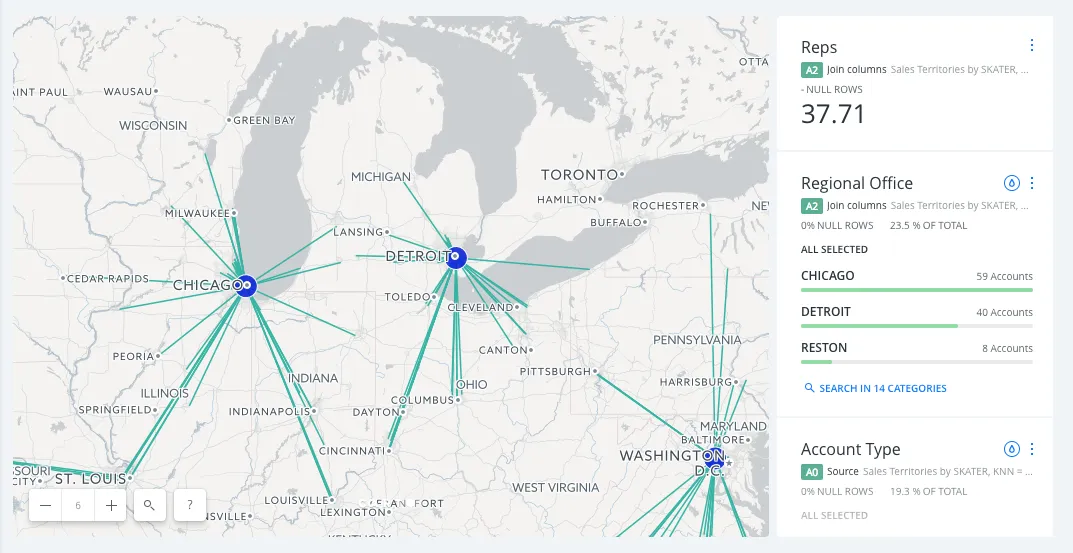
Using CARTO we can easily add that regional office and the software automatically recalibrates showing us that the Chicago office would still retain some properties in Michigan while those in Cincinnati Columbus and Dayton would go to the Detroit office.
Insights like this are why our customers have seen their sales growth increase by 22% when they use CARTO for territory management.
Revolutionizing Territory Management with LI
Find out what a difference an interactive data visualization can make when realigning sales territories
You Can Go Deeper
Per month our customers have seen a 9 percent increase in the number of clients visited and a 13 percent increase in the number of appointments made. But seeing positive gains also depends on using the right data.
Average revenue average profits and the number of employees may not be the best metrics on which to build a sales segmentation strategy.
Most companies have mountains of data in their CRM such as the number of leads gathered or the amount of money already earned from the company. Using that data they can create significantly richer sales segments.