CARTO Spatial Features, now with global urbanity, climatology, & elevation data

In late 2020 we released our first derivative data product CARTO Spatial Features providing global demographic data and Point of Interest (POI) aggregations by category. Since launch and following our commitment to increase the efficiency of Data Science teams we have delivered this data product in a common geographic support the Quadkey grid and in two different resolution levels; aiming to drastically reduce the amount of time our users need to spend in preparing data to include it in their spatial models.
Today we are pleased to announce the release of a new version of CARTO Spatial Features including new variables for urbanity level elevation and climatology. With this release we are also supporting a new geographic support system the H3 grid. With this new version of the dataset data scientists can further increase the level of location-based context that they bring to their spatial models and are able to characterize with greater detail the effects that different locations have on their business performance metrics.
Global Urbanity Model
Earlier this year we published a case study about how we developed a spatial model to classify global urbanity levels. The results of this model are now available as a new variable within the Spatial Features dataset.
Urban areas are rapidly changing influencing our living habits such as the way we shop and commute to work. This new feature paired with demographics and POI aggregations that were already available increases the ability of Spatial Features to model on a micro level the different characteristics of an area. This can inform decision-makers in sectors such as urban planning CPG Retail and Real Estate on how to plan and adapt their business strategies in their different markets.
This urbanity classification has been built synthesizing information regarding how population density and urban infrastructure (roads lights) vary across a country. The classification is performed at the country level to account for the fact that from country to country the structure of urban areas varies considerably.
Global Digital Elevation Model
Another feature we have now included in the dataset is the average elevation within each cell of the grid. For that we have leveraged the "Advanced Spaceborne Thermal Emission and Reflection Radiometer (ASTER)" Global Digital Elevation data from NASA specifically version 3 released in August 2019 (i.e. GDEM V3). Originally in a resolution of 30-meters, we have vectorized and aggregated the data in order to be able to deliver it on the same common geographical support systems as the rest of features in the dataset.
Spatial Features is meant to facilitate the inclusion of the location context in data science models; the inclusion of elevation as a feature in those models would allow scientists to account for changing patterns related to environmental factors affected by the height above sea level.
Elevation data derived from the NASDEM model
Climatology features
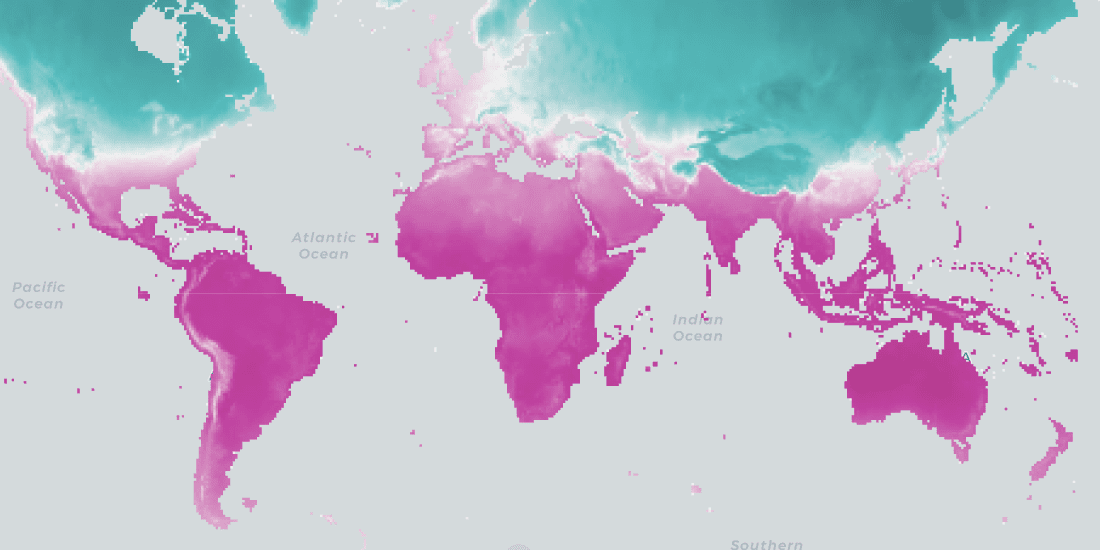
We have also included in this new version of Spatial Features global climate data based on monthly averages; in order to be able to capture the effects of the changing climate across location and over the seasons in a year. For that we have processed the WorldClim database of high resolution global weather and climate data. Released in 2020 WorldClim provides climatology features aggregated across a target temporal range of 30 years between 1970-2000. We have included in Spatial Features monthly average minimum and maximum temperatures precipitation solar radiation wind speeds and vapor pressure.
Average temperatures in the month of January
Now also available on an H3 grid
The open source project H3 is a hexagonal hierarchical geospatial indexing system that also works as a standard geographical support to aggregate and analyze spatial data globally in an scalable way enabling extremely performant spatial operations. Originally developed by Uber H3 supports sixteen resolutions each of them composed of cells with one-seventh the area of the lower resolution containing cell. One of the most powerful properties of H3 is that all neighboring hexagons of a particular cell are at an equal distance which enables fast computation of distances between hexagons and neighboring areas. To start with we have chosen to curate CARTO Spatial features based on H3 resolution 8, with an average hexagon edge length of 0.461 km.
Population across Italy in an H3 grid
Start using this data today
This new version of Spatial Features is already available as a premium dataset in CARTO’s Data Observatory. Additionally in order to encourage innovation and gain valuable feedback on this new product we are offering CARTO Spatial Features for the United States United Kingdom and Spain in the Quadgrid 15 and H3 formats as public datasets which can be accessed free of charge with a CARTO Enterprise account.


.png)

.jpg)
.png)


.jpg)
.png)
