Tackling Customer Churn for Utilities with Spatial Modeling


Utilities industry players are finding themselves under unprecedented pressure due to rising customer churn and increasing competition. Both global market deregulation and the significant digital transformation that the sector is experiencing are behind this effect.
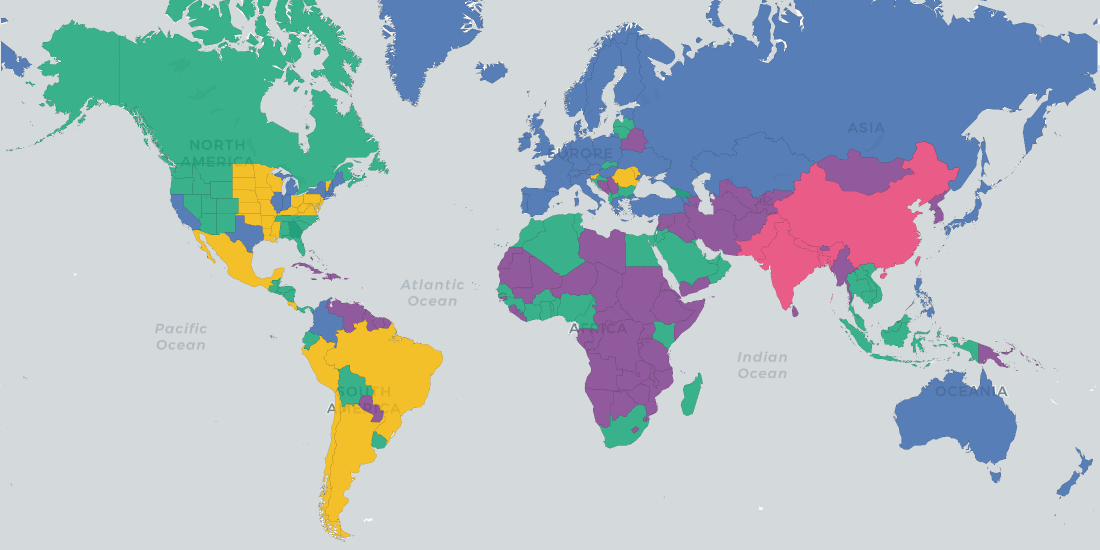
Map 1. Map of the status of electricity market liberalization. Note some Canadian provinces may have more liberalized markets.
According to various sources nearly 15% of domestic customers switch suppliers every year in the US and the EU with countries like Portugal and Ireland having the highest rates of switching electricity and energy suppliers in Europe. [1 2]
Map 2. Electricity Churn Rate 2014
{% include icons/icon-bookmark.svg %} Discover the State of Spatial Data Science in 2020
Analytical Challenge: Spatial Data Science
Several studies have shown that acquiring new customers can be from 5 to 25 times more expensive than retaining an existing one depending on the industry. This makes it imperative for companies in the utilities sector to take action towards improving customer retention strategies and it is leading these companies to focus on customer experience with personalized actions depending on each customer's profile. The use of Data Science is key to understanding what drives churn in a company identifying future churners and determining what targeted actions should be taken at the client level.
In addition in the utilities sector it is common to find peaks of churn in neighboring areas which are nearly always due to a combination of targeted campaigns from competitors and word-of-mouth between neighbors. Capturing this behavior in time can make a big difference in the number of customers churning. Standard Data Science techniques fall short in capturing these spatial patterns which is where Spatial Data Science comes in.
CARTO Experience with EDP
Last year CARTO participated in the third edition of the Free Electrons Program a program in which startups work alongside energy companies from around the globe to deliver cutting edge solutions and to co-create the future of the energy sector. In particular CARTO worked together with EDP Portugal to build a spatial predictive model to help them understand the drivers of churn in their company and to allow them to predict future churners.
The focus of our work was to verify how a customer's location and surrounding context affects their churn propensity. The resulting model can predict which customers are likely to churn during the following month with a recall of 70% which translates into correctly identifying more than two thirds of all potential churners. In addition the model can answer questions like: If there has been an increase in the churn rate in a neighborhood in the last few weeks/months are customers who live in that same neighborhood more likely to churn or is their behavior independent of that of their neighbors?
A key point for building this predictive model was the enrichment of EDP's data with demographic and socioeconomic data to describe each customer's neighboring context. For this we took advantage of the location data streams available in CARTO's Data Observatory and the enrichment toolkits available in CARTOframes so that we could easily bring in features of a socio-demographic and socio-economic nature.
We enriched EDP's data with 3rd party features aggregated at the 4-digit postal code level. These features included information such as population number of households population by age range and average household purchasing power.
Map 3. Sociodemographic data used to enrich initial data
The work we carried out at CARTO to build this model also allowed us to discover interesting insights regarding the EDP's customer churn patterns. Some examples of our findings include:
- Higher churn rates in urban areas
- Impact of vacation homes: Areas with a high density of vacation homes show different churn patterns from the rest of the country
- The neighborhood effect in churn patterns: Changes in the churn rate of a customer's neighbors or in their average customer lifetime have an effect on the customer's propensity to churn.
As a result we identified that churn has a non-stationary spatial behavior. Because of this the predictive model has a spatial-dependent performance as can be seen in the map below.
Map 4. This map shows the performance (using recall as our reference metric) of the predictive model built at CARTO by zip code.
We verified that building region-specific models is a good alternative for regions with a high density of vacation homes. In particular in the region of The Algarve we improved the model's performance by 10 percentage points by building a specific model for that region.
Spatial Model in Use
In addition to the insights discovered at the postal code level the model predicts which customers are likely to churn in the following month allowing EDP to take personalized actions to retain those particular customers.
For every customer the model provides the propensity of churning and the key attributes that help the model identify that customer as a potential churner or non-churner. For example as illustrated below we have a customer that has been identified as a churner and the two main reasons for this are:
- Customer lives in a neighborhood with a positive churning trend in the last 6 months
- Customer does not have direct debit payment
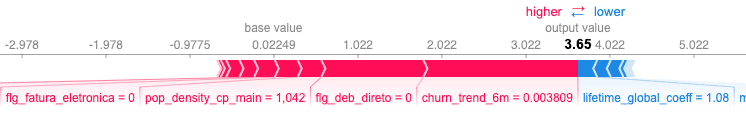
Figure 1. Customer churn score explained
In order to put a predictive model like this into production so that it can generate value in the day-to-day operations of a utility company it can be integrated into that company's CRM platform such as Salesforce. The churn propensity score and the main factors of risk can be made visible as information linked to every customer so account managers and customer care teams can take personalized actions to retain each customer before it's too late.
Conclusion
The utilities sector is experiencing an increase in customer churn. This makes it crucial for companies in the sector to take action to improve customer retention strategies. Spatial Data Science techniques help identify potential churners and the reasons for churning so that personalized actions can be taken to increase the retention rate.
A predictive model with a recall of 70% like the one built for EDP could translate into millions in revenue retention. For example for a utility company with 2M clients and an annual churn rate of 15% (i.e. 300k churners per year) this model will allow the company to correctly identify 210k churners. Assuming targeted commercial campaigns have a conservative 5% success rate we could retain 10.5k churners yearly. Assuming an average annual electricity bill of $1300 this would mean retaining more than $10M in annual revenue.
References
- "Energy Deregulation Around the World: A Comprehensive Guide" Electric Choice https://www.electricchoice.com/blog/energy-deregulation-world/
- "The Digital Utility: New challenges capabilities and opportunities" McKinsey June 2018 https://www.mckinsey.com/~/media/McKinsey/Industries/Electric%20Power%20and%20Natural%20Gas/Our%20Insights/The%20Digital%20Utility/The%20Digital%20Utility.ashx