Fedor Baart: The Science of Escape from Alcatraz


With this third installment of our [Developer Interview] series we welcome Fedor Baart to join the discussion about how scientists and developers using CartoDB for research and geospatial science!
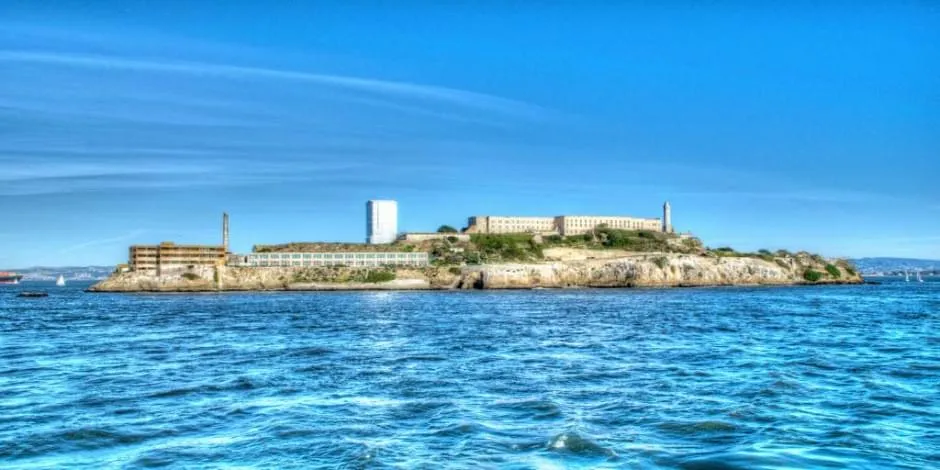
Recently Fedor and his team used cartoDB to create a water current simulation to determine if the infamous 1962 Alcatraz escapees could have survived. Using currents data from the appropriate date and time and releasing 50 virtual boats from various possible launching locations on the island every 30 minutes. Over half a century after the escape they determined that survival for the men was possible - If they set sail between 11 PM and midnight. Check out the Washington Post article here!
Fedor is a specialist in computer simulations at Deltares an independent institute for applied research in the field of water subsurface and infrastructure.
What are your CartoDB powered projects?
This was my first project where I used CartoDB. I had tried CartoDB and advised it to some of my colleagues because it's very easy to generate a beautiful annotated map based on your own data.
I normally create very custom maps. We have developed a cloud based platform for running interactive hydrodynamic computer simulations. There I use technologies like:
- Websockets to communicate model results directly to the browser and back.
- SVG to render particles using stroke patterns along fixed lines
Why did you choose CartoDB for your geospatial projects?
For the Alcatraz animation I thought I'd try CartoDB. I had seen how nice the visuals can be when using the torque framework and wanted to reproduce that. CartoDB uses several visual effects that make particles floating around very attractive.
For example when particles swarm together in a tight location they are hard to separate. A common technique is to use transparency to give a sense of density. With CartoDB you can use opacity but also make particles light up if the opacity is not enough to show the range in density. That gives a nice high tech look to the animation similar to throwing glow sticks in the water .
What as a developer do you value most about CartoDB?
What I really like as a researcher is that I can share the animation and the corresponding dataset. Open data is very important in research. It allows others to check your work and continue upon your research.
Deltares where I work is an open source institute so we tend to prefer to work with open source software. When I see something missing or broken in the software I can easily add or fix it and contribute it back. With commercial software you often have to wait for weeks or months for things to get fixed. That allows you to continue working and not having to work around things.
If you would have to explain to a fellow developer what CartoDB's best feature is what would it be?
I was impressed by the performance of CartoDB. Together with the other researchers [Olivier Hoes] and Rolf Hut we presented our results for national television at the eScience Center video wall which is a 8k resolution 5x2m screen.
The framerate hardly dropped. I don't think that that would have been possible a few years ago.
Thank you Fedor and Deltares for a fantastic interview an amazing map and for taking the time to share your experiences. If you are a geospatial developer interested in a modern platform to develop on take a look at this intro presentation: [CartoDB for Developers].
If you are already developing geospatial products using CartoDB take a look at our Developers Program and stay tuned for more developer interviews. And if you'd like to share your experiences please write to stories@cartodb.com.
Happy Mapping!