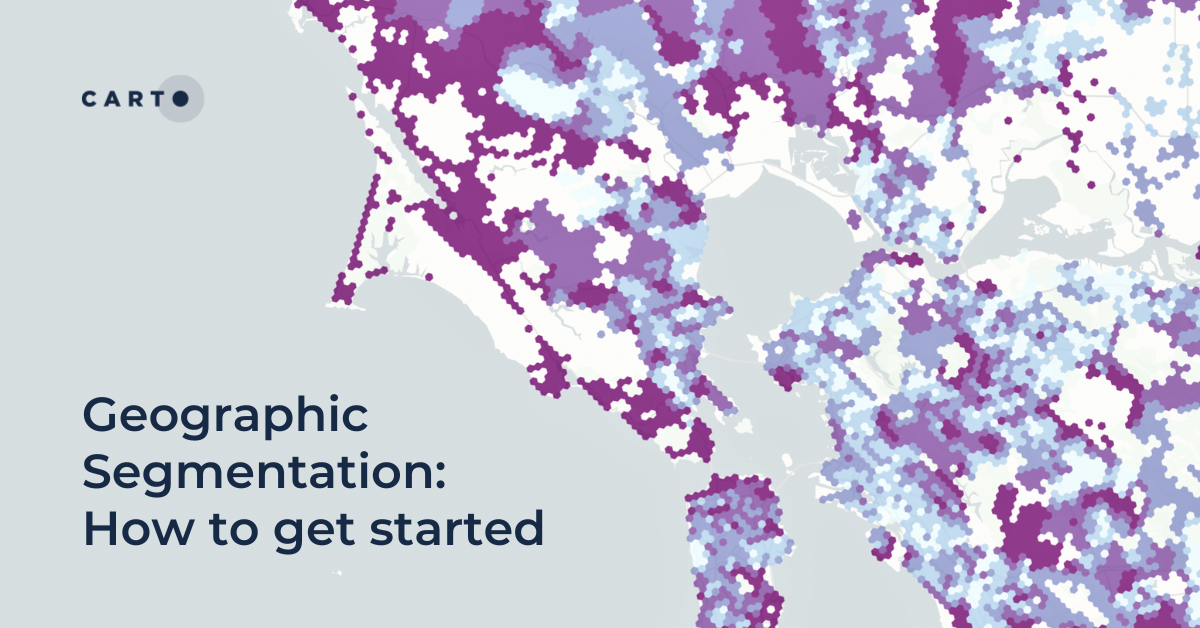
Geographic Segmentation: How to get started


There was a time when analysis of demographic data involved simply looking at the population in its entirety. Organizations would make decisions - such as where to concentrate risk mitigation measures or place a logistics center - based purely on the number of people in a location. Perhaps they would break this down by exploring broad demographic characteristics such as age, gender or occupation.
However, for many organizations, this level of demographic segmentation isn’t sufficient.
Take - for example - a Telco company looking to reduce churn by targeting network improvements. They could target improvements in areas with a large number of customers. The problem? Many customers in these areas may never have considered churning, and the organization would therefore be wasting resources for a low return on investment.
An alternative approach would be to identify the characteristics of a “typical” customer likely to churn, such as through demographic, spending and behavioral data. The organization could find spatial hotspots of these at-risk customers, and pinpoint improvements in these locations.
This is known as Market Segmentation, and the spatial analysis of this is called Geographic Segmentation.
Above: Explore the different Consumer Profiles (source: Michael Bauer International) across New South Wales.
Typically, Geographic Segmentation works through understanding to what degree people in an area fulfill the characteristics of a particular group or segment. This allows analysts to make more precise decisions, rather than taking a one-size-fits-all approach. They can tailor their services, products and marketing to meet the specific demands of each geographic segment, resulting in a greater return on investment and lower risk.
Above: Explore Experian’s Worldview Consumer Segments data; specifically the spatial distribution of Segment A: City Advantage.
Let’s illustrate with an example! The map below leverages our data partner Spatial.ai’s Proximity dataset - available for subscription via our Spatial Data Catalog. This dataset aggregates and classifies experiences, personalities and feelings shared over social media platforms, such as Twitter, Instagram and Meetup, and scores areas by how much they fulfill the criteria of different segments.
In this example, the mapped segment is called “Wanderlust,” defined as:
So, how could analysts benefit from knowing where “Wanderlust” travel-enthusiast types can be found? For a telco company, for example, targeted marketing of products such as international roaming offers in Wanderlust hotspots would likely result in a high return on investment.
Sounds useful - but not sure how to start? We have the tutorial for you! In the following section, we’ll run through an easy, step-by-step guide on how to get started with geographic segmentation. This tutorial is a great “jumping off point,” that you can easily adapt for various use cases and geographies. This tutorial should be fairly straightforward to follow and is ideal for people new to geospatial or CARTO!
All of the data we’ll be using is freely accessible from our Spatial Data Catalog - all you’ll need to follow along is a CARTO account! Don’t have one? Sign up for our free 14-day trial here!
In this tutorial, we’ll be using a dataset called the New American Atlas, produced by our data partners the Consumer Data Research Centre. This is a fully open geodemographic classification of the USA, in which every Census Tract is assigned to one of 55 types and 10 broader groups such as “Wealthy Urbanites.” This classification is based on a range of input variables such as age distribution, housing type and commuter patterns (read more here).
So, how can we use this data? Let’s imagine we want to distribute a new product or service - say a family plan for our mobile network. We can use this data to understand where our target market lives, and plan a distribution and geomarketing campaignaccordingly.
First thing’s first - let’s get the data! Head to the Data Observatory tab in the CARTO Workspace and search for “New American Atlas - United States of America (Census Tract).” Found it? Hit Subscribe - it’s as easy as that!

There are many ways you can leverage Geographic Segmentation data for your use case - in this tutorial, we will assign a score from 0-1 to each group in the New American Atlas based on how ideal a target they are for our new family mobile network plan. Remember you can adapt this weighting to the groups (or even specific types) more appropriate to your use case.
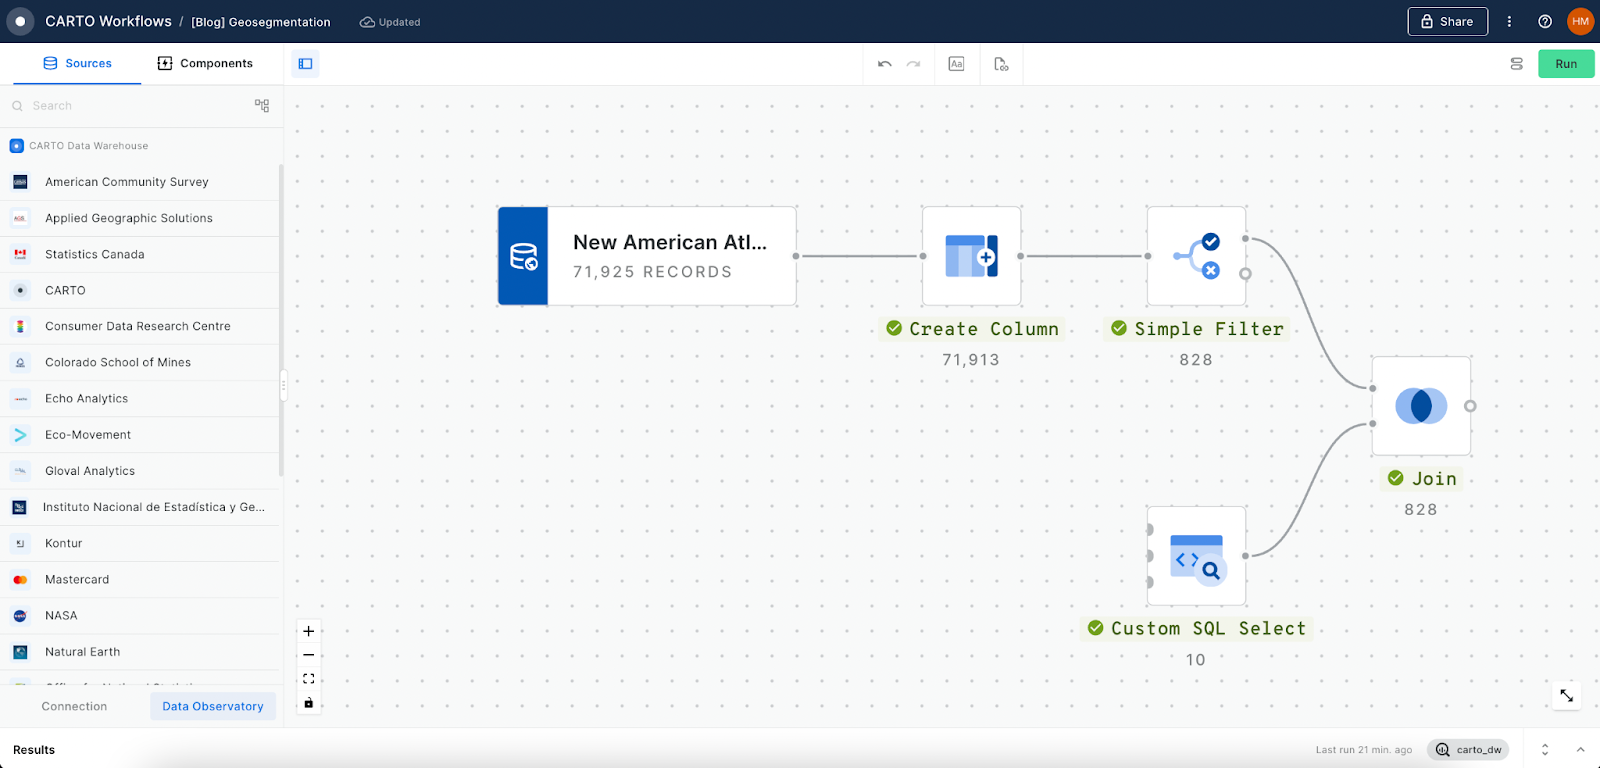
Let’s explore this data. On the CARTO Workspace, head to the Workflows tab, Create a new workflow and select a connection; you can either use the CARTO Data Warehouse or connect to your own.
💡You can Run a Workflow at any point. Only components which have not already been run will be processed, so you don’t need to worry about the whole workflow re-processing.
- Head to Sources > Data Observatory > Consumer Data Research Centre > Subscriptions, and drag the New American Atlas into your canvas.
- Now, let’s filter our data to one state; Connecticut (you can choose any state you like!). Connect the New American Atlas source to a Create Column component. Call the column state_fips and use the code LEFT(geoid,2) to extract the first two characters, which are the state reference.
- Next, add a Simple Filter component, with the condition state_fips is equal to 17 (this being Connecticut’s FIPS code identifier - you can find the full of state codes here).
- Now, we need to create a table containing the group weights. Add a Custom SQL Select with the following code to create a query from our weights. Remember, you can change these to adapt them to your use case.
Finally, add a Join component to join the weights to the relevant New American Atlas tracts. Set the main table column as Spielman_Singleton_Group, the secondary table column as Weights and the join type as Left.
Once run, select the Map preview and Create a map to explore the results - they should look a little something like the below (open in full screen here).
#ProTip: this dataset contains suggested hex color codes for styling the data, so you can use hex-based styling to quickly and easily create a beautiful map! Check out more tips and tricks for effective data visualizations in our webinar Data Visualization & Storytelling with Maps: Tips, Tricks & Best Practice.
In the final step of this quick Geographic Segmentation tutorial, we’ll calculate a Total Addressable Market, i.e. the total number of people living in each area we expect to be able to sell our mobile family plan to. The math behind this is simple; the target market weight * the population (note: this only works if your maximum weight is 1, or you’ll start inventing people!).
To do this, you’ll need to know the number of people living in each census tract. In the Data Observatory, find and subscribe to the Sociodemographics, 2018, 5yrs - United States of America (Census Tract) dataset from the American Community Survey.
Let’s extend our workflow with a few easy steps.

The additional steps are in the green highlighted box above:
- Drag the Sociodemographics layer onto the canvas.
- Use a Join component to left join this to the output of the earlier Join, using the common field of geoid.
- Now, Create a Column with the name TAM, and the calculation index_joined * total_pop_joined - this is your Total Addressable Market!
- Finally - a little housekeeping! Use Drop Columns to drop any superfluous columns from the Sociodemographics table, and finally Save as Table… and you should have something like the below!
Analysts could use this information to target locations for rolling out new products and services. Darker blue and green areas - such as around Hamden and Shelton - are where the Total Addressable Market is larger - ideal for our new family mobile plan!
Want to take this one step further? This map would be EVEN more useful if the data were converted to a regular grid like the H3 Spatial Index - check out this tutorial in our Academy for tips on doing this!
Want to start using geographic segmentation to make more intelligence business decisions? Why not request a demo with one of our experts to learn how this powerful analysis can help your organization.


.png)