Ghost Kitchens: Predictive Location Intelligence


If I asked you two or three years ago, 'Have you ever eaten food from a ghost kitchen?' you’d probably say no, or assumed I was talking about some sort of themed restaurant. If I asked you now, the answer may be different - even if you don’t know it.
Ghost kitchens - sometimes also referred to as dark, virtual or shadow kitchens - are just that: kitchens. They deliver restaurant quality food, without the restaurant attached to it.
Driven by changes in lifestyle, popularity of delivery apps and - of course - accelerated by the COVID-19 pandemic, demand for food delivery services has skyrocketed. It’s predicted that in the US alone, the market will grow from 60 billion in 2018 to an enormous 365 billion in 2030. In contrast, the year-on-year decline of seated restaurant-goers fell by 30% between 2019 and 2020. Ghost kitchens are set to be a big part of this change with Euromonitor estimating the sector will be worth $1 trillion by 2030.
So what makes ghost kitchens so commercially attractive? First of all lower costs. Their rent and running costs are lower without a seating space and serving staff. Similarly they don’t need to pay a premium in rent to be situated on that bustling square or conveniently next to the station you commute via. Secondly they aim to exploit an unsaturated market. Ghost kitchens are typically situated in more residential areas where competition from brick-and-mortar restaurants is low but demand for a convenient washing-up-free meal is high.

Los Angeles has been described as the US “national epicenter” for the ghost kitchen phenomenon. However, if you search for “ghost kitchens” on Google Maps, you see… well, not much at all. Searches for ghost kitchen locations returned a range of blog posts such as 7 Ghost Kitchens in Los Angeles to Try and 23 L.A. Ghost Kitchens With Exciting Options for Delivery/Takeout - but no physical locations. It could be that people still like the idea of ordering the food from a traditional restaurant and sharing the exact locations of ghost kitchens could give the game away.
What Do Ghost Kitchens Need to Succeed?
The recipe for a successful ghost kitchen is:
- Low competition from sit-in restaurants.
- A strong local market with many residents/potential app users within a typical 5 mile delivery radius, making them easy to reach for a delivery cyclist or motorcyclist in a short space of time.
- Not just a high number of local residents, but the right residents; a ghost kitchen for a vegan restaurant specializing in light brunches and smoothies would have a very different market to a spicy wings restaurant.
To understand this, we can use data from CARTO’s Data Observatory and our Analytics Toolbox to understand the spatial patterns of these indicators to predict successful locations for ghost kitchens. Businesses looking to do the same would also want to consider other factors such as the density of delivery app sign-ups however to keep this replicable for our users we will stick to the above points.
Note: We’ll only be looking at mainland Los Angeles county in this analysis due to the low populations of the island areas.
Insight #1: Competition from Sit-In Restaurants
The first step in this investigation is to pinpoint the competition from sit-in restaurants. We’ve used SafeGraph’s Places data (available via our Spatial Data Catalog here) for Point of Interest (POI) data which includes data on site name, brand address, contact information and category. We’ve filtered the data to only include sites where the “top_category” includes the word ‘restaurant ’ however organizations could filter by sub_category to be more specific about what they deem competition.
Restaurant density in Los Angeles County. Source: Safegraph.
There are a staggering 11, 893 restaurants in Los Angeles. This means that competition is fierce, making the intelligence behind site selection decisions even more critical for success.
We can quantify the density of restaurants using the Getis-Ord statistical function from our Analytics Toolbox. Getis-Ord returns a “gi” value which shows us where high and low values cluster spatially; this will help us understand where there are clusters of restaurants. If you’re interested in multivariate hotspot analysis (for example to be able to consider factors such as footfall, target market and competitors altogether), our new Commercial Hotspot tool is perfect for this.
This tool requires data to be pre-aggregated to a quadkey or H3 grid; we’re using the latter. You can read more about the benefits of aggregating to hierarchical grids like H3 here.
How to Hotspot
The outcome of the GI analysis is shown on the map below, along with the SQL code used to generate this. It’s a really straightforward bit of code that runs the Getis-Ord statistic which is output as an array (step 1). In step 2, this array is unnested, and then joined back to the original H3 layer (step 3) for visualization and comparison with other fields.

Higher GI values indicate the presence of hotspots. The most intense hotspots can be found around Downtown LA, West LA and LAX. What does this mean for ghost kitchens? They’re unlikely to be successful in these areas, facing steep competition from sit-in restaurants. However, there are large parts of the city beyond these hotspots - and this is where they’re more likely to thrive.
Restaurant hotspots in Los Angeles County. Source: Safegraph.
With
/*Step 1: Run Getis-Ord, specifying the cell search distance (3) and type of calculation (gaussian)*/
getis_ord AS (
  SELECT `carto-un`.carto.GETIS_ORD_H3(ARRAY_AGG(STRUCT(h3id, location_name_count)),
      3, 'gaussian') AS output
  FROM `carto.GhostKitchens.H3_res9_restaurant`
),
/Step 2: Unnest the array results/
GIjoin AS (
 SELECT unnested.INDEX AS h3id, unnested.gi
 FROM getis_ord  UNNEST(getis_ord.output) AS unnested
)
/Step 3: Join the results/
SELECT *
FROM carto.GhostKitchens.H3_res9_restaurant
LEFT JOIN GIjoin ON carto.GhostKitchens.H3_res9_restaurant.h3id = GIjoin.h3id
WHERE GI > 1;
Insight #2: Finding a Large Local Market
According to the California Census, Los Angeles is a county of 9.8 million people living across 4,058 square miles. But in a county consisting of dense skyscrapers, capacious suburbs, towering mountains and desert stretches the population density is far from uniform. For ghost kitchens, proximity to a large population is essential for attracting customers as well as staff including chefs and delivery drivers.
While many food delivery services do not state a distance limit between kitchen and customer, in reality the majority of orders will be within a 5 mile radius of a restaurant in order to keep food fresh and hot, maximize the number of possible deliveries and minimize customer complaints as a result.
With this in mind our next step in this analysis is to investigate areas where the population within a 5 mile radius is highest. This might not necessarily mean a high population in-situ, which may actually suit ghost kitchens better to avoid the risk of disturbing neighbors.
How to Identify Areas of High Population
For this step, we want to find out the population within 5 miles of each hexagon - and we’re only interested in areas not in a hotspot. Using standard Spatial SQL, this would normally be achieved by performing a left join using the spatial predicate ST_DISTANCE(). However, we have 90k hexagons to analyze and there are only so many hours in the day. Luckily we’re using H3 cells for our analysis so our “hours in the day” become a lot more efficient.H3 grid networks are optimized for extremely efficient operations and when combined with the tools CARTO has created specifically for these they enable incredibly fast analysis of big data.
The tool we’ve taken advantage of for this analysis is H3 K-ring which returns an array of hexagons within “k” steps of a central H3 cell. This means that rather than using ST_DISTANCE() we’re able to use this lookup to work out the number of H3 cells which equate to a 5-mile radius (it’s ~27) and calculate the population from that instead. This is an infinitely faster process - it’s a “pour a cup of coffee” wait rather than a “let it run over your lunch break/overnight” wait (in geospatial processing units of time are always measured in the amount of food that can be consumed while waiting).
With
/Step 1: create two H3 CTEs/
buffer AS (SELECT h3id, P0010001_sum FROM carto.GhostKitchens.H3_res9_population),
pop AS (SELECT h3id, P0010001_sum FROM carto.GhostKitchens.H3_res9_population),
/Step 2: Specify K-ring areas/
ring AS (SELECT * FROM buffer, UNNEST(carto-un.carto.H3_KRING(buffer.h3id, 27)) AS kringid),
/Step 3: sum the population in the K-ring area for each cell, joining it to the origin cell/
SELECT ring.h3id, ring.P0010001_sum AS popraw, SUM(pop.P0010001_sum) AS pop5mile
FROM ring
LEFT JOIN pop ON ring.kringid = pop.h3id
GROUP BY ring.h3id, popraw;
The field “pop5mile” in the code above is the 5-mile radius total population from each H3 cell. The dataset H3_res9_population had been pre- enriched with 100m-resolution data from WorldPop (available via our Spatial Data Catalog here) incorporating areas up to 5 miles away from Los Angeles County to avoid potential boundary effects. The map below shows the total population within 5 miles of each hexagon with the restaurant hot spot areas excluded.
Predictably Inner Los Angeles areas have the highest local population with more populated areas also stretching south, east and northwest.
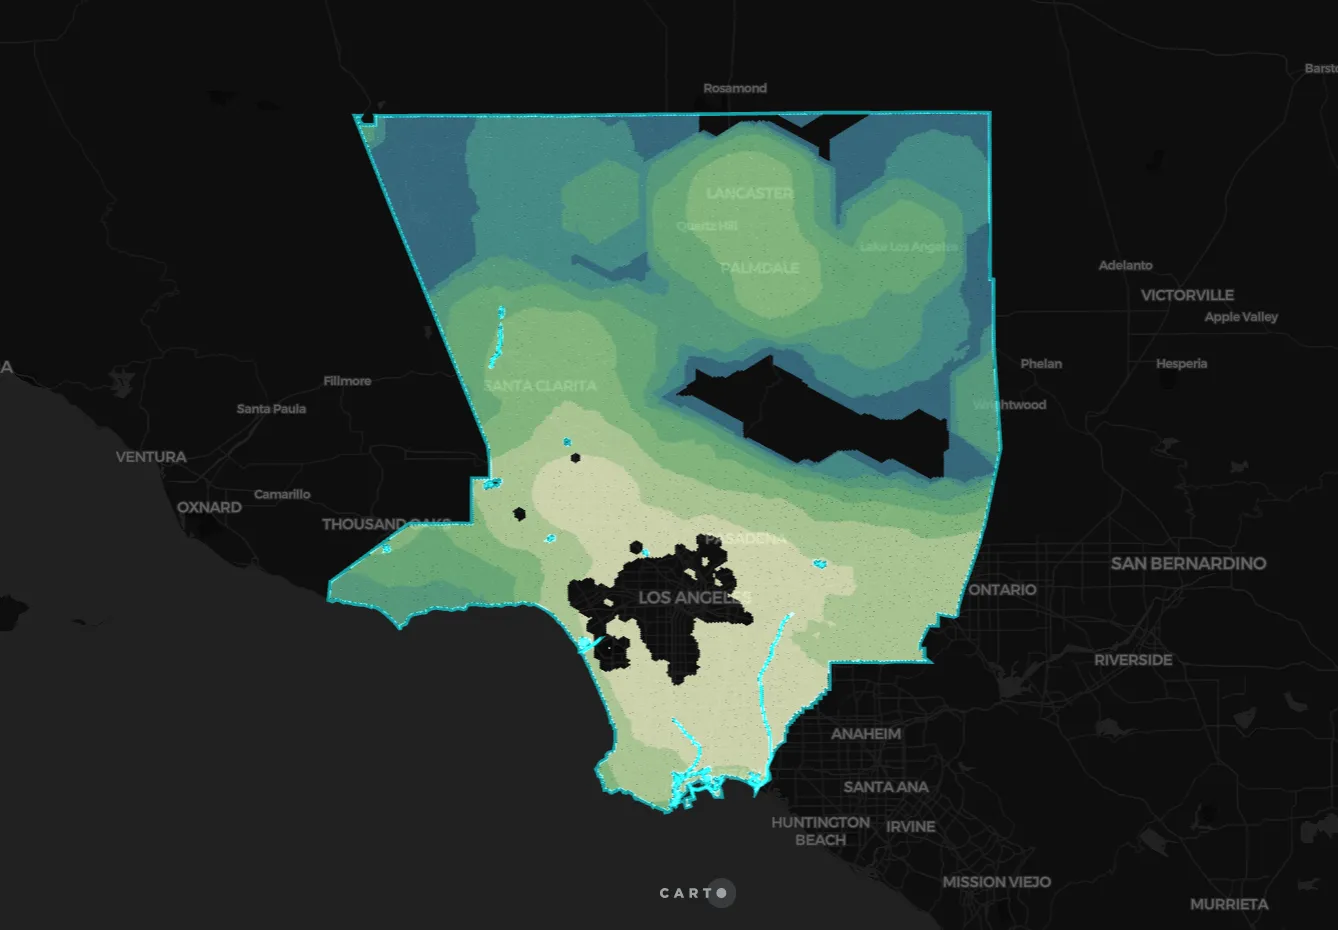
Population within 5 miles; yellow areas showing areas of higher population. Source: WorldPop.
Insight #3: Locating the Right Customers
So now we know where the people are but people and customers are different.A prevailing trend in Location Intelligence has been market geosegmentation; aligning geographic segments of the population with specific market trends and behaviors. This allows businesses to pinpoint customers most likely to buy their product or use their service allowing for more informed data driven decisions.Geosegmentation is a key part of site location analytics, allowing decision makers not just to target the most customers, but the most relevant customers.
In this use case we’re able to not just locate likely restaurant-goers but people who are likely to enjoy specific cuisines. We can achieve this using Spatial.ai’s Geosocial Segments data. In this dataset, user experiences, personalities, feelings from sources including Twitter, Instagram, Meetup, Eventful and others are combined into a series of 72 indexes. For each index a score out of 100 indicates how aligned that census block is to a certain segment. Segments include “family time,” “girl squad” and “outdoor adventures.” We’ve initially focused on “Asian food & culture” which is defined as:
“Our “Asian Food & Culture” Geosocial Segment measured as a percentile ranked against all blockgroups in the comparison level. Segment Description: Asian culture has a lot to offer, but the Asian cuisine tends to be the most frequently referenced. This segment is talking about Asian dishes, holidays and drinks.“
How to Find the Right Market
Using the DATAOBS_ENRICH_GRID() tool from our Analytics Toolbox enrichment tools, we assigned each hexagon cell in our H3 grid with the average score from the “ED05_asian_food_and_culture” field of Geosocial Segments. Data enrichment is a fantastic way of efficiently enhancing one data layer with the variables from another; discover more about our range of enrichment tools and follow a great tutorial to get started here.
The map below shows the results of this, with yellow areas being where residents are most closely aligned with the characteristics of the “Asian food & culture” group. In CARTO Builder we’re able to simultaneously visualize the size and color of variables in H3-based datasets. We’ve sized the hexagons by their 5-mile radius population to begin to visualize where might be the best locations for an Asian food ghost kitchen.
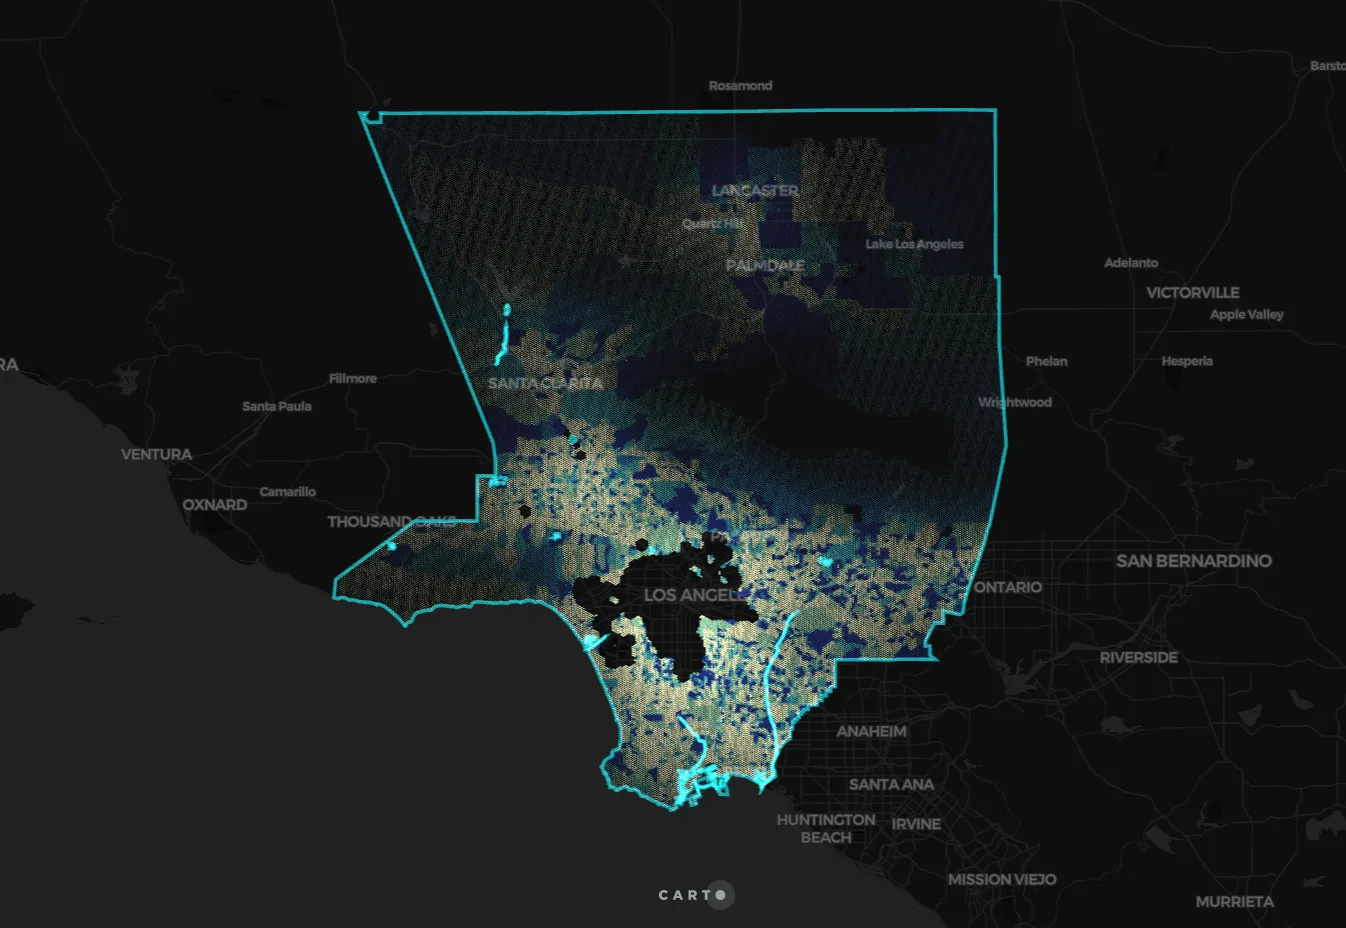
Areas where residents are most interested in Asian Food & Culture. Source: Spatial.ai.
We can see that the propensity to enjoy Asian food and culture has very intricate local spatial patterns. At the county-level it’s difficult to gain insights from this data by just inspecting it visually. To aid our understanding of the wider spatial trends we’ll again use the spatial statistic Getis-Ord.
With
/Run the Getis-Ord analysis/
pop5mile as (select * from carto.GhostKitchens.H3_res9_population5mile),
hotspots as (select * from carto.GhostKitchens.H3_res9_restauranthotspots),
getis_ord AS (
 SELECT carto-un.carto.GETIS_ORD_H3(ARRAY_AGG(STRUCT(h3id, ED05_asian_food_and_culture_avg)),
     5, ‘gaussian’) AS output
 FROM carto.GhostKitchens.H3_res9_segmentation
),
/Unnest the array results/
GIjoin as (
 SELECT unnested.INDEX AS h3id, unnested.gi
 FROM getis_ord,  UNNEST(getis_ord.output) AS unnested
)
/Join the results to other analysis results/
SELECT ED05_asian_food_and_culture_avg, carto.GhostKitchens.H3_res9_segmentation.h3id as h3, pop5mile.pop5mile, GIjoin.gi
FROM carto.GhostKitchens.H3_res9_segmentation
LEFT JOIN hotspots ON carto.GhostKitchens.H3_res9_segmentation.h3id = hotspots.h3id
LEFT JOIN GIjoin ON carto.GhostKitchens.H3_res9_segmentation.h3id = GIjoin.h3id
LEFT JOIN pop5mile ON carto.GhostKitchens.H3_res9_segmentation.h3id = pop5mile.h3id
WHERE
 (hotspots.gi IS NULL OR hotspots.gi >=0.05) AND GIjoin.gi < 0.05
AND
 pop5mile.pop5mile >=
   (SELECT percentiles[offset(80)] AS p80 FROM
   (select APPROX_QUANTILES(pop5mile, 100) AS percentiles
   FROM carto.GhostKitchens.H3_res9_population5mile))
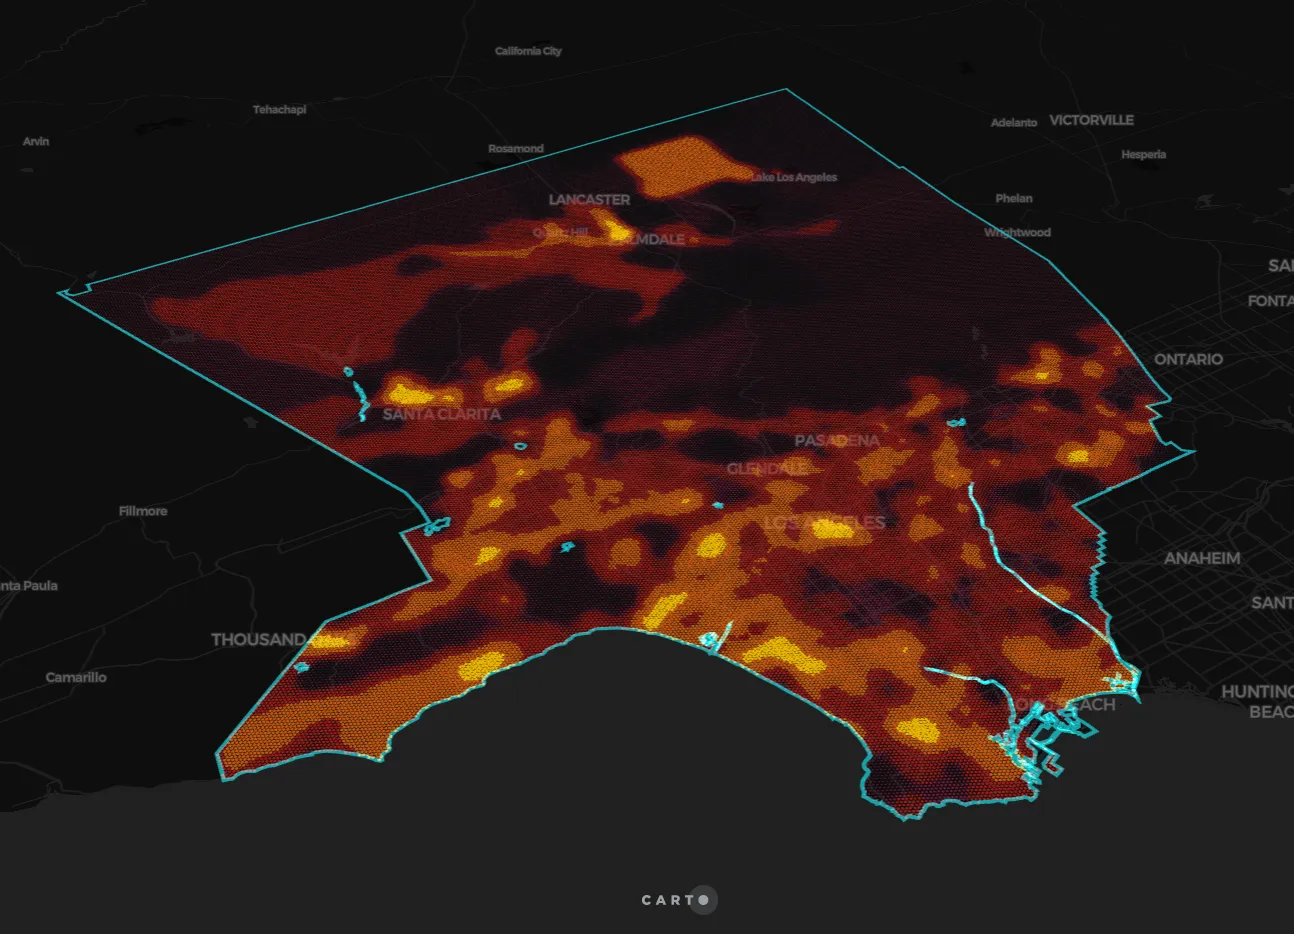
Asian Food & Culture hotspots.
Brighter yellow areas indicate hotspots for residents keen on asian food and culture - these are the areas we’re the most interested in.
So let’s bring all of this together!
Location Intelligence and Ghost Kitchens
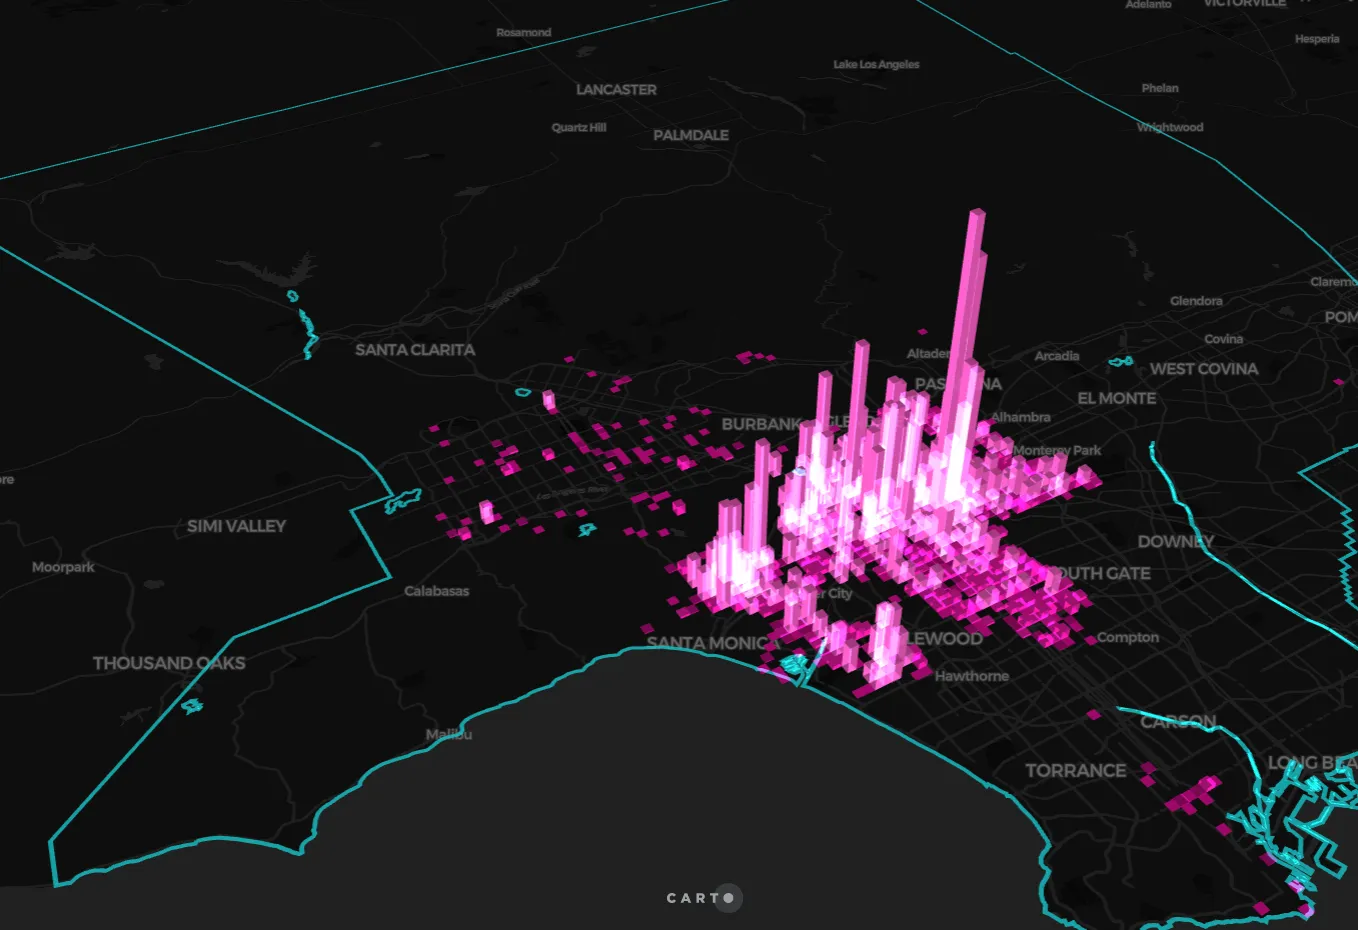
Like with all Location Intelligence, it’s in combining different datasets and analysis that we gain the most insight. The map below shows the 20% top clusters for enthusiasts of Asian Food & Culture. Areas have also been filtered to only include the 20% of areas with the highest population within 5 miles with existing restaurant hotspots excluded.
Explore the interactive map here.
So where might the most successful locations be for ghost kitchens? The concentration of restaurants in downtown Los Angeles means there’s currently a lot of opportunity across the rest of the county. Particularly promising areas sit just outside the urban core in places such as Vernon Beverly Hills and Ladera Heights. Other areas which could attract ghost kitchens include population centers such as the Valley Santa Monica Torrance Long Beach and Elmonte.
There are of course many more factors that a ghost kitchen location planner may wish to consider, such as rent, zoning and travel time analysis which is particularly relevant for a city such as Los Angeles which is notorious for slow traffic.