


Integrate analysis workflows in your cloud native apps with CARTO


CARTO Workflows, our no code tool for designing and automating spatial analysis, has matured to become a powerful component of the CARTO platform, opening up cloud native spatial analysis to a wider set of users in many enterprises. However, we understand that the true potential for data processing and analysis workflows is not to design and execute them in the confines of the CARTO Workspace, but to integrate them into the very fabric of your data orchestration processes, or to trigger their execution from your own spatial applications.
In this blog post, we focus on how you can productionize data workflows and integrate them as key processes within your applications. We will walk you through the different steps to do this and provide you with code snippets that outline how to trigger workflows from external applications, or by directly calling an API end-point.
Like any process in CARTO, workflows run natively in your connected cloud data warehouse (e.g. BigQuery, Snowflake, Redshift, or a PostgreSQL database), leveraging the data security and scalability that these cloud platforms provide.
In order to illustrate these new features, we’ll be creating a workflow to analyze the population living in the areas around Telco LTE cell towers, in a specific US state. After that, we'll integrate this analysis into an application by calling an API end-point for the specific workflow we have built. A very similar workflow to the one we are using in this story can be found as a template available in the CARTO Academy, which also includes a step by step guide to tackle a very similar use case.
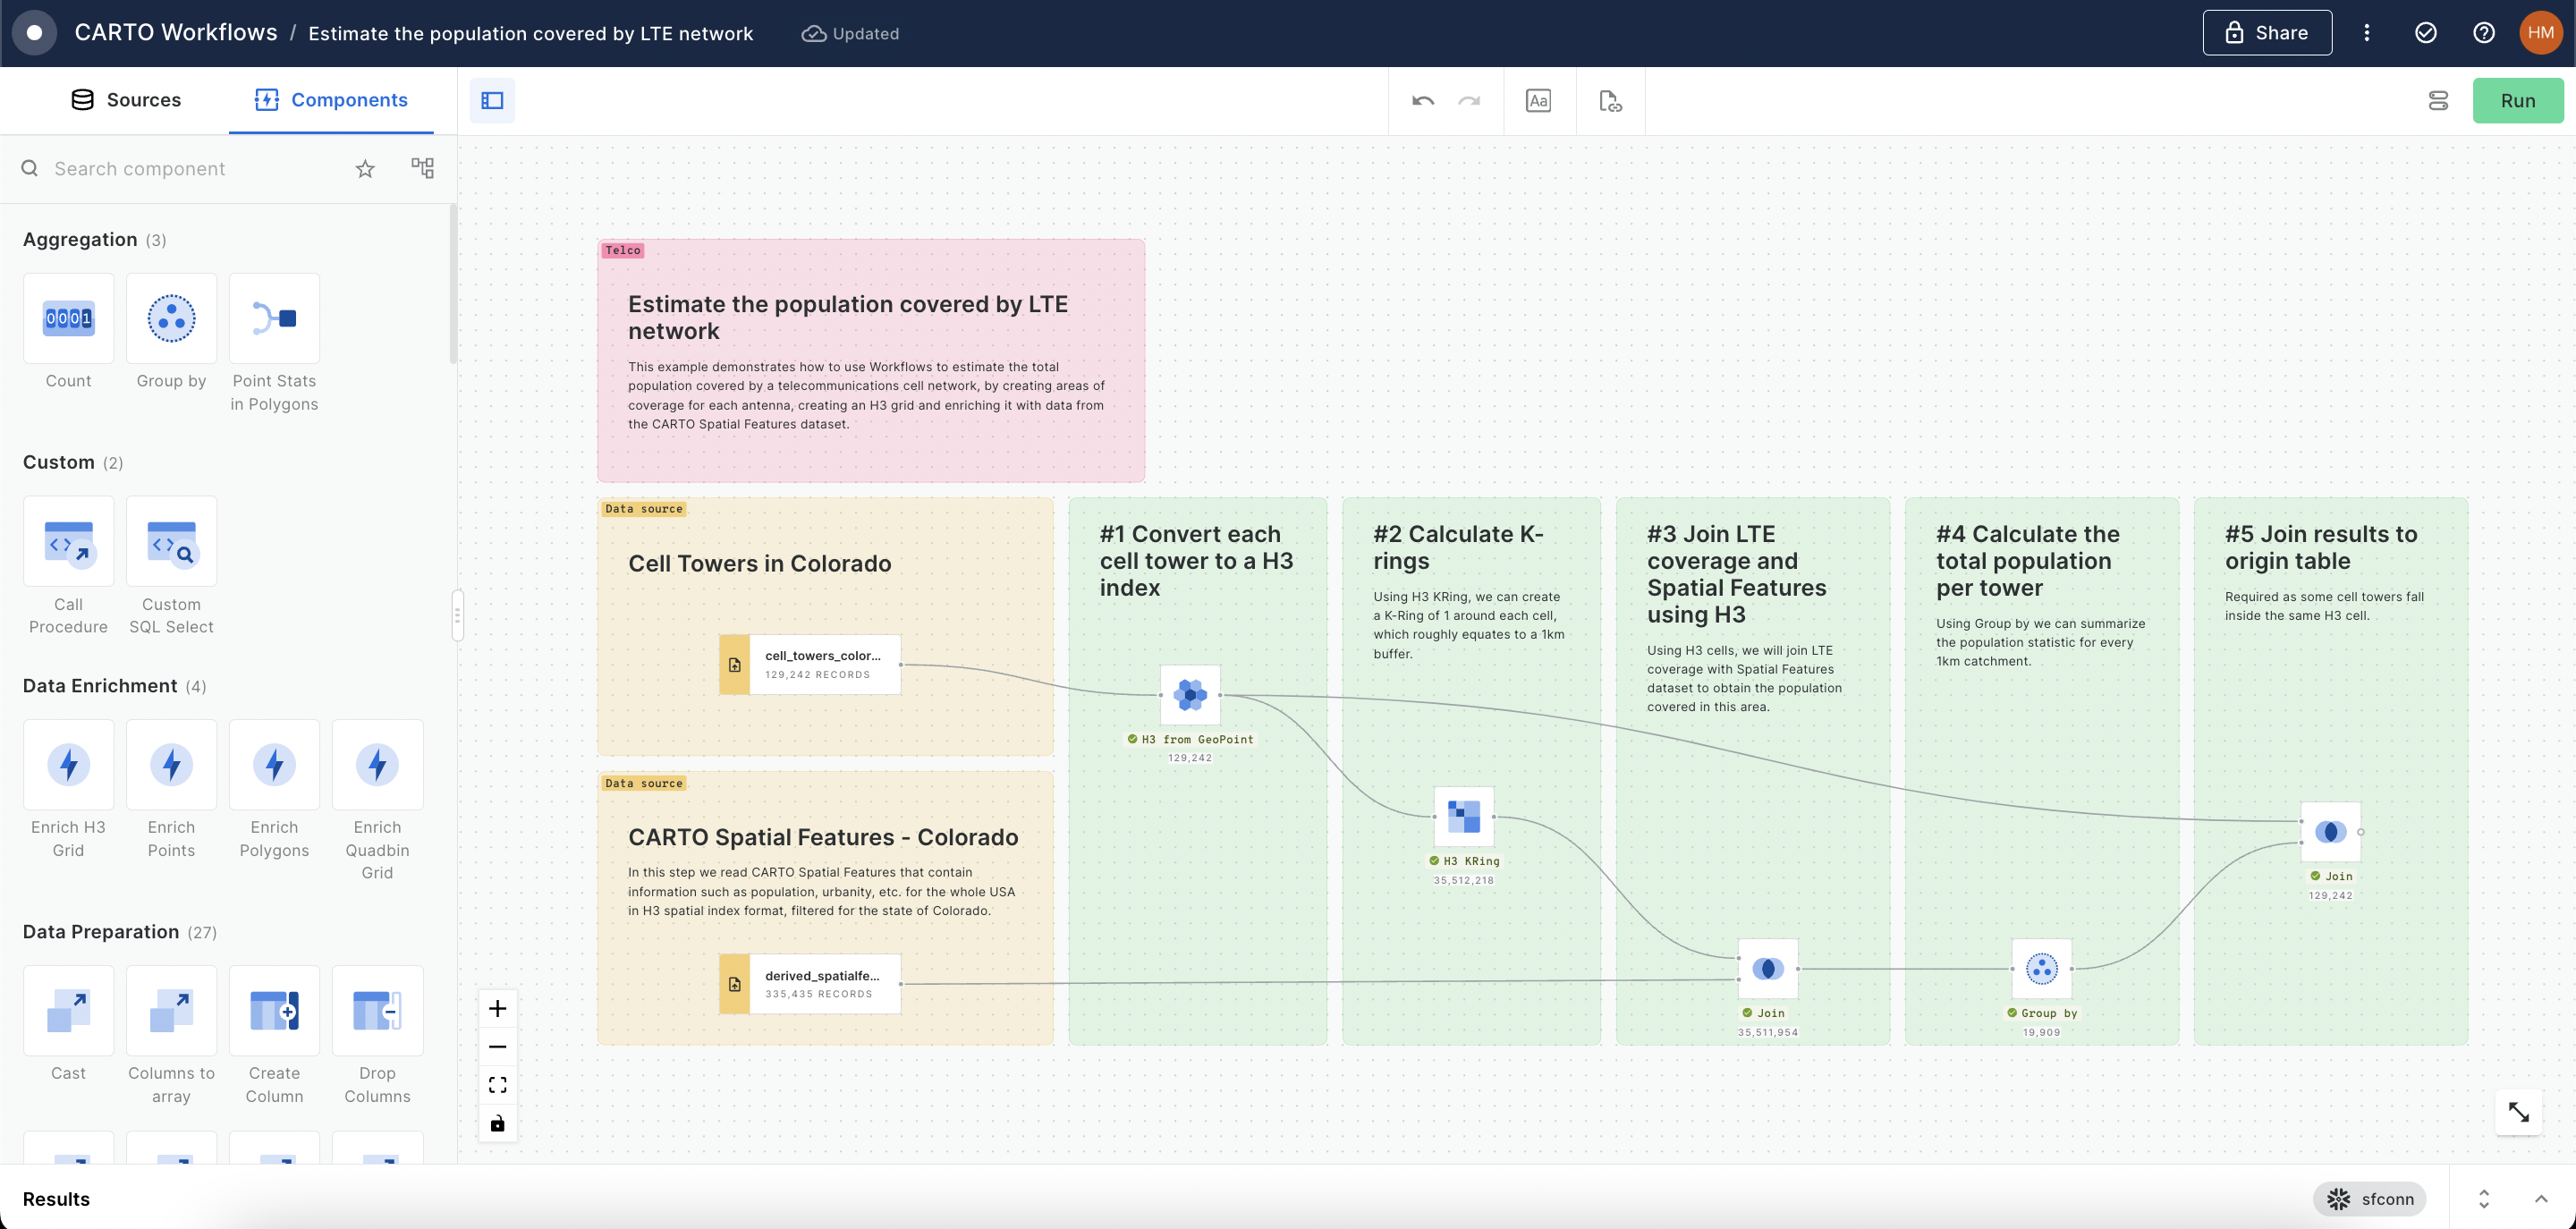
Our workflow starts by adding the following data sources onto the canvas: :
- A point dataset containing millions of Telco LTE cell tower locations worldwide;
- A polygon dataset that contains the digital boundaries for all US states;
- A CARTO Spatial Features dataset that contains diverse spatial data, including socio-demographic indicators in an H3 grid at resolution 8.
The first step of the workflow is to select a specific state by name; after which, we'll use that state to filter cell tower locations. The result of the workflow will only include cell towers within the selected state. The next step is to compute a buffer around these towers. The radius of this buffer determines the size of the resulting circular area around each tower, defining our area of interest.
Once we have the areas around the towers defined, we'll run a polyfill process. This transforms each of the buffers into an H3 grid at the same resolution as our CARTO Spatial Features data. This process includes aggregating data to flatten any overlapping cells, ensuring we don't count people twice just because they're close to two different towers!
Using a simple Join component, and taking advantage of the simplicity and versatility of H3, we will enrich our polyfilled areas with other columns coming from the CARTO Spatial Features dataset. We'll pick the population.
Finally, we will connect the Output component to the last node in our workflow, to define the content of the output of the workflow, when it's executed via API. We'll elaborate more on this later in this post.
CARTO Workflows lets you define global variables that can be used as input values for component settings; in order to configure the final result following the execution of a workflow.
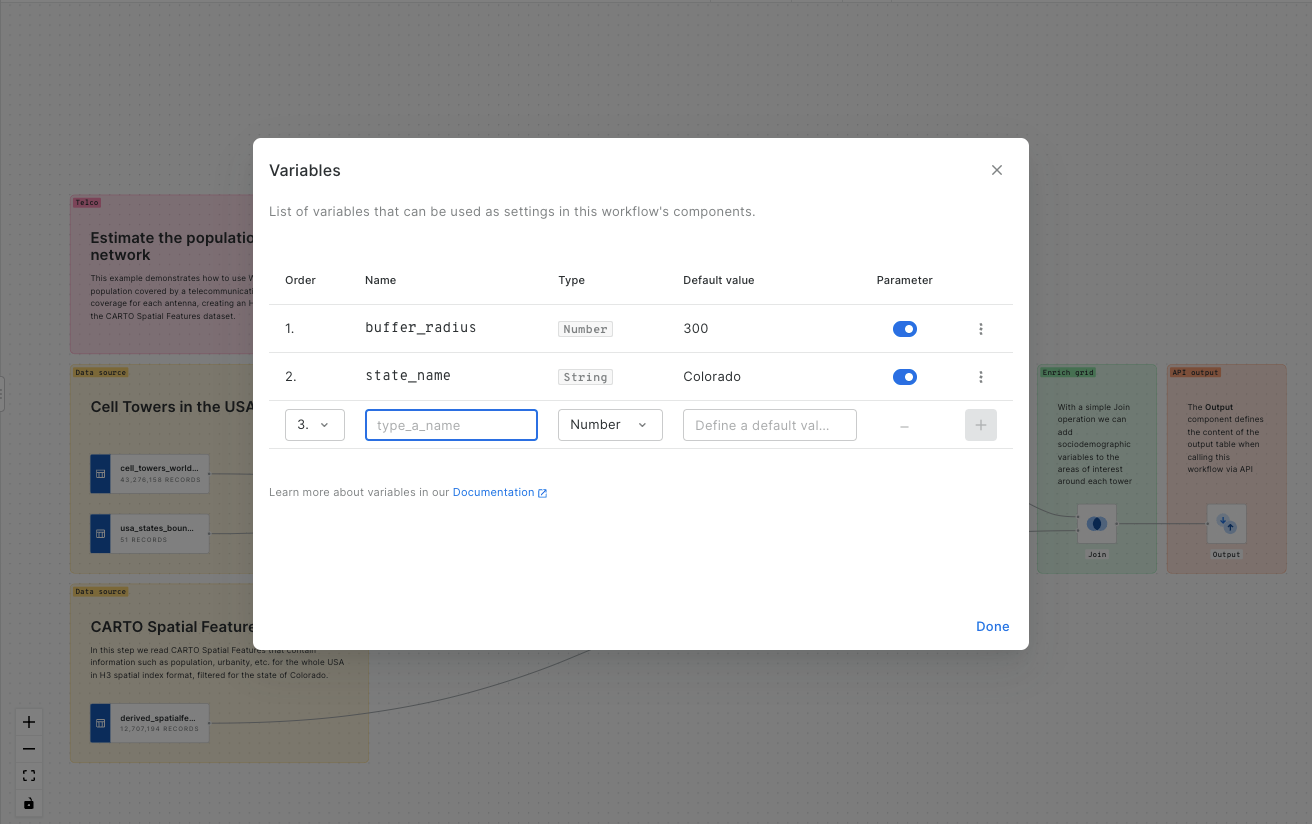
In our example, both the US state (i.e. state_name) and the size of the buffer area around each cell tower (i.e. buffer_radius) are defined with a parameter, as follows:
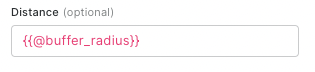
- buffer_radius defines the size of the area around each tower, used in the ST Buffer component, like this:
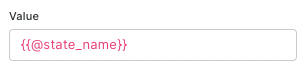
- state_name defines the name of the state that will be used to filter the states' boundaries dataset, used in the Simple Filter component, like:
When a variable is set as a 'Parameter', it means that it will be exposed in the API call, so it can be given a different value on each execution of the workflow. Keep reading to find out how you can launch the execution of a workflow from an application by calling an end-point.
A workflow built with CARTO can be executed via an API call, which lets you integrate your data pipelines into a larger orchestrated process, and trigger the execution of these workflows from your external applications.
This is an example of an API call that would trigger the execution of our previously configured workflow:
Let's review that request in detail:
In this case, the result of a workflow would be stored in a temporary table in your data warehouse. This location is determined by the 'Output' component of the workflow. The name and location of this table is returned in the API call's response, such as:
By using the Cache settings in the workflow, you can also determine whether the analysis is recomputed from scratch on every execution (which is useful when underlying data is constantly updated), or the result is cached when parameters remain the same.
Now that we have gone through the steps of creating the workflow and understanding how it can be triggered using an API call, let's get hands-on with integrating it into a simple spatial application.
Note that this feature has been designed to ease the integration of asynchronous analytical processes in your front-end applications. Being able to enqueue the execution of a workflow, and query the execution status to check when finished will make it a lot easier for users to embed analytical procedures in custom applications.
We'll walk through a practical example using the application we have made available in this repository. This application serves as a practical guide, showing you how to seamlessly incorporate workflows built in CARTO into your own app development projects.
In order to develop the example application the main building blocks have been the following:
Selectors and filters
In order to let the user specify a US state to filter the data, and a radius for the buffer that will be passed as parameters to our workflow, we need to add some selectors into the application. This is done in this part of the code.
Call the API to execute the workflow
In order to trigger the execution of the Workflow, the application will replicate the API call we analyzed earlier in this post. This part is detailed in this piece of code:
Query the job status
In order to check whether the process has finished, we need to use the ID in the response, until we get a "success" status. This is done with this function, which is called every 2 seconds from this piece of code.
Load the result on the map
Once we get the "success" status in the response, we can add the resulting data as a layer in the map; this is shown in the code below:
We have published the example application with the analysis workflow integrated and executed by calling the API app here, and the code is freely available on GitHub.
Looking into modernizing your geospatial applications? Do you need a toolkit that will save your both time and cost when developing geospatial solutions? Have a look at how CARTO brings unique value to your spatial development stack, and why not sign up for our free 14 day trial or book a demo with one of our specialists.


