


Quantifying Park Use in American Cities: Spatial Models and Novel Measures


City agencies need measures for the services they deliver. Police and fire departments measure response time. Transportation and public works departments count potholes filled.Housing authorities count units and households served. But what of a city's parks? How is park provision to be assessed? Which parks are used and which neighborhoods lack park access? How can planners measure if a new facility is a success – if it serves its intended function?
{% include icons/icon-bookmark.svg %} Click here to read the full paper
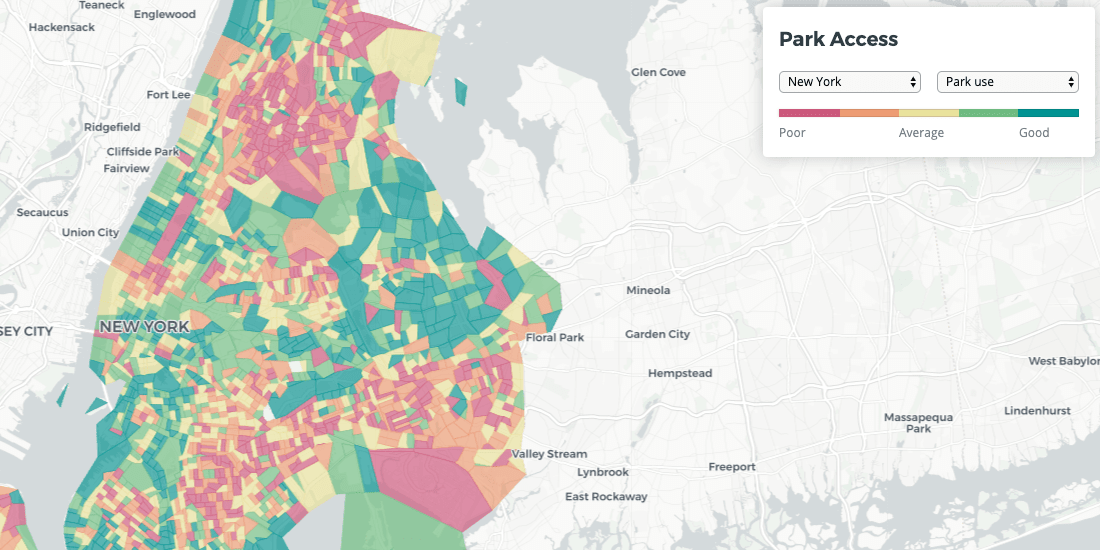
Traditionally planners have evaluated park access using simple spatial models with just distance and area. For example one might measure the park land within a radial buffer of a neighborhood or aggregate a "gravity potential" in which each park's land area is deweighted by its distance or travel time from the neighborhood (i.e. $$\Sigma_{p} a_{p} / d_{\ell p}^{a}$$ for parks $$p$$ of area $$a$$ at distance $$d_{\ell p}$$ from neighborhoods $$\ell$$ and some power $$α$$). These models represent the $$potential$$ access to parks as though space were all that mattered. But it is not potential access but realized use – actual park visits – that deliver the social psychological and physiological benefits of parks. This raises two questions:
- How can we measure use?
- Adopting actual visits as the benchmark are the models of potential spatial access accurate? If not what are their limitations?
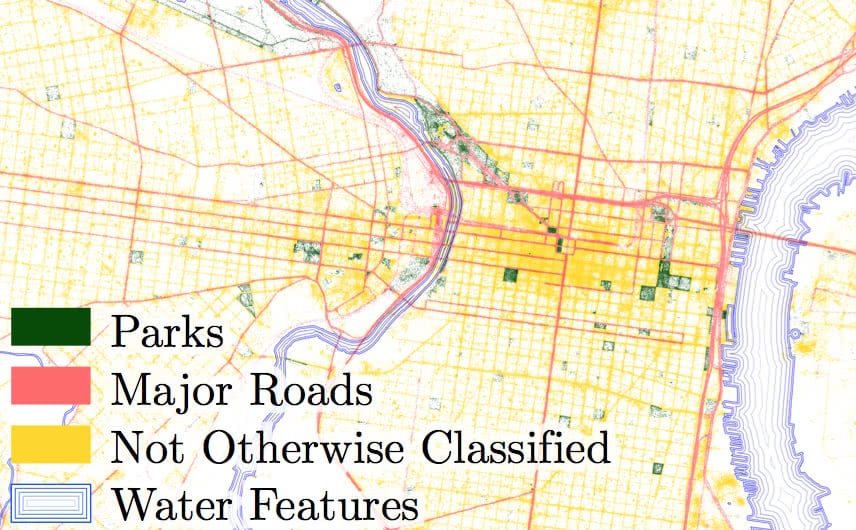
GPS location data now record when smartphones visit parks. Park boundaries can be drawn from city open data portals or from OpenStreetMap; green spaces can be identified using LIDAR imagery. Devices' home locations can be inferred from where they spend the night. All that is needed is to merge billions of latitude/longitude points to polygons for parks neighborhoods and roads. This can now be accomplished very inexpensively on the grid – for $$any$$ $$city$$ $$in$$ $$America$$. As an example labelled points at non-home locations are shown below for Philadelphia.
Aggregating daily park visits yields usage rates neighborhood by neighborhood. We can compare these rates to the spatial models city by city.
On the whole the spatial models perform fairly poorly. What goes wrong? First the spatial models shown ignore the complex routines of urban life. People use parks outside of their residential neighborhood in the course of commutes and daily routines. In Chicago for instance the average user of parks in the central business district (the Loop) lives more than 10 km away.
The second issue is that the spatial models need to be calibrated and they almost never are. What is the appropriate buffer size or distance decay? This scale differs between cities. Mobility in Los Angeles is unlike that in San Francisco or Philadelphia. Planners often (rightly!) design parks to be accessible to children and the elderly and this motivates a (fixed) distance cut-off of a quarter mile. It is worth acknowledging that these specific populations are under-represented in cell-phone data. But even for those with primarily local routines scales vary by city. Proxying park use with a single fixed model – as do many studies in psychology epidemiology and planning – will not in general measure a "dose" of park exposure that is comparable across cities.
The final issue is that access is not simply spatial even accounting for the complexity of routines transportation and differences in scale among cities. GPS mobility data help make this clear. The table below regresses neighborhood park access in three ways:
- a) potential access ~ black + hispanic
- b) realized access ~ black + hispanic
- c) realized access ~ black + hispanic + potential access
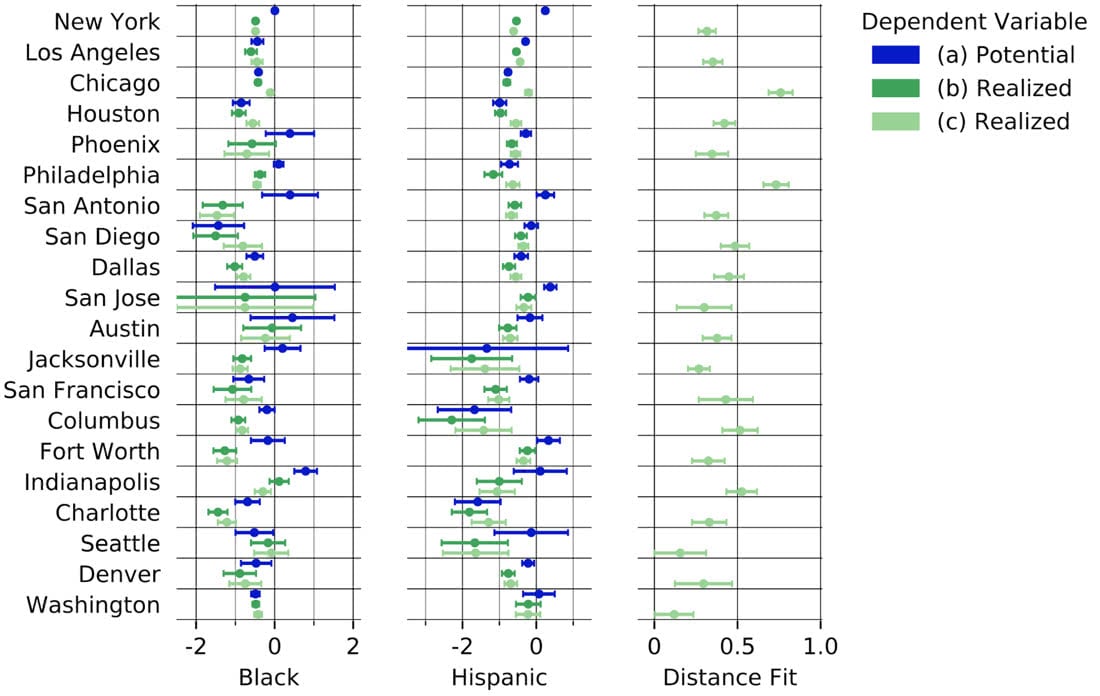
Point estimates (dots) and confidence intervals (bars) for the predictors of potential and realized access to parks in American cities as a fraction of each city's average level of park use.
Model (a) simply asks how potential (spatial) access{1} varies according to race and ethnicity. Model (b) does the same thing for realized access. In each case the access is normalized to the citywide rate so racial/ethnic composition is predicting a fractional deviation from the average. It is perhaps no surprise that Blacks and Hispanics have lower levels of park use. Parks are a public resource but convenient access to them is a costly private good. However the differences between models (a) and (b) suggest that realized access is more – not less – unequal than potential access.
Finally model (c) repeats (b) but includes potential access (the old dependent variable) as an independent variable. The fact that the parameters for fraction of neighborhoods black and hispanic remain negative means that even controlling for the spatial availability use is lower for minority populations. This is an important finding. It means that if a planner were to use a spatial model to evaluate the parks provisioned to neighborhoods in the city they would systematically over-state the actual park use achieved by minority neighborhoods. Still the spatial model has definite value in that it allows us to estimate the impact of proximity on actual use.
GPS data also make it possible to go beyond baseline access to study $$which$$ $$amenities$$ are actually used within parks. Often these are not the ones anticipated by planners or park boosters. Take the example of Jackson Park Chicago. A lakeshore gem designed Frederick Law Olmsted it was the site of the iconic 1893 Columbian Exposition and is the future home of the Obama library. What are its most-used features? Boosters planners and users usually guess correctly that the Museum of Science and Industry draws the crowds but they then list the park's picturesque Japanese Garden Wooded Isle and beaches. The beaches are well-used in the summer but when the data for this study were recorded in May 2017 the $$parking$$ $$lots$$ were among the most-frequented locations.
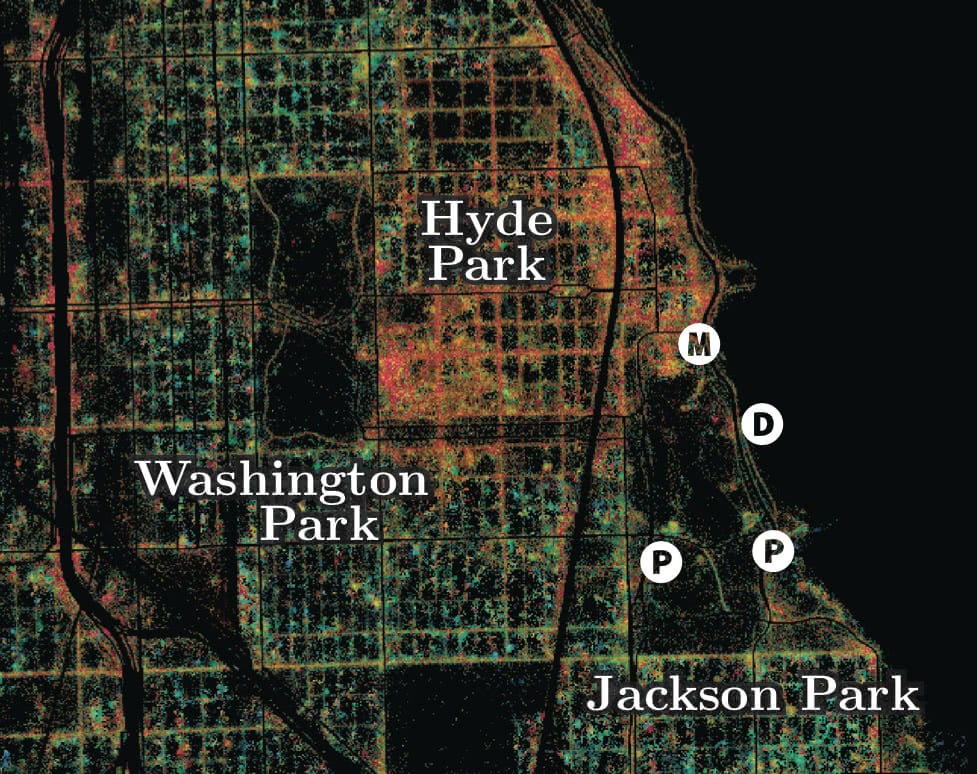
Empirical use from GPS mobility data for the Hyde Park neighborhood of Chicago. The coloring shows levels of spatial mixing between individuals from neighborhoods with different racial compositions: red is more racial mixing and blue is less. The intensity shows levels of activity that in the park are highest at the museum (M) dog park (D) and parking lots (P).
A simple visit confirms that this is in fact the case. Why? Partying. Tailgating. Playing music and watching the lagoon. Simply put the parking lots are among the park's most accessible locations. These spaces are used for drinking and park advocates (reasonably) bemoan the clean-up that this entails. But if parking lots are among the most-used features perhaps the question should be how to improve the experiences and facilities for these users. How can the spaces be arranged to (smoothly) serve the function that users have adopted?
GPS data make it possible for city planners to measure which neighborhoods are well or ill served with parks and other public resources – gaps and inequity in resource provision. It can help them to separate spatial accessibility from other impediments to use. Conversely the data reveal which amenities drive use and can help inform the design of public space.
{1} Potential access is estimated using General Estimating Equations (GEE) clustered at the Census tract level. This is similar to a gravity model calibrated separately for each city.
Looking to boost your Spatial Data Science skills? Download the free ebook today!

.jpg)


.png)