

Self-service spatial analytics with user-defined parameters


“Democratizing Geospatial” has been a buzz phrase in geospatial for a while. It’s about lowering - or shifting - the barrier to entry for spatial analysis so that you no longer need years of training in GIS to turn spatial data into insights for decision-making.
We’re now in what is called the “third wave” of this evolution. The first wave was a shift from static, paper maps to dynamic and interactive digital products. The second wave was about opening up spatial data for custom applications and the wider data analyst user base, through products such as Google Maps API.
So what is the third wave?
This “movement” puts analytical capabilities in the hands of the end user. This person doesn’t necessarily have strong GIS or data analysis skills; they might be your project manager, your client or your business stakeholder.
The benefit of this is simple. Whenever this end user has a simple question about the data or analysis that has been produced - such as “but what if I only want to know the impacts on weekdays?” - they can investigate themselves. This cuts down on a huge amount of time for the analyst behind the map - they can concentrate on the more complex analytics, rather than doing basic spatial fact finding. This can also have benefits in terms of processing time and costs - but more on that later!
CARTO is committed to developing solutions and functions centered on the user, and we’re really excited about our latest development: user-defined parameters!
These parameters allow users - whether editing or just viewing a map - to filter and manipulate their data, allowing your end user to undertake data exploration in a controlled way.
Take the example below.
This visualization shows the normalized difference between taxi pickups and dropoffs. When the value is nearer 1 (green), there are far more pickups in relation to dropoffs. When the value is nearer -1 (orange), the reverse is true. Where it’s closer to zero (grey), there are roughly the same number of pickups and dropoffs, which is more ideal for driver distribution.
It’s natural that there would be temporal - as well as spatial - trends within this data, so the map creator has added parameters to allow end users to investigate further. Here, we filter the data to just Friday & Saturday evenings and nights, in February.
Explore this visualization yourself here!
In addition to temporal filters, other applications of user-defined parameters could include:
- Filtering locations by mobile data speed and operator to understand network optimization opportunities - explore this example to see this in action!
- Exploring residential locations which use - or are within a distance threshold of - a certain service, such as a store, school or car park.
- Understanding potential CPG merchants for market expansion based on multiple criteria, such as revenue and market propensity for specific products or brands.
So let’s see this in action - make sure you sign up to a free 14-day CARTO trial so you can take user-defined parameters for a spin!
In this example, we’re going to take a look at population change over the last 20 years in Detroit. The spatial patterns of demographics are fundamental to so many business decisions and operations. Whether you’re trying to optimize deliveries or decide the best stores to stock your new product, you need to know where people are.
So, let’s get going! You’ll need a couple of datasets for this, all of which are available for free from our Spatial Data Catalog:
- A study area: this can be anything you want; a country, district or area of operations. In this example, we’ll be exploring the Detroit–Warren–Dearborn Metropolitan Statistical Area, which roughly equates to the metropolitan area of Detroit (see dataset page here). You can even upload a custom area of interest into your cloud data warehouse, or use the CARTO Data Warehouse.
- Population data: we’ll be using WorldPop for this, which is a fantastic source for free open data. There are (at the time of writing!) 2,543 WorldPop datasets in our Spatial Data Catalog, and you can subscribe to any of these for free! These datasets include the total population at either 100-meter or 1-kilometer grids, from the year 2000 to 2020. We’ll be using USA 1-kilometer grids for 2000 and 2020.
Subscribe to these datasets from the Data Observatory in your CARTO Workspace… now let’s do this!
We need to do a bit of pre-processing on our data to enable our users to derive insights from the parameters set up. We’ll be using Spatial SQL to do this - but don’t worry if you’re not confident with SQL, it’s easy to pick up! If you have your own data ready to create parameters from, keep scrolling to the next section!
WorldPop data - and a lot of other datasets held on the Data Observatory - consists of two parts; the geometry data and the attribute data. This structure makes time-based comparisons super easy!
The below code extracts an area of interest (the Detroit–Warren–Dearborn Metropolitan Statistical Area, which has a geoid of 19820), and then extracts the WorldPop 1km grid cells which intersect that boundary. Finally, it joins the population data to these extracted grid cells.
Drop the code below into your SQL console in CARTO Builder (reach this in the Workspace under Maps, then Add source from > Custom Query) to see it in action! Note you’ll need to replace the dummy CARTO connection ID (“xxxxxxxx”) which you can find in the Data Observatory in the “Access In” section of any table you have a subscription to.
You can also run this code in your Google BigQuery console.
This query processes around 2.79 GB of data. At this stage, we recommend writing the query to a table, or even better converting it to a Spatial Index (see this guide for a step-by-step tutorial). These are global, multi-resolution grids which are georeferenced by a short string, rather than a long geometry description. This makes them super lightweight for storage and analysis - ideal!
We’ve converted our example to H3 index, meaning our query now is just 435 KB - check it out below!

A visualization showing population density using a H3 spatial index. Explore in full screen here.
You can learn how to leverage Spatial Indexes as a support geography in our free ebook - Spatial Indexes 101!

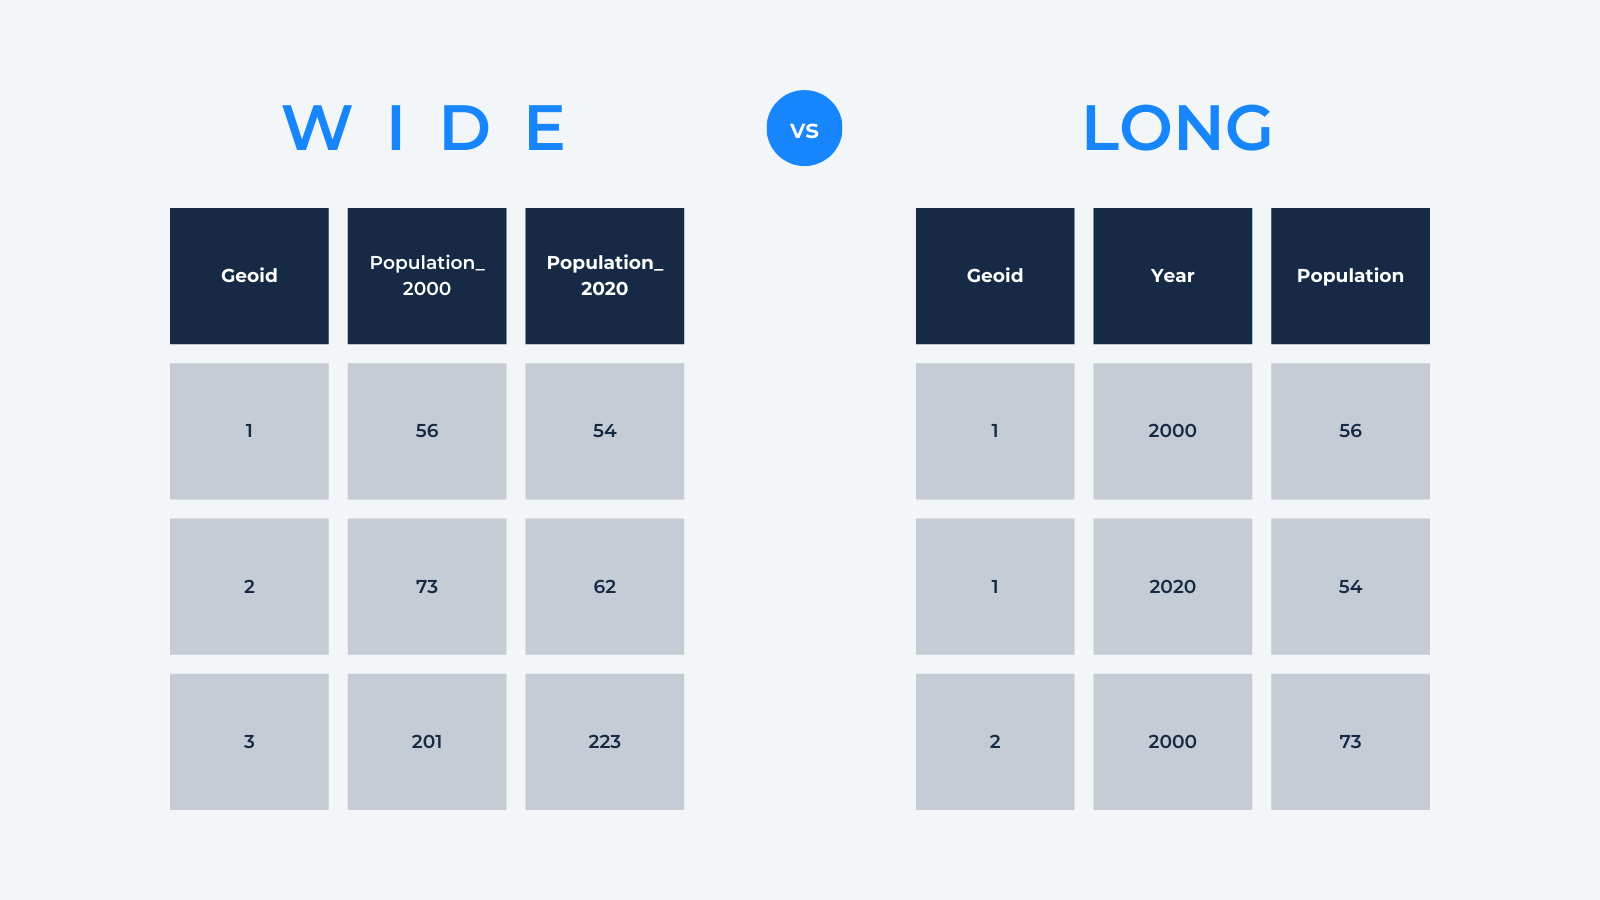
The final bit of pre-processing needed is to convert our table from a wide to a tall format. In a wide table, variables (here our population by year) are held in distinct columns with a row for each unique feature. In long tables, there are columns for both year and population, with features being repeated.
The SQL code below uses the UNION ALL command to reformat the WorldPop data to a tall format.
Now we have our data ready, we can create a couple of parameters to help our users explore Detroit!
This function will help the user easily switch between our two years of data.
Specific date-based parameters are also available, however these are more suited to more temporarily granular data, as they require users to input exact date ranges.

Now you will see the option in the parameters panel on the right of the screen, giving your user the option to switch between years.
Now you’ve got the basics of user-defined parameters down!
Let’s continue this example with something a little more advanced. Change the fill color of your data to be based on your Population variable. Importantly, make sure to set the color scale to custom so that the scale doesn’t auto-adjust as the user filters the data.
The differences between the two years aren’t too dramatic - but we can use parameters to highlight where these are.
Let’s return to our SQL parameters query one last time.
Next we’re going to add in a parameter to allow our users to filter the data to areas of population growth and decline. To do this, we’ll add a string field to each section of our tall table, using the CASE function to describe whether the population has increased or decreased.
With that query run, we just need to return back to the parameters window and add another text parameter. Call this population_change, and again take the values from this SQL query - but this time from the population_change field. Click create parameter, and finally add the following parameter section into the end of your query.
You can see another great advantage of parameters here; any number of parameters can be built into just one SQL query. If the user wants to investigate 10 different variables in your data, you can build parameter functionality into just one query, rather than create 10 different queries - saving you processing costs too!
Finally, republish your map - and get sharing! Explore our example below, or in full screen here!

This map provides really interesting insights into the population changes across the study area, with one notable observation being the “solid” population decline across Wayne County in the southern part of the map. This potentially indicates a change in the data in this county across our time period; perhaps a change in data collection or reporting methods?
People are often concerned that the democratization of geospatial puts the security of our jobs at risk. This example shows exactly why that isn’t the case. As the data analyst, your role is to control the data and analytical options available to your user, to avoid confusion or misinterpretation in cases like this.
The main challenge of user-defined parameters is the same as its main advantage; that analysis is put in the hands of a non-data expert. The use of user-defined parameters requires careful consideration of factors such as data quality, complexity, and spatial scale. Additionally, data literacy among end-users can vary, so it's important to provide ample information to help them easily interpret the analysis results.
You should provide relevant information about the parameter’s data source and the analysis it has gone through. This could be achieved through pop-ups, layer and parameter naming and supporting narrative.
🌐 🌐 🌐
The third wave of democratizing geospatial has brought many advances, with self-service spatial analytics like this being a powerful example. User-defined parameters allow end users to filter and manipulate their data to derive insights easily, saving time for data analysts and end users alike. They also have the advantage of optimizing queries on your cloud data warehouse.
We can’t wait to see what you create with them! If you’d like to see more of these in action, don’t hesitate to get in touch for a live demo from our team of experts!


