Example - Building a Custom Basemap through Styling - Part 2
Learn how to create a custom Game of Thrones basemap with Builder.
Resources
*All thematic data was built from the gvSIG’s ebook, Learning GIS with Game of Thrones. Textures and icons were created from Textures and The Noun Project websites.
Getting started
- Import the template .carto file to your account.
- Open the map.
- Rename your map as Game of Thrones Basemap.
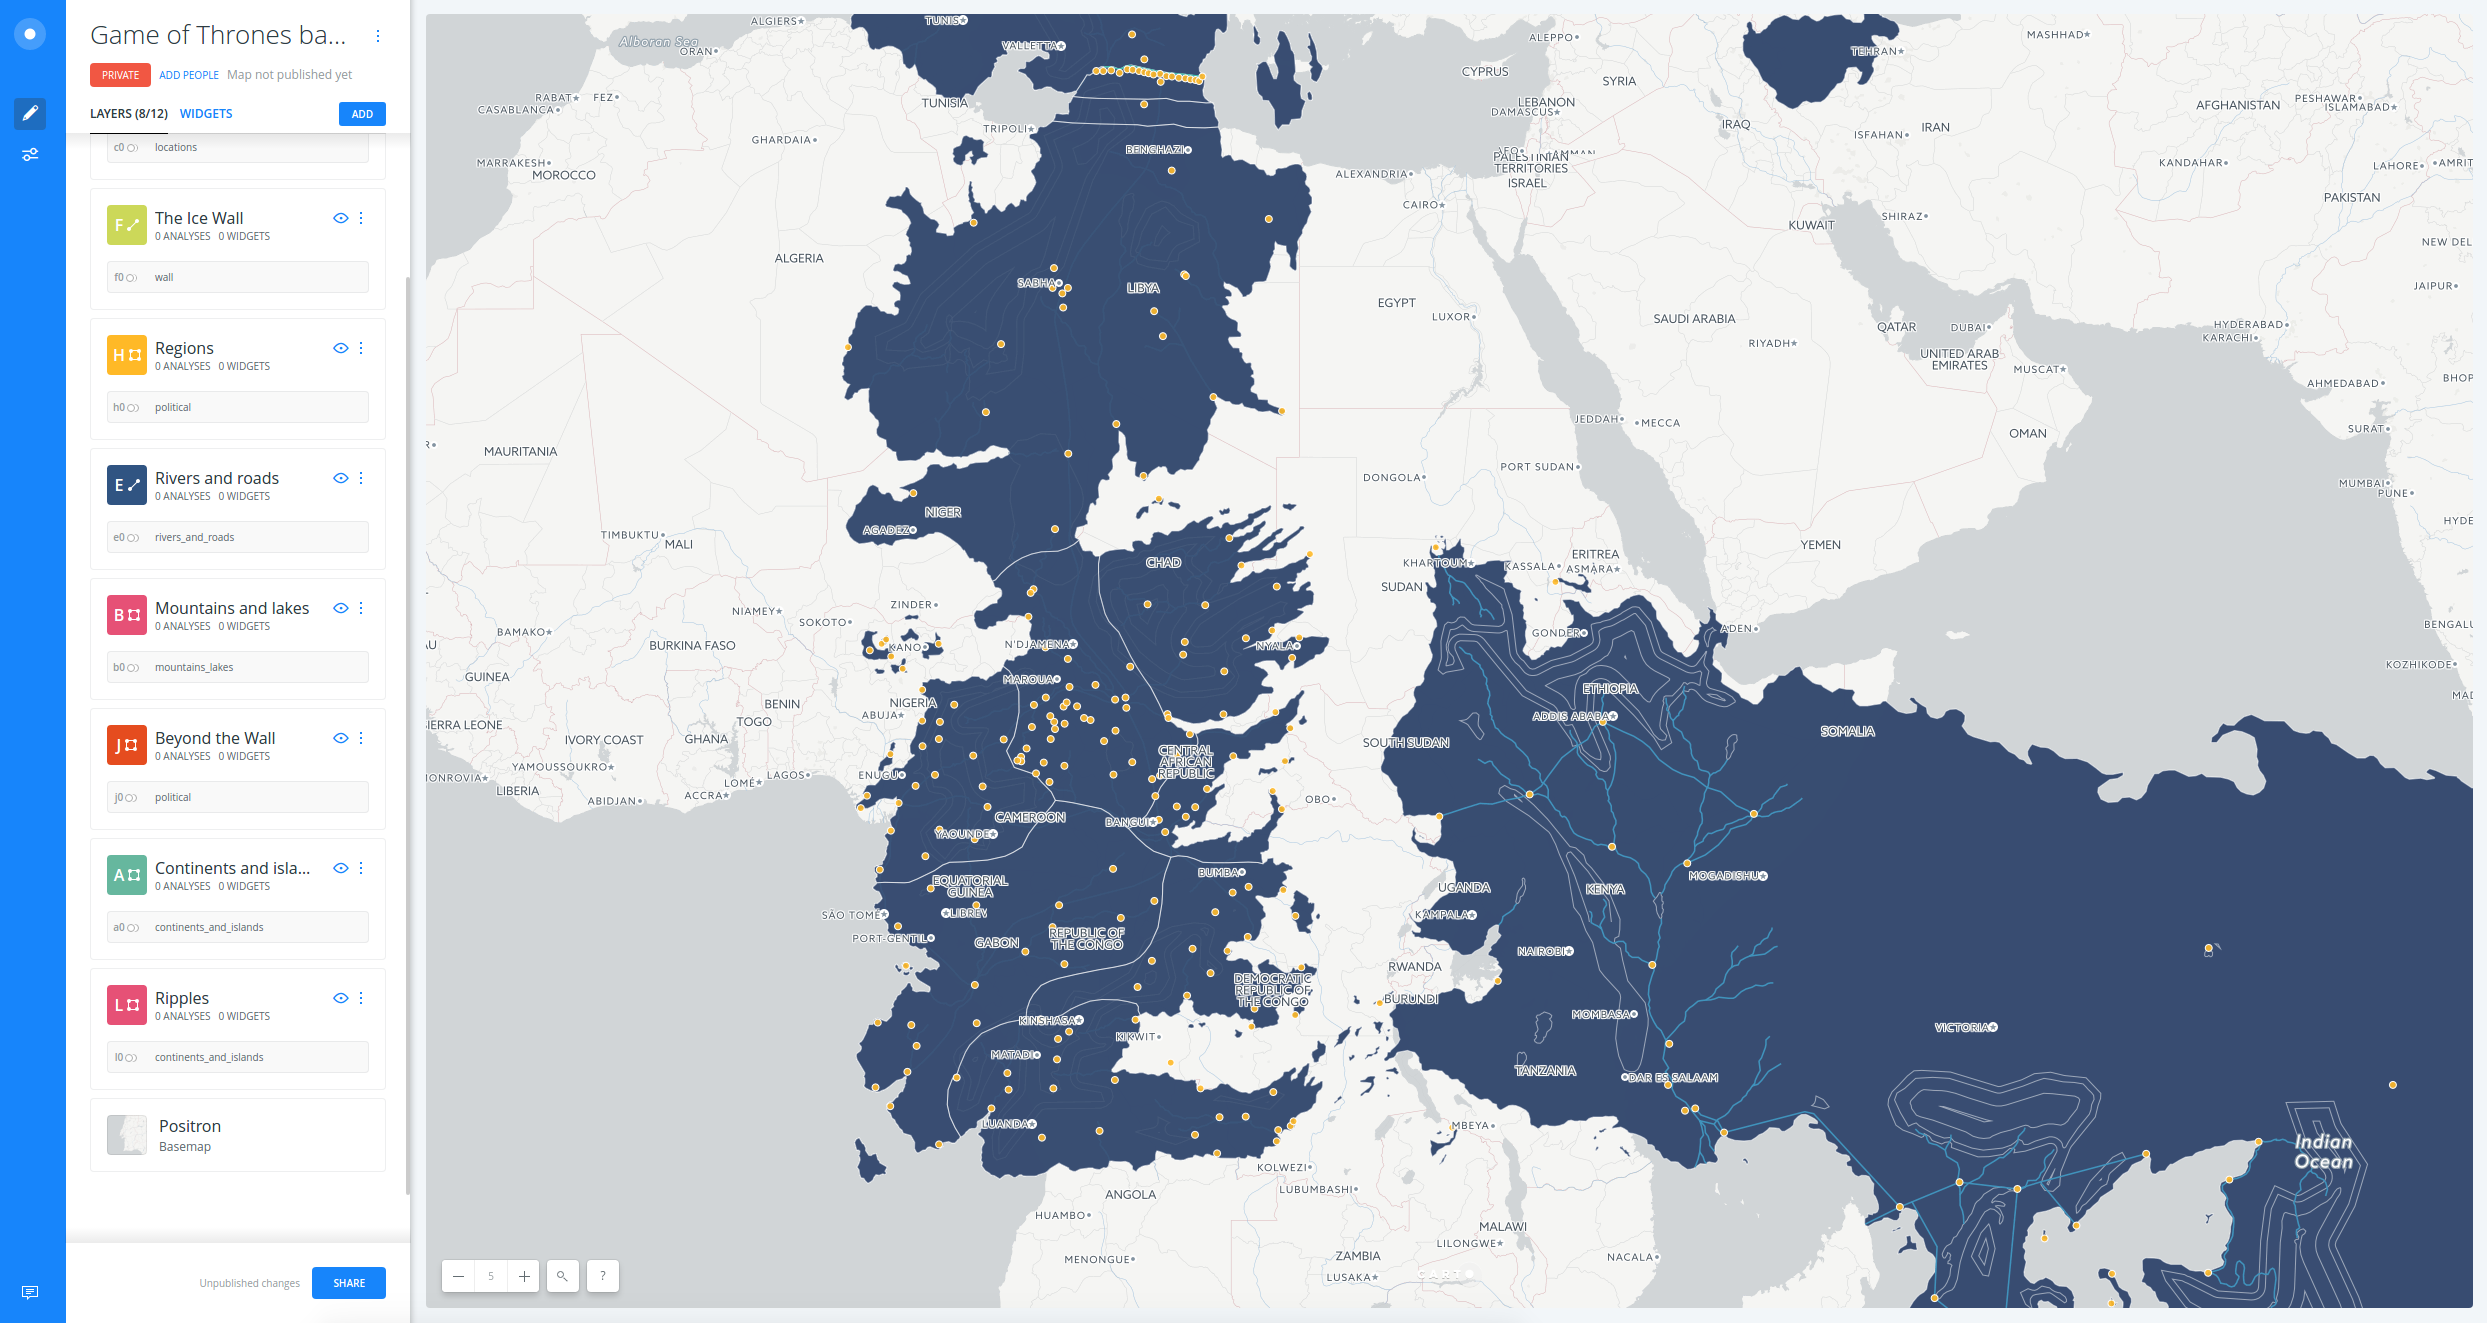
- Make sure that the order and names of your layers are as follows:
locations> Locationswall> The Ice Wallpolitical> Regionsrivers_and_roads> Rivers and roadsmountains_lakes> Mountains and lakespolitical> Beyond the Wallcontinents_and_islands> Continents and islandscontinents_and_islands> Ripples
Ocean and ripples
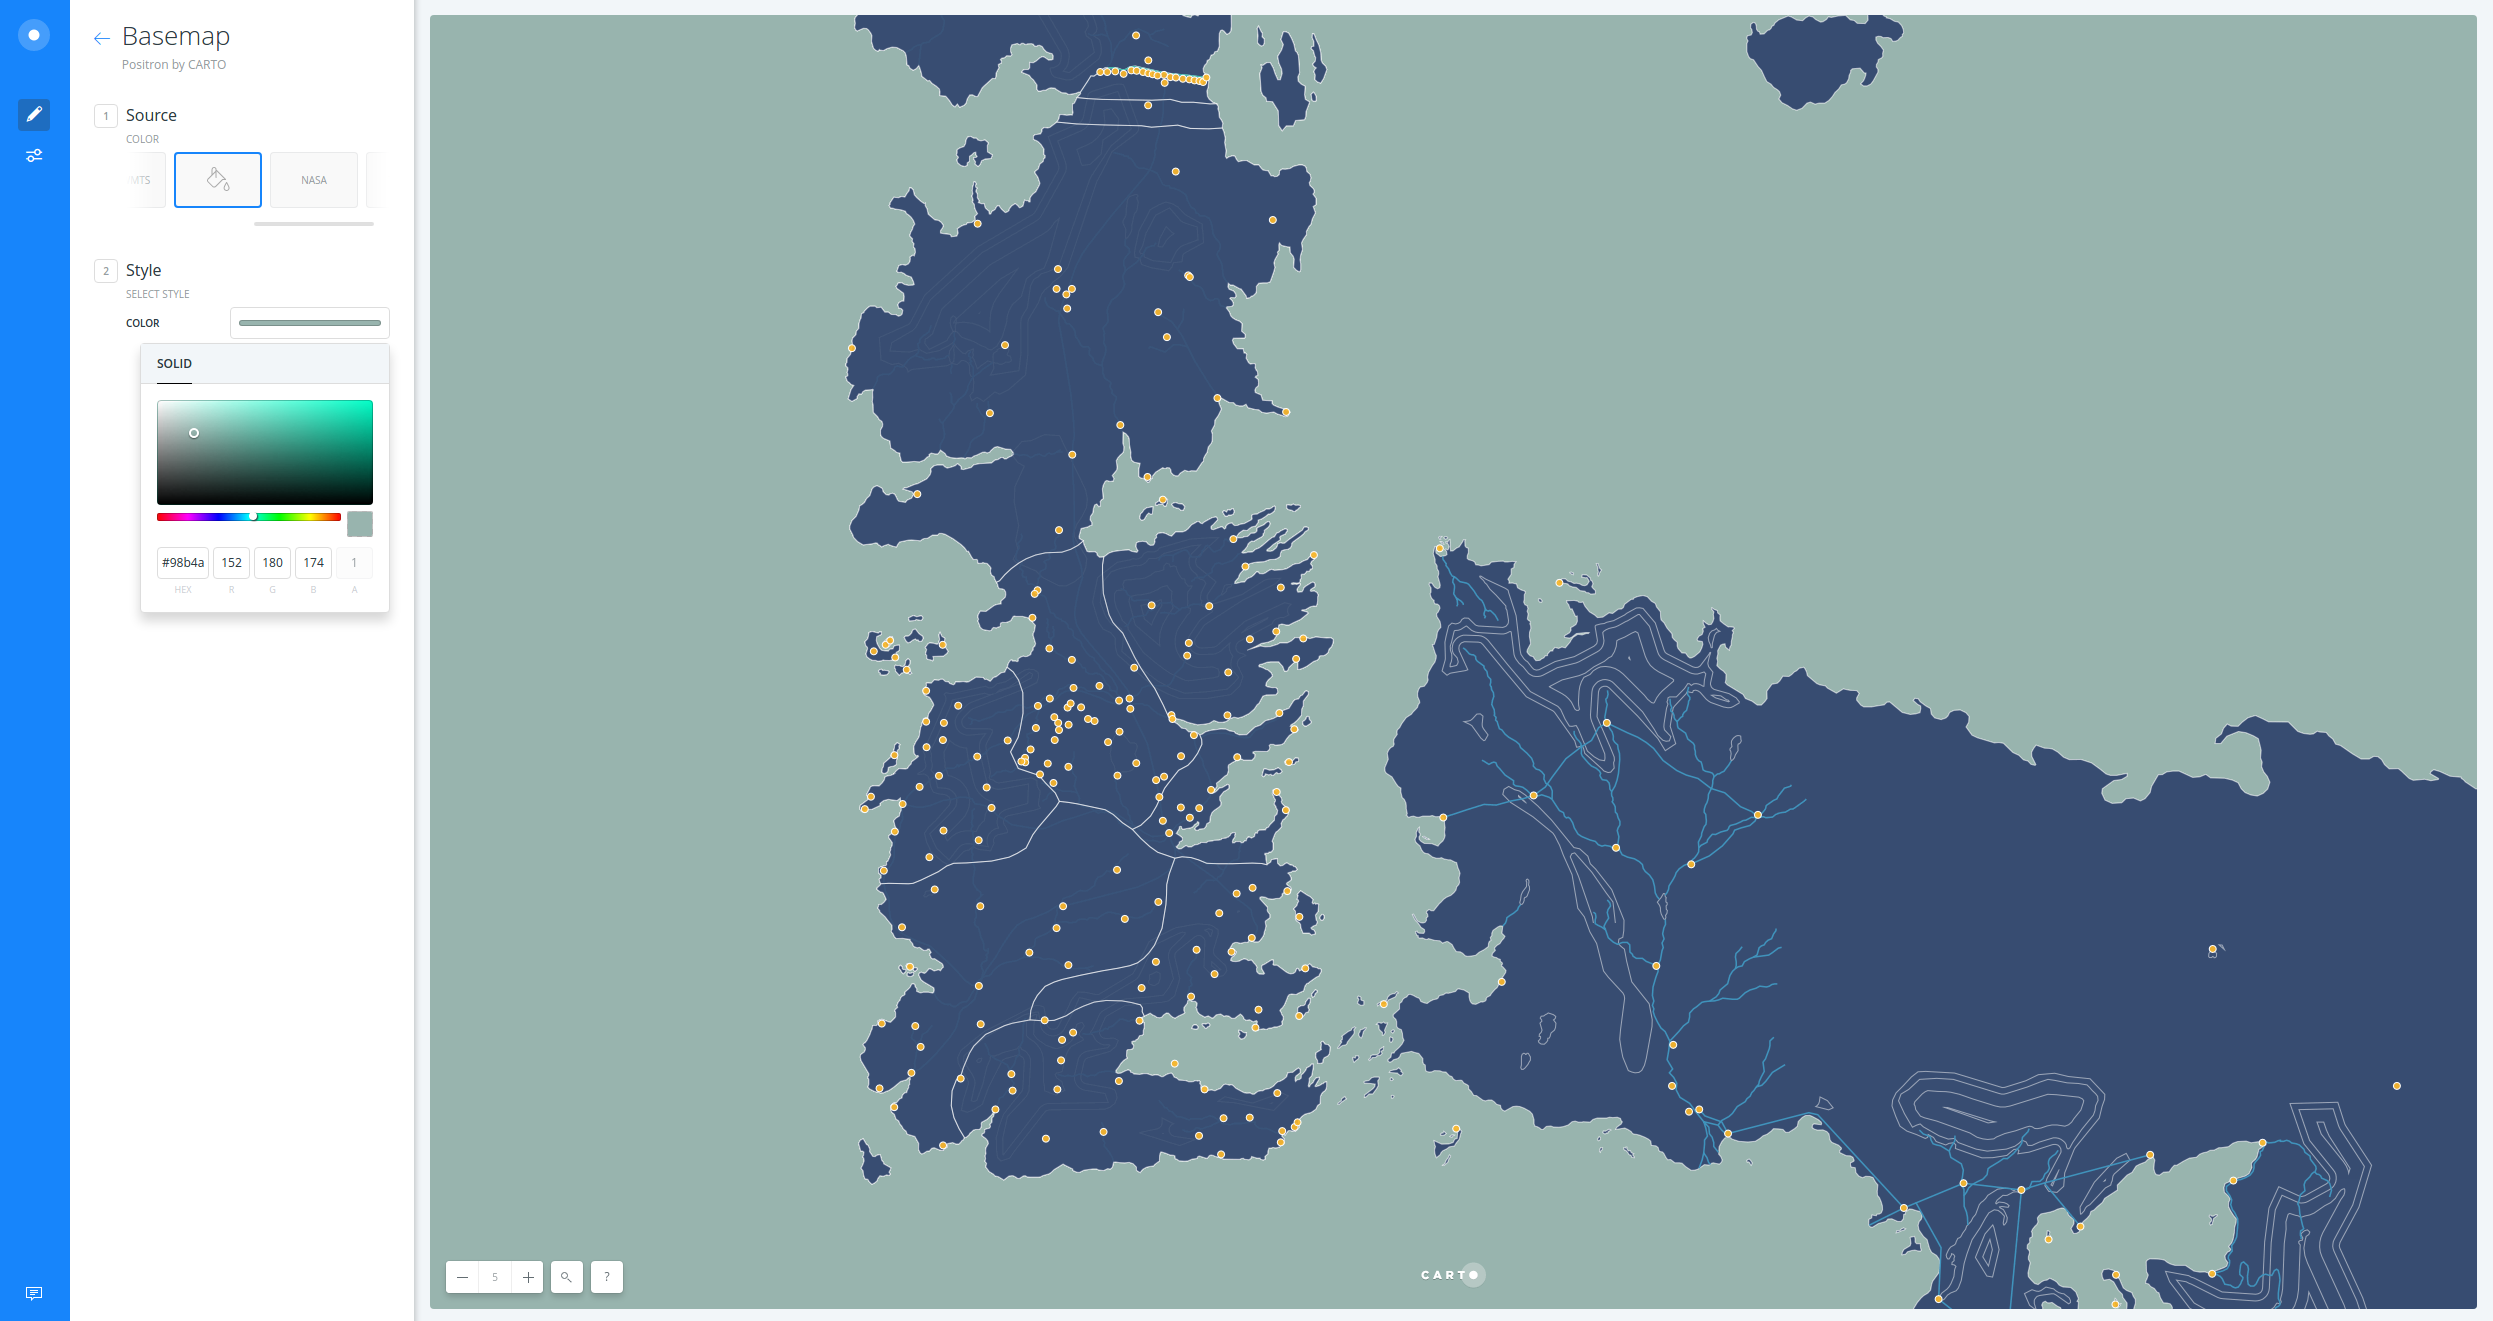
- First, change the basemap:
- Click on the Positron basemap
- Select
COLOR - Replace the default color with
#98b4ae
- In order to create a coastal ripple effect, follow these instructions:
- Click on the Ripples layer and go to the ANALYSIS tab
- Click on ADD ANALYSIS button to add a new analysis
- Select Create Areas of influence
- Click on ADD ANALYSIS
- Set the parameters as follows:
- TYPE:
Distance - UNITS:
mi(miles) - RADIUS:
60 - TRACTS:
4 - BOUNDARIES:
Dissolve(try to useIntact!)
- TYPE:
- Click APPLY
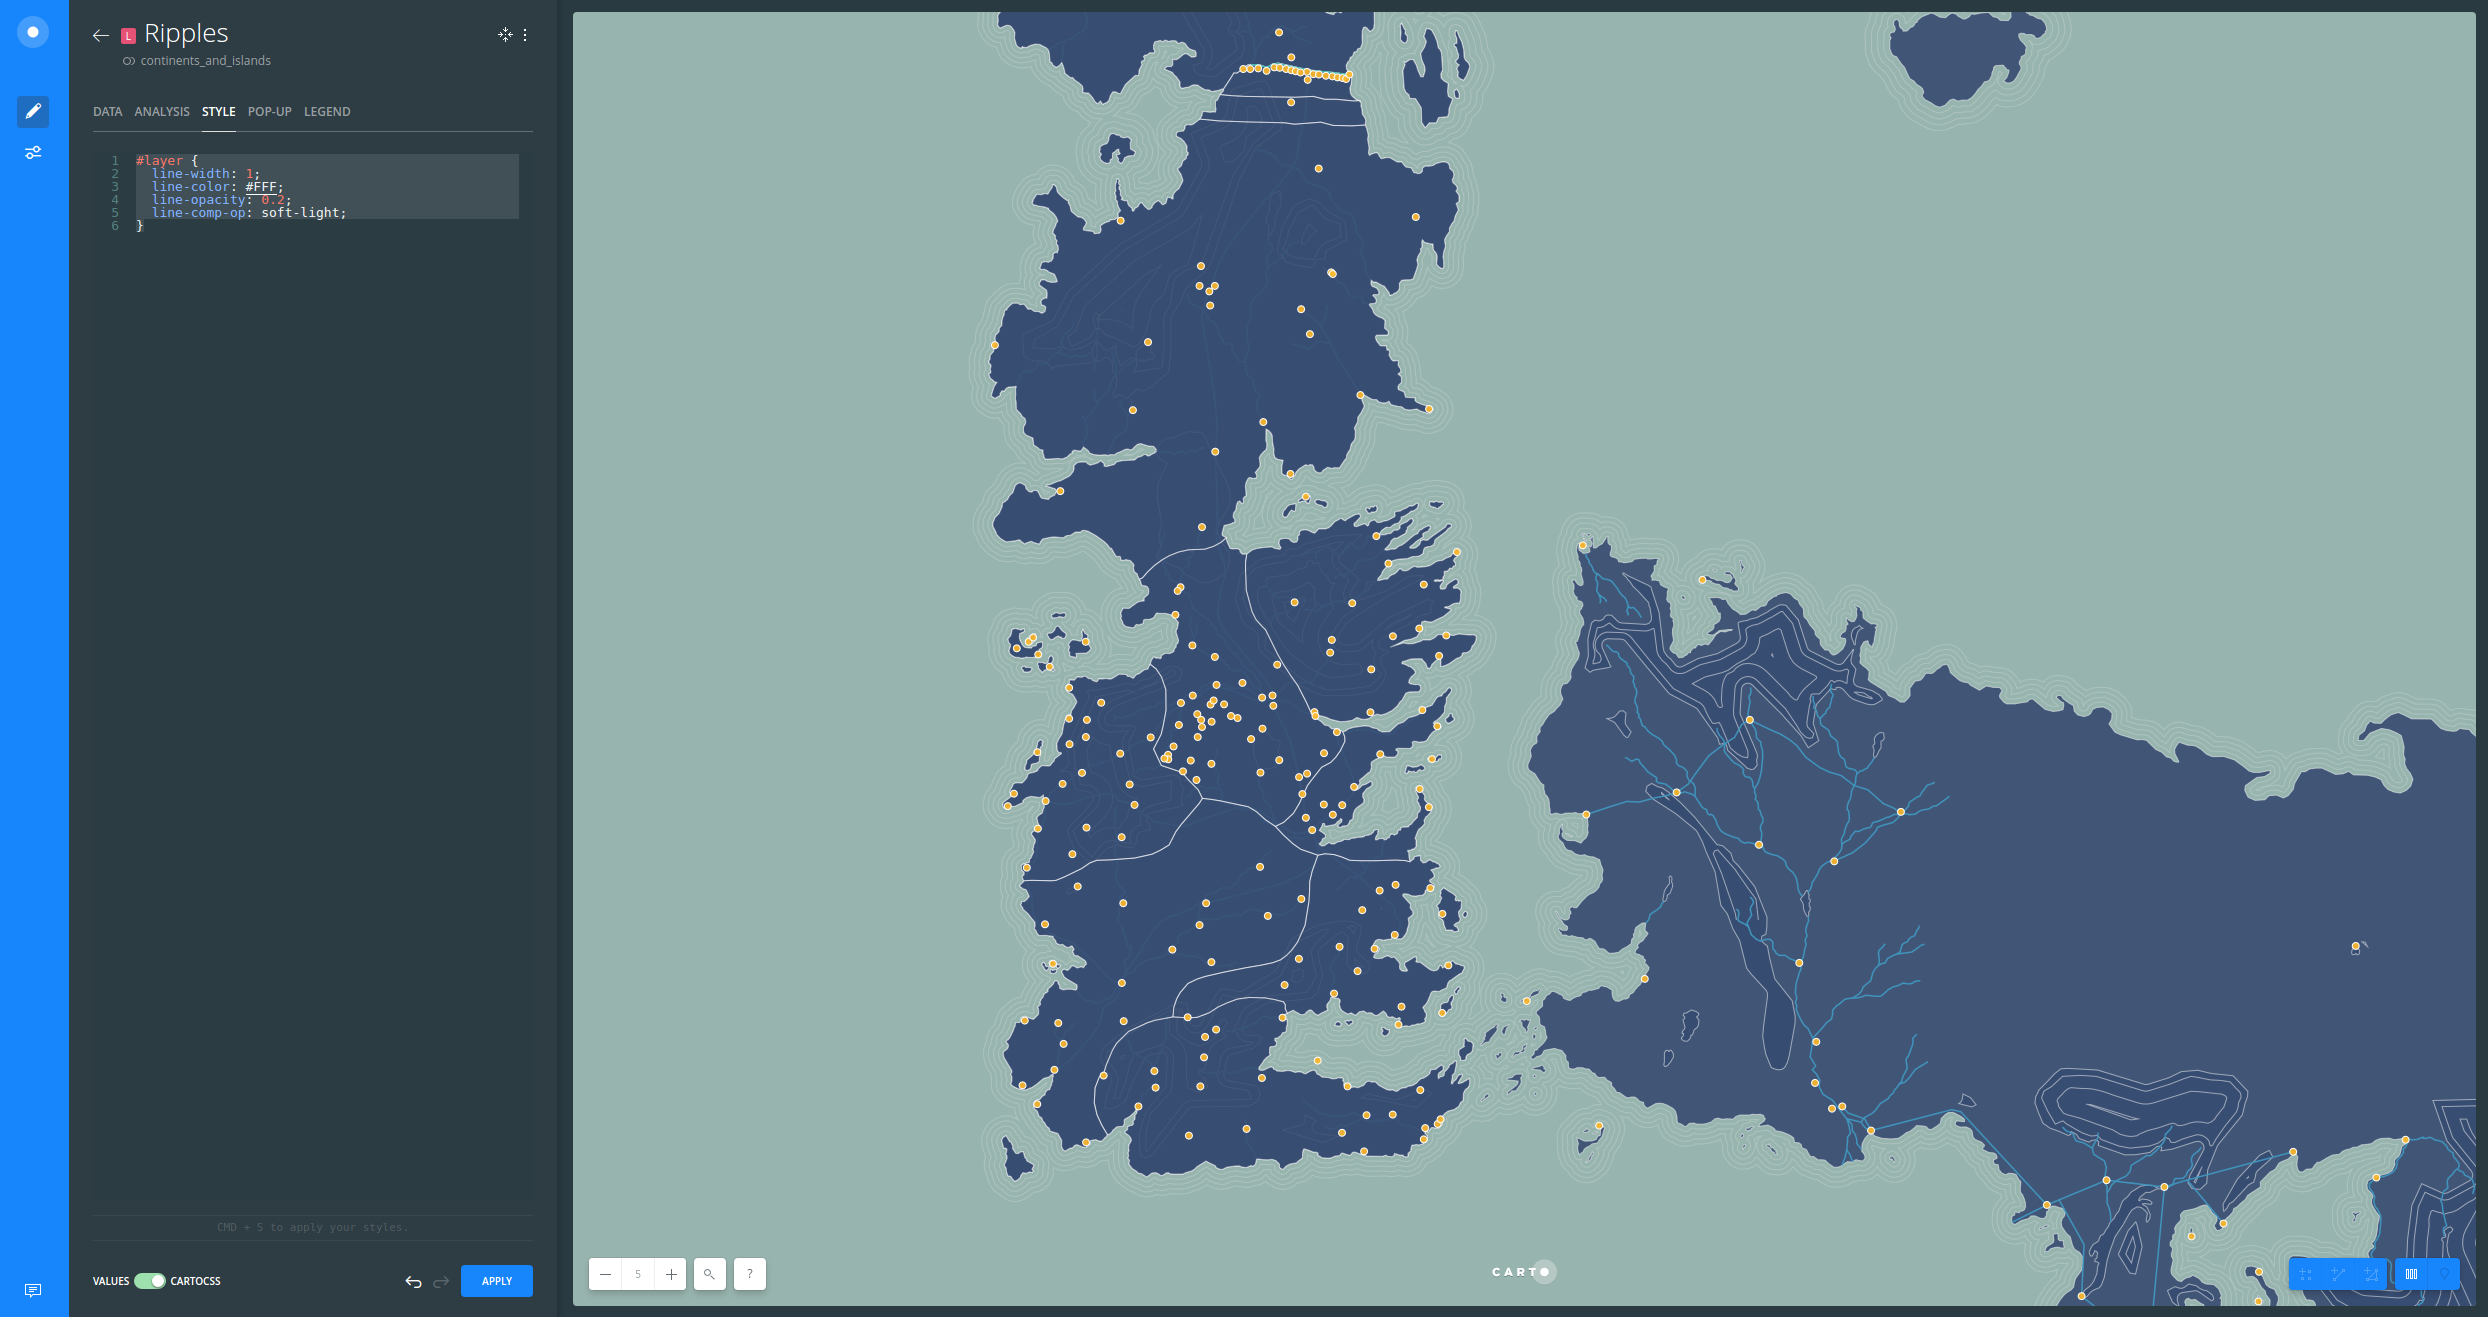
- Go to the STYLE tab and switch from VALUES to CARTOCSS
- Replace the default style with the following one:
#layer {
  line-width: 1;
  line-color: #FFF;
  line-opacity: 0.2;
  line-comp-op: soft-light;
}
soft-lightcomposite operation will soften the parts where two lines overlap when unsingIntactbuffers.
- Click APPLY
Continents and islands
- Hide all layers from your Map View except for Continents and islands
- In order to style the land, follow these steps:
- Click on Continents and islands layer
- Switch from VALUES to CARTOCSS
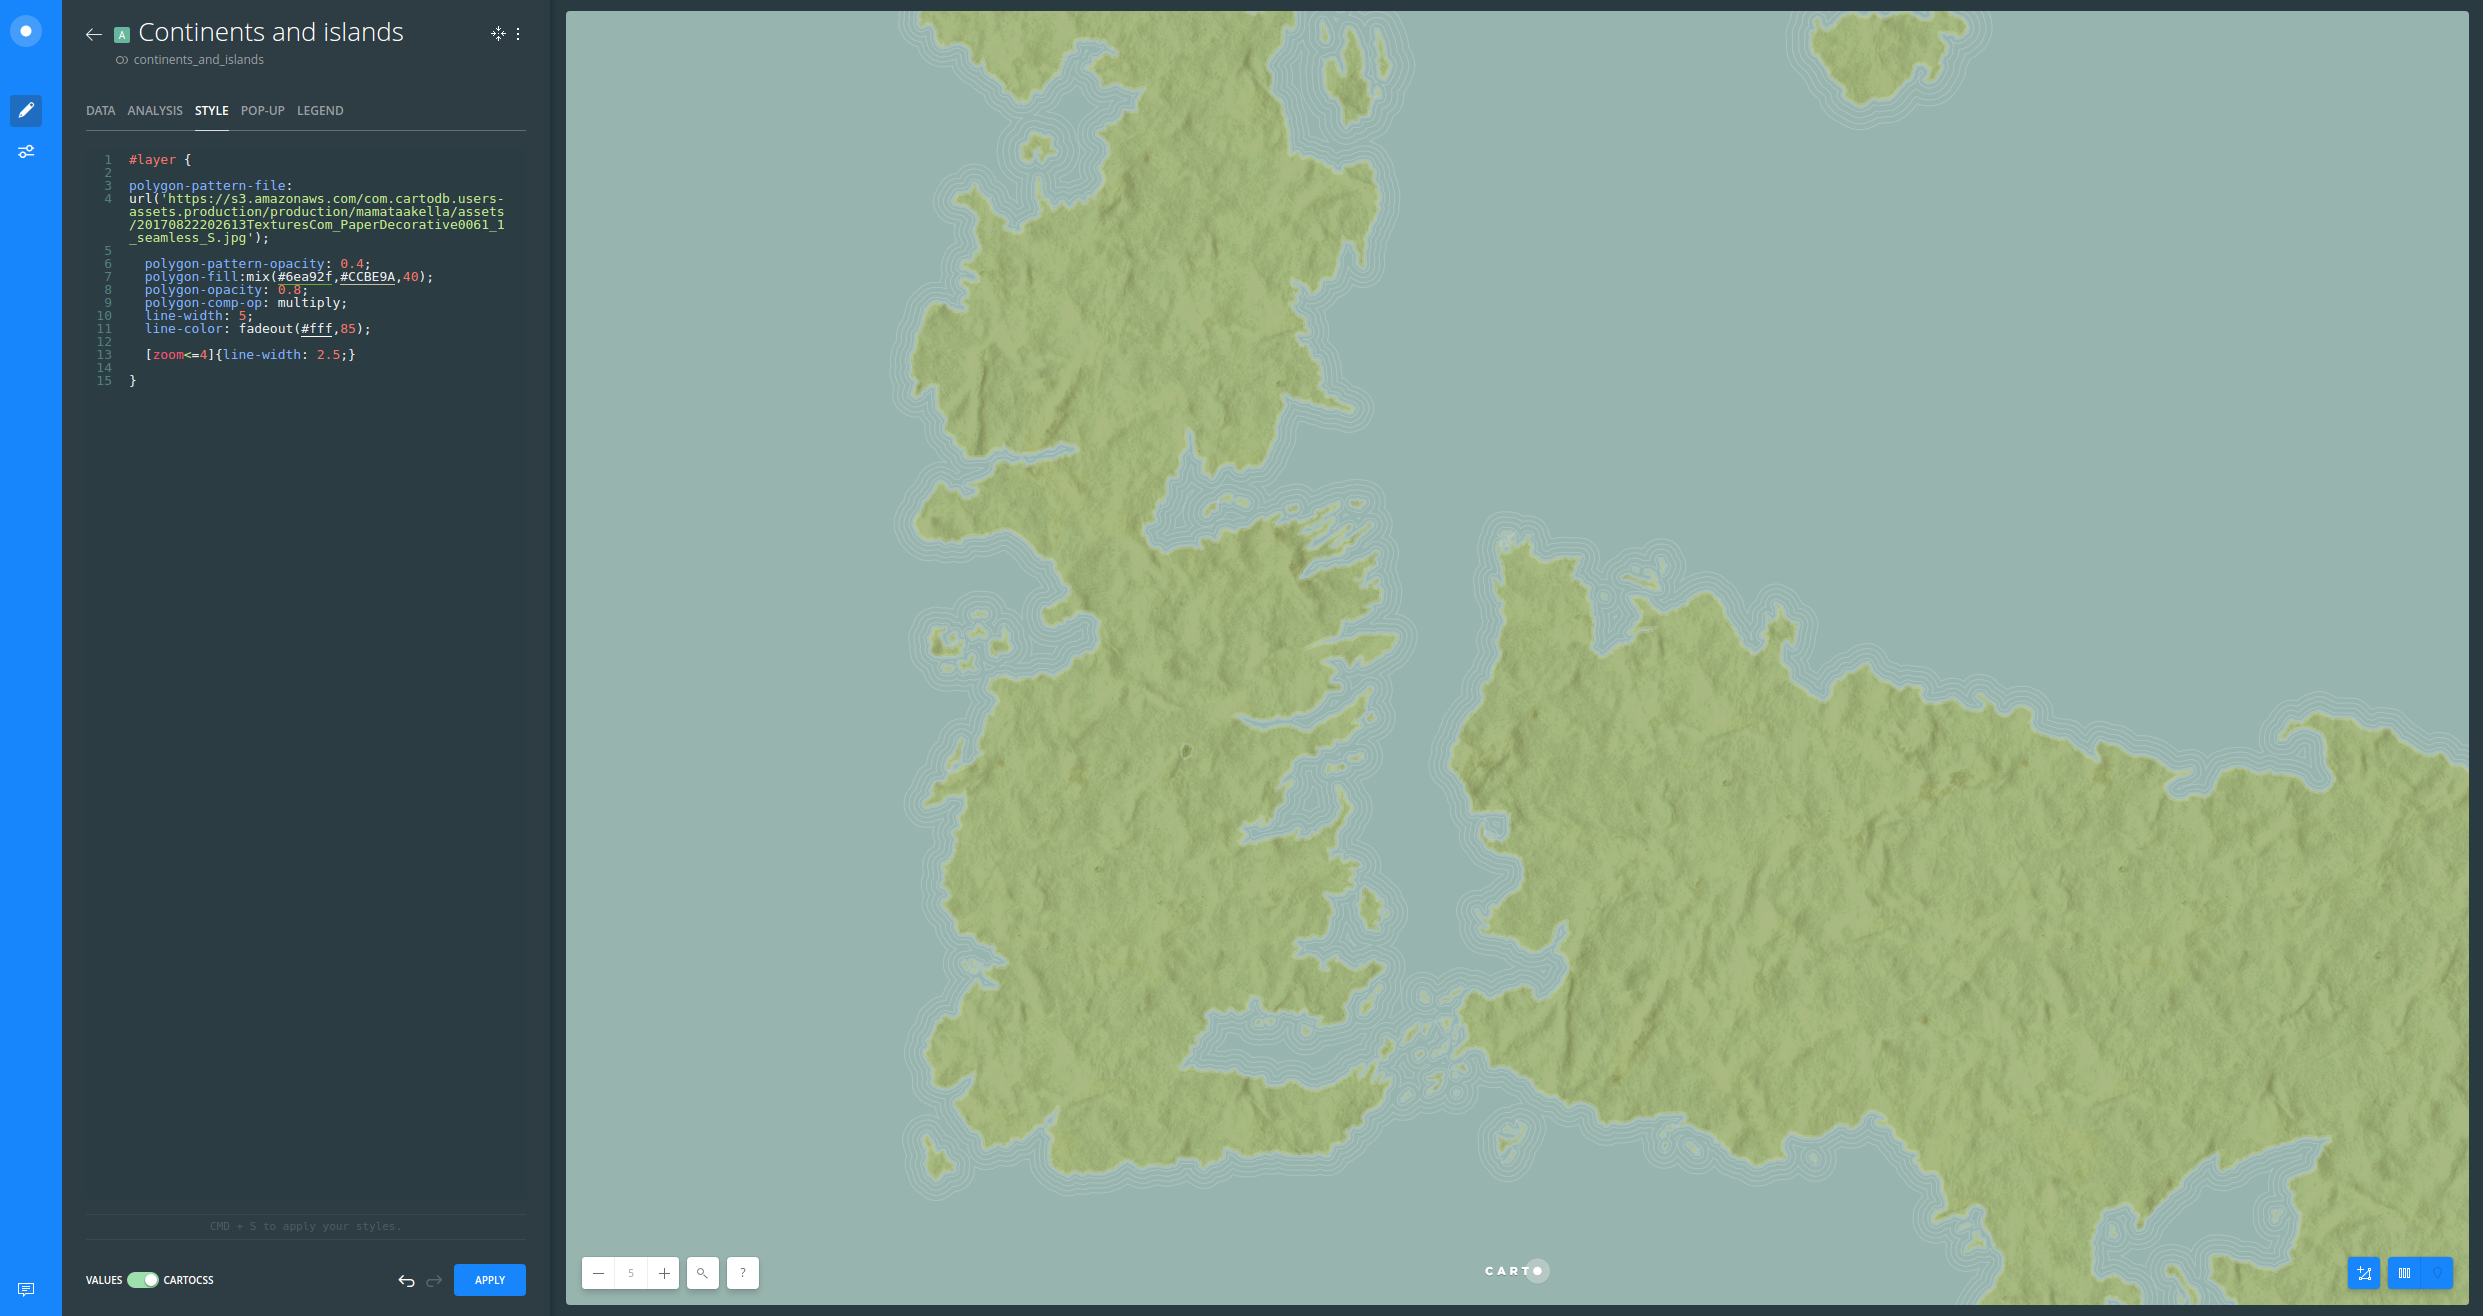
- Replace the default style with the following:
#layer {
  polygon-pattern-file:
  url('https://s3.amazonaws.com/com.cartodb.users-assets.production/production/mamataakella/assets/20170822202613TexturesCom_PaperDecorative0061_1_seamless_S.jpg');
  polygon-pattern-opacity: 0.4;
  polygon-fill:mix(#6ea92f,#CCBE9A,40);
  polygon-opacity: 0.8;
  polygon-comp-op: multiply;
  line-width: 5;
  line-color: fadeout(#fff,85);

  [zoom<=4]{line-width: 2.5;}
}
As you can see, the pattern we have given to the land has a feeling of rugosity. Also, mixing two colors in the
polygon-fillproperty and usingfadeoutto simulate the end of the land masses are good cartography tricks.
- Click APPLY
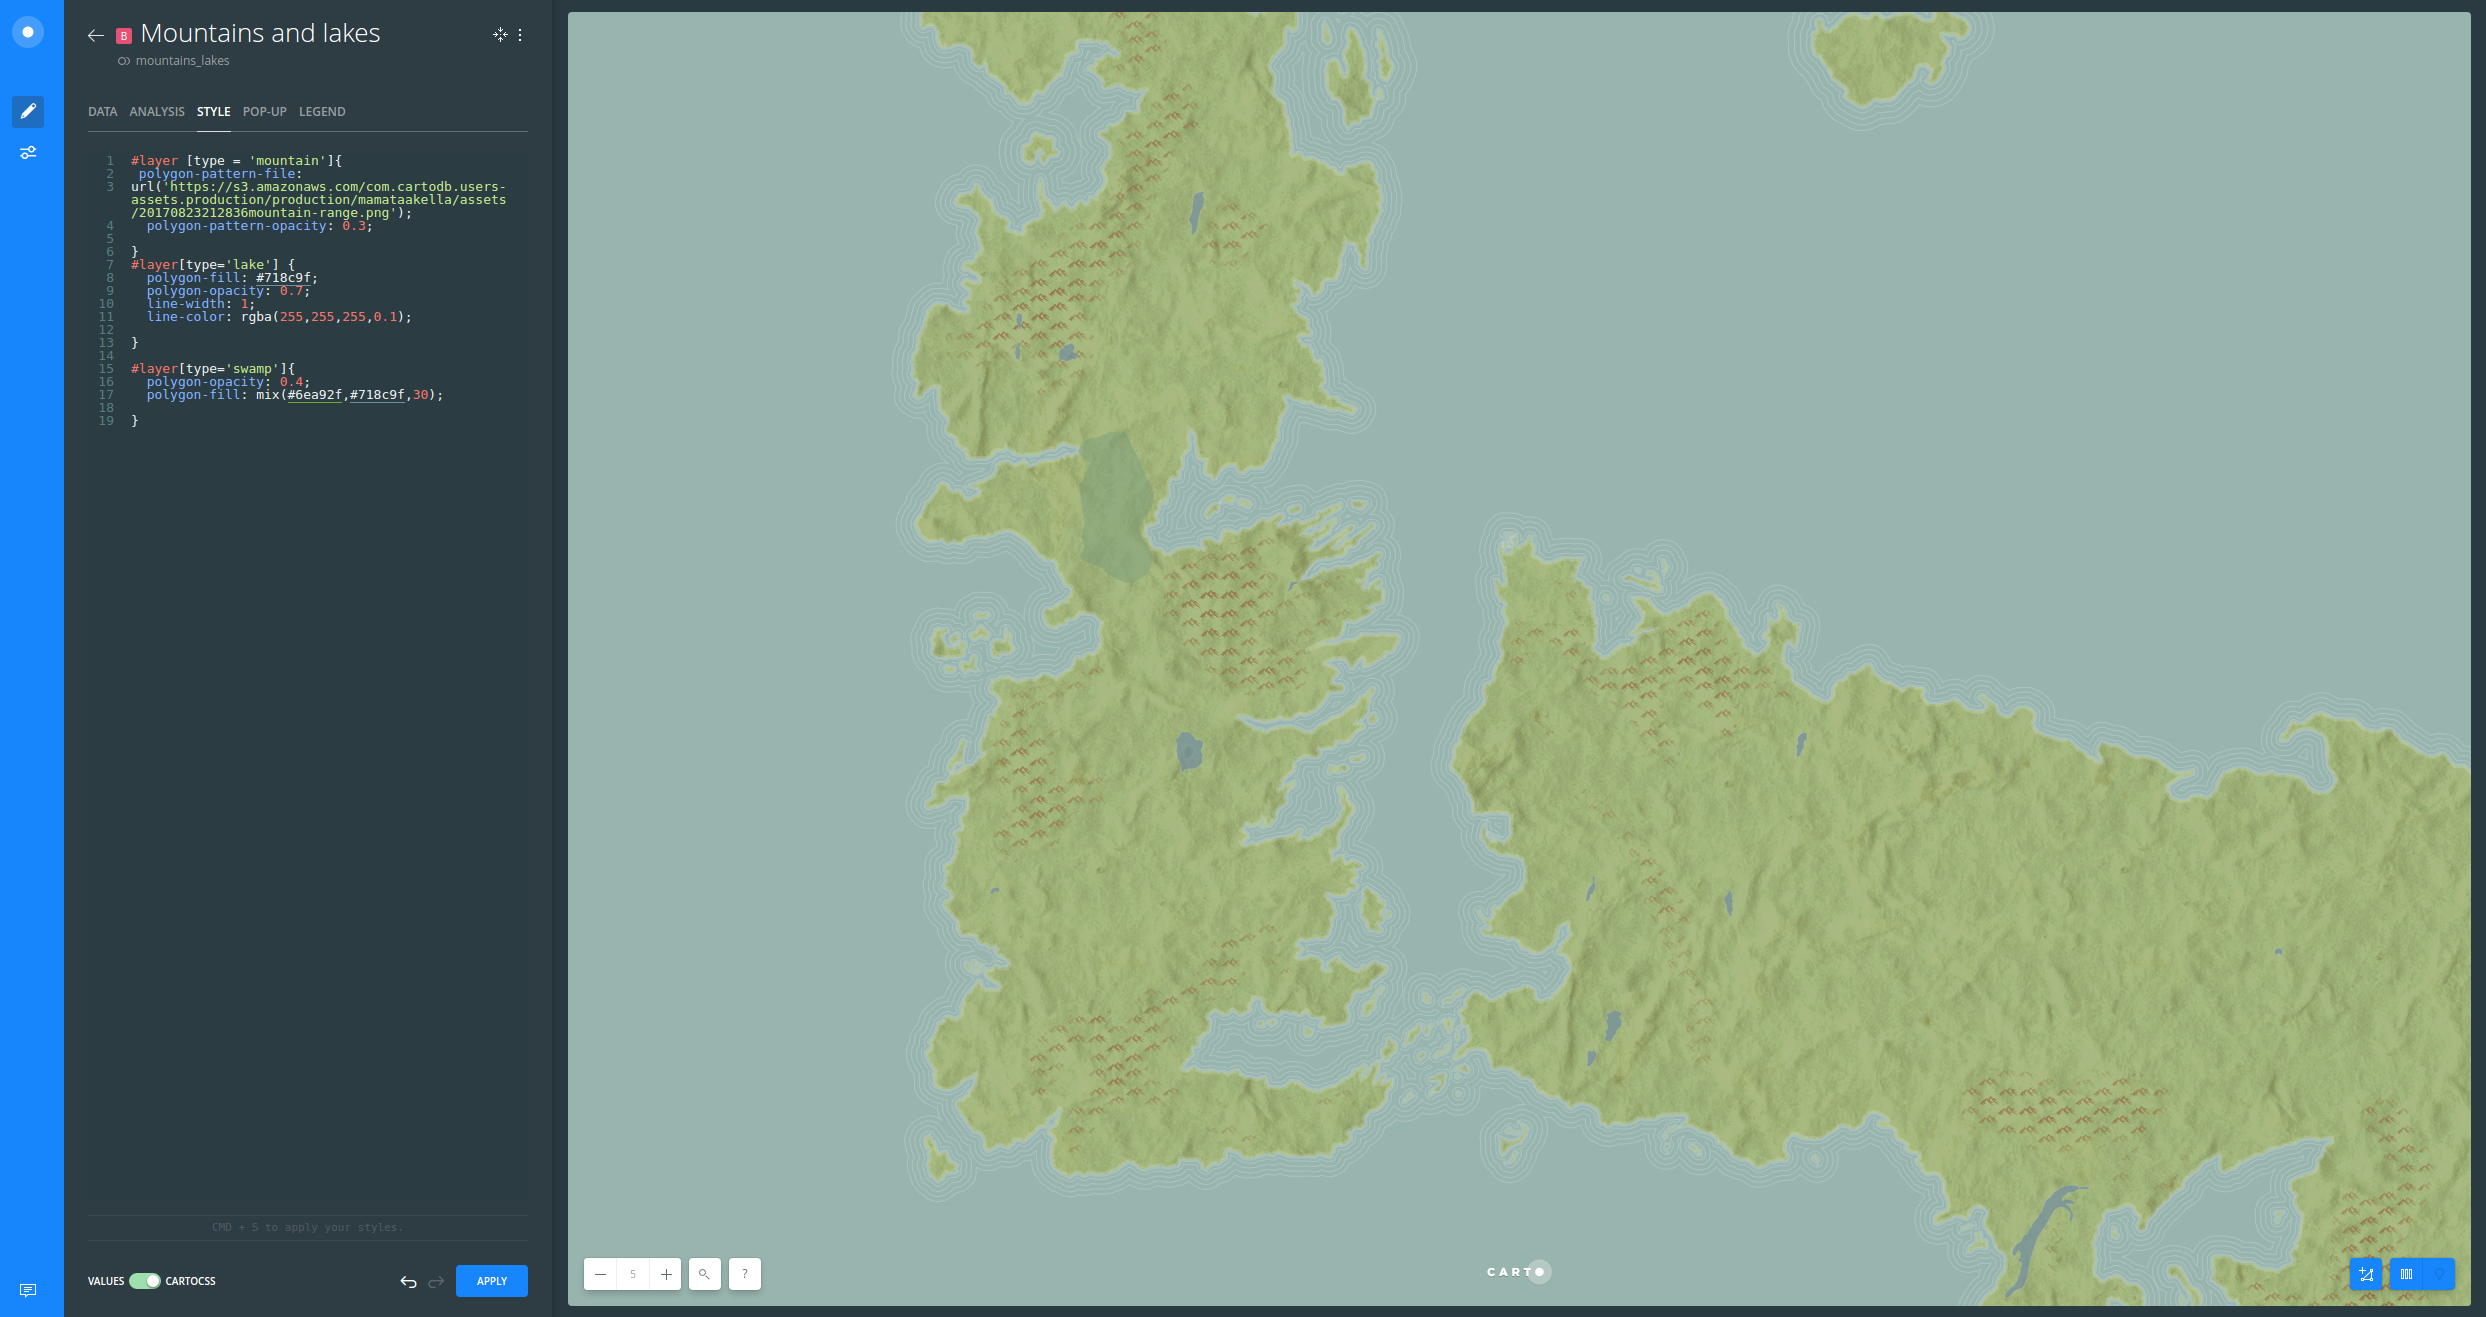
Mountains and lakes
- Show the Mountains and lakes layers from the Map View
- Again, follow these instructions to style this layer:
- Click on Continents and islands layer
- Switch from VALUES to CARTOCSS
- Replace the default style with the following:
#layer [type = 'mountain']{
  polygon-pattern-file: url('https://s3.amazonaws.com/com.cartodb.users-assets.production/production/mamataakella/assets/20170823212836mountain-range.png');
  polygon-pattern-opacity: 0.3;
}

#layer[type='lake'] {
  polygon-fill: #718c9f;
  polygon-opacity: 0.7;
  line-width: 1;
  line-color: rgba(255,255,255,0.1);
}

#layer[type='swamp']{
  polygon-opacity: 0.4;
  polygon-fill: mix(#6ea92f,#718c9f,30);
}
We are using a pattern with a grid of mountain icons to emulate mountain ranges. In addition, swamps were colored mixing water and ground colors.
- Click APPLY
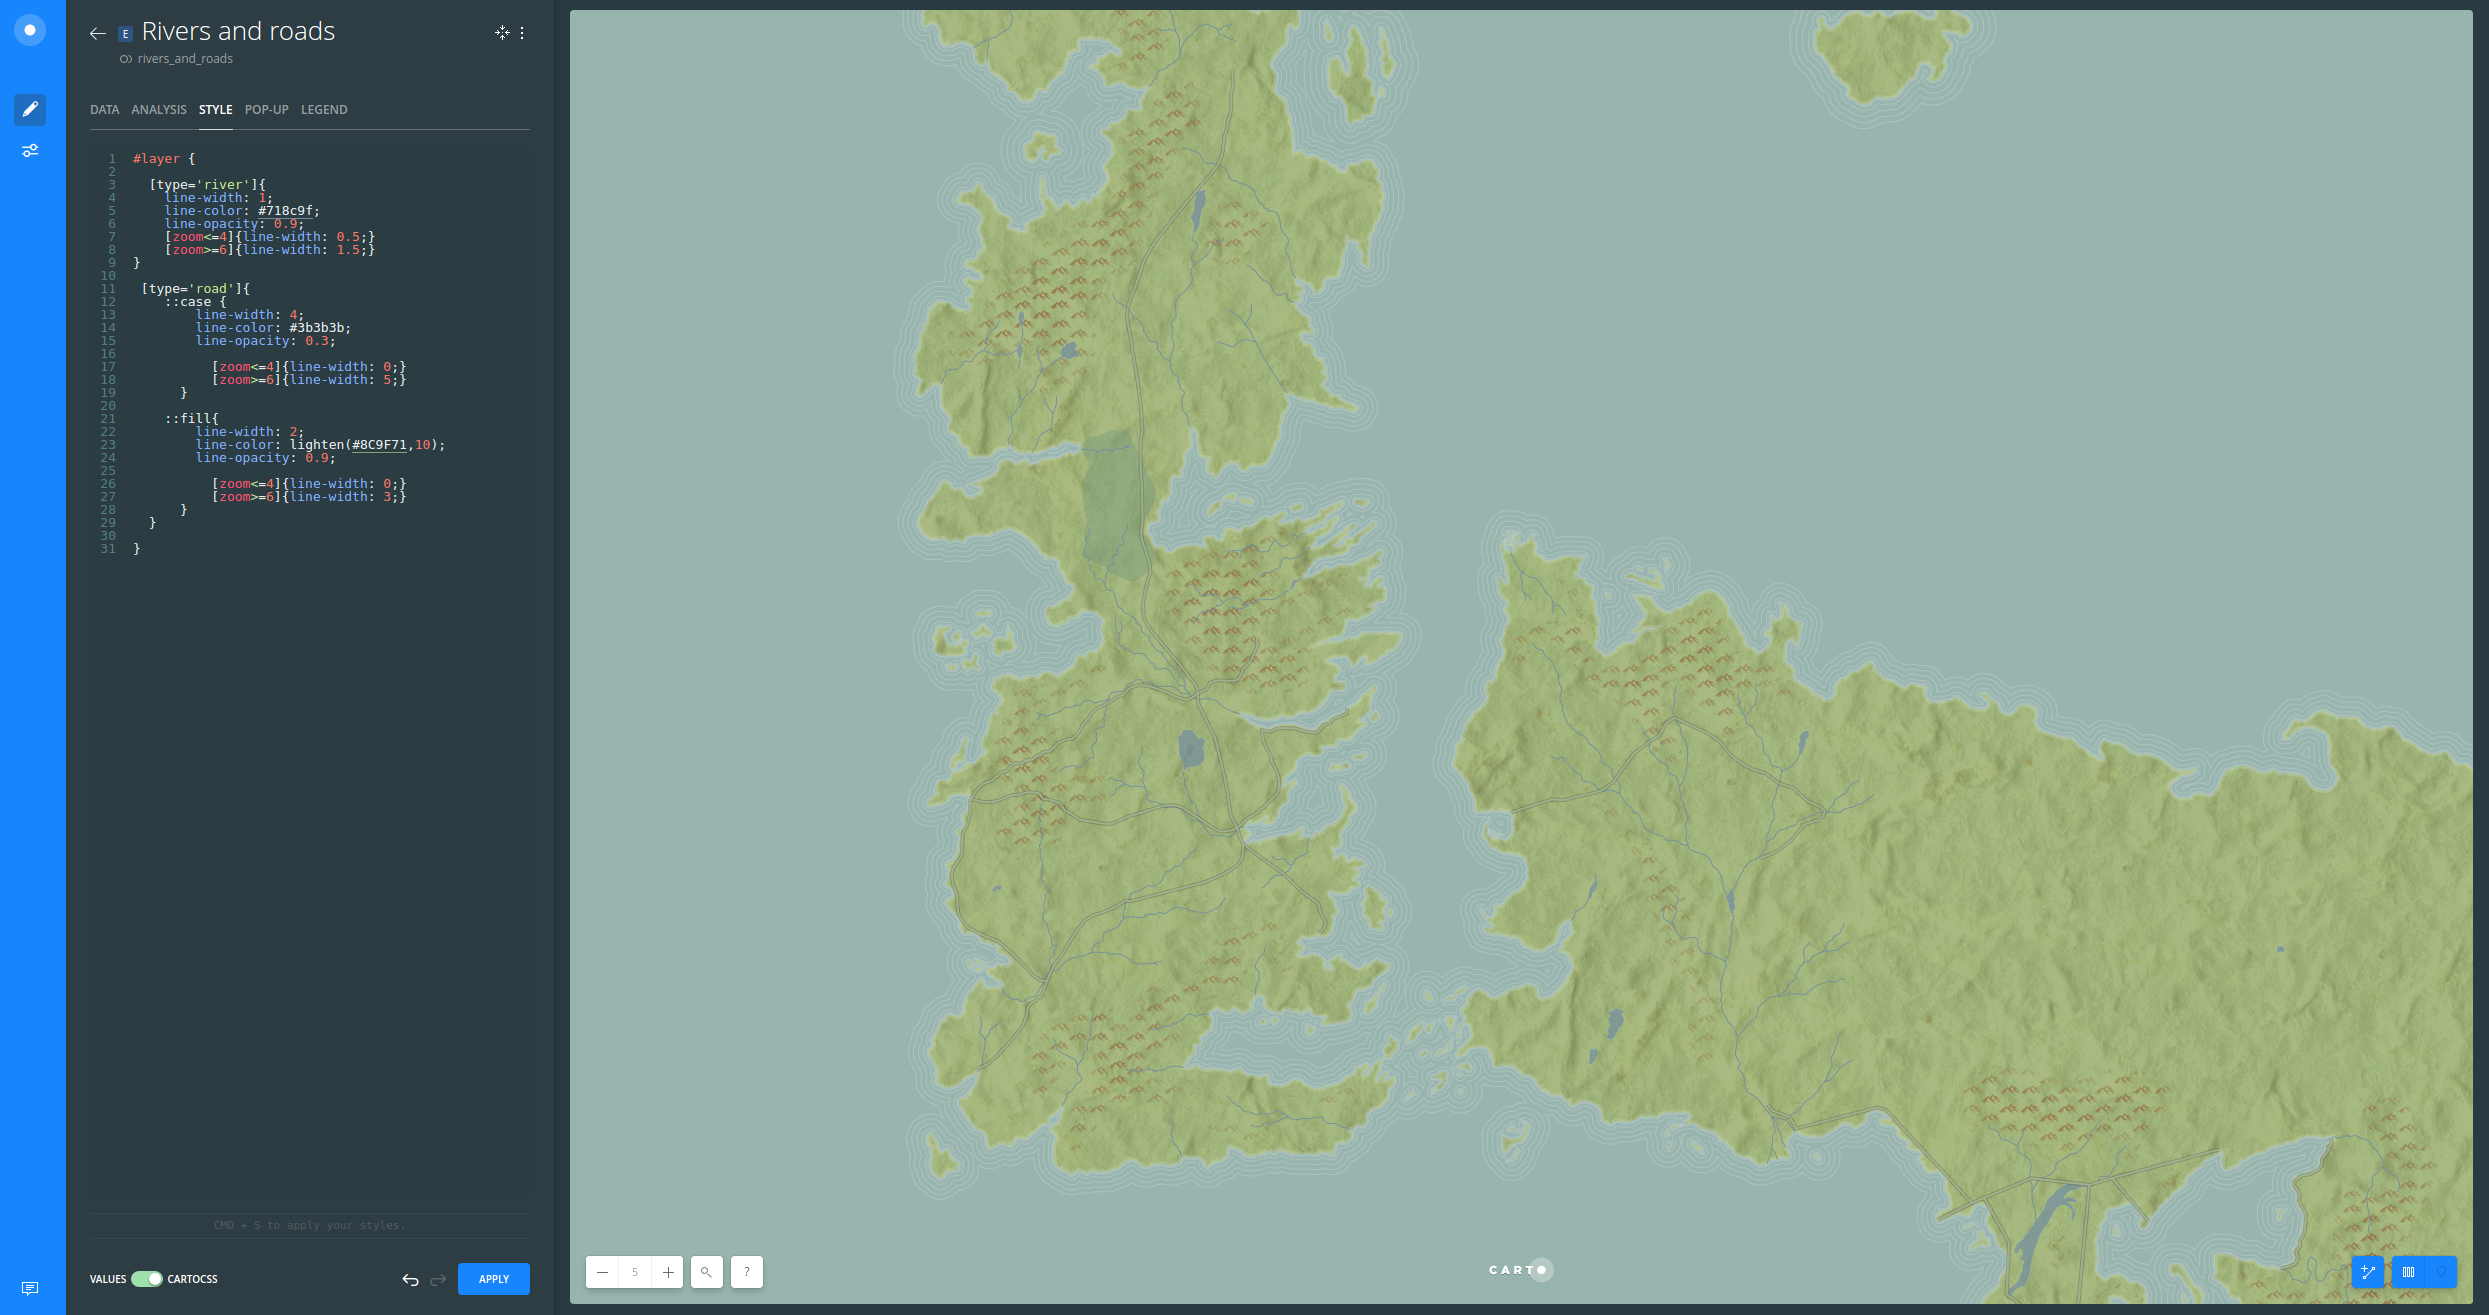
Rivers and roads
- Enable the view from the Rivers and roads layer
- Follow these instructions to style this layer:
- Click on Rivers and roads layer
- Switch from VALUES to CARTOCSS
- Replace the default style with the following:
#layer {
  [type='river']{
    line-width: 1;
    line-color: #718c9f;
    line-opacity: 0.9;

    [zoom<=4]{line-width: 0.5;}
    [zoom>=6]{line-width: 1.5;}
}
 [type='road']{
    ::case {
      line-width: 4;
      line-color: #3b3b3b;
      line-opacity: 0.3;

        [zoom<=4]{line-width: 0;}
        [zoom>=6]{line-width: 5;}
      }

    ::fill{
      line-width: 2;
      line-color: lighten(#8C9F71,10);
      line-opacity: 0.9;

        [zoom<=4]{line-width: 0;}
        [zoom>=6]{line-width: 3;}
    }
  }
}
Rivers and roads were styled based on zoom.
- Click APPLY
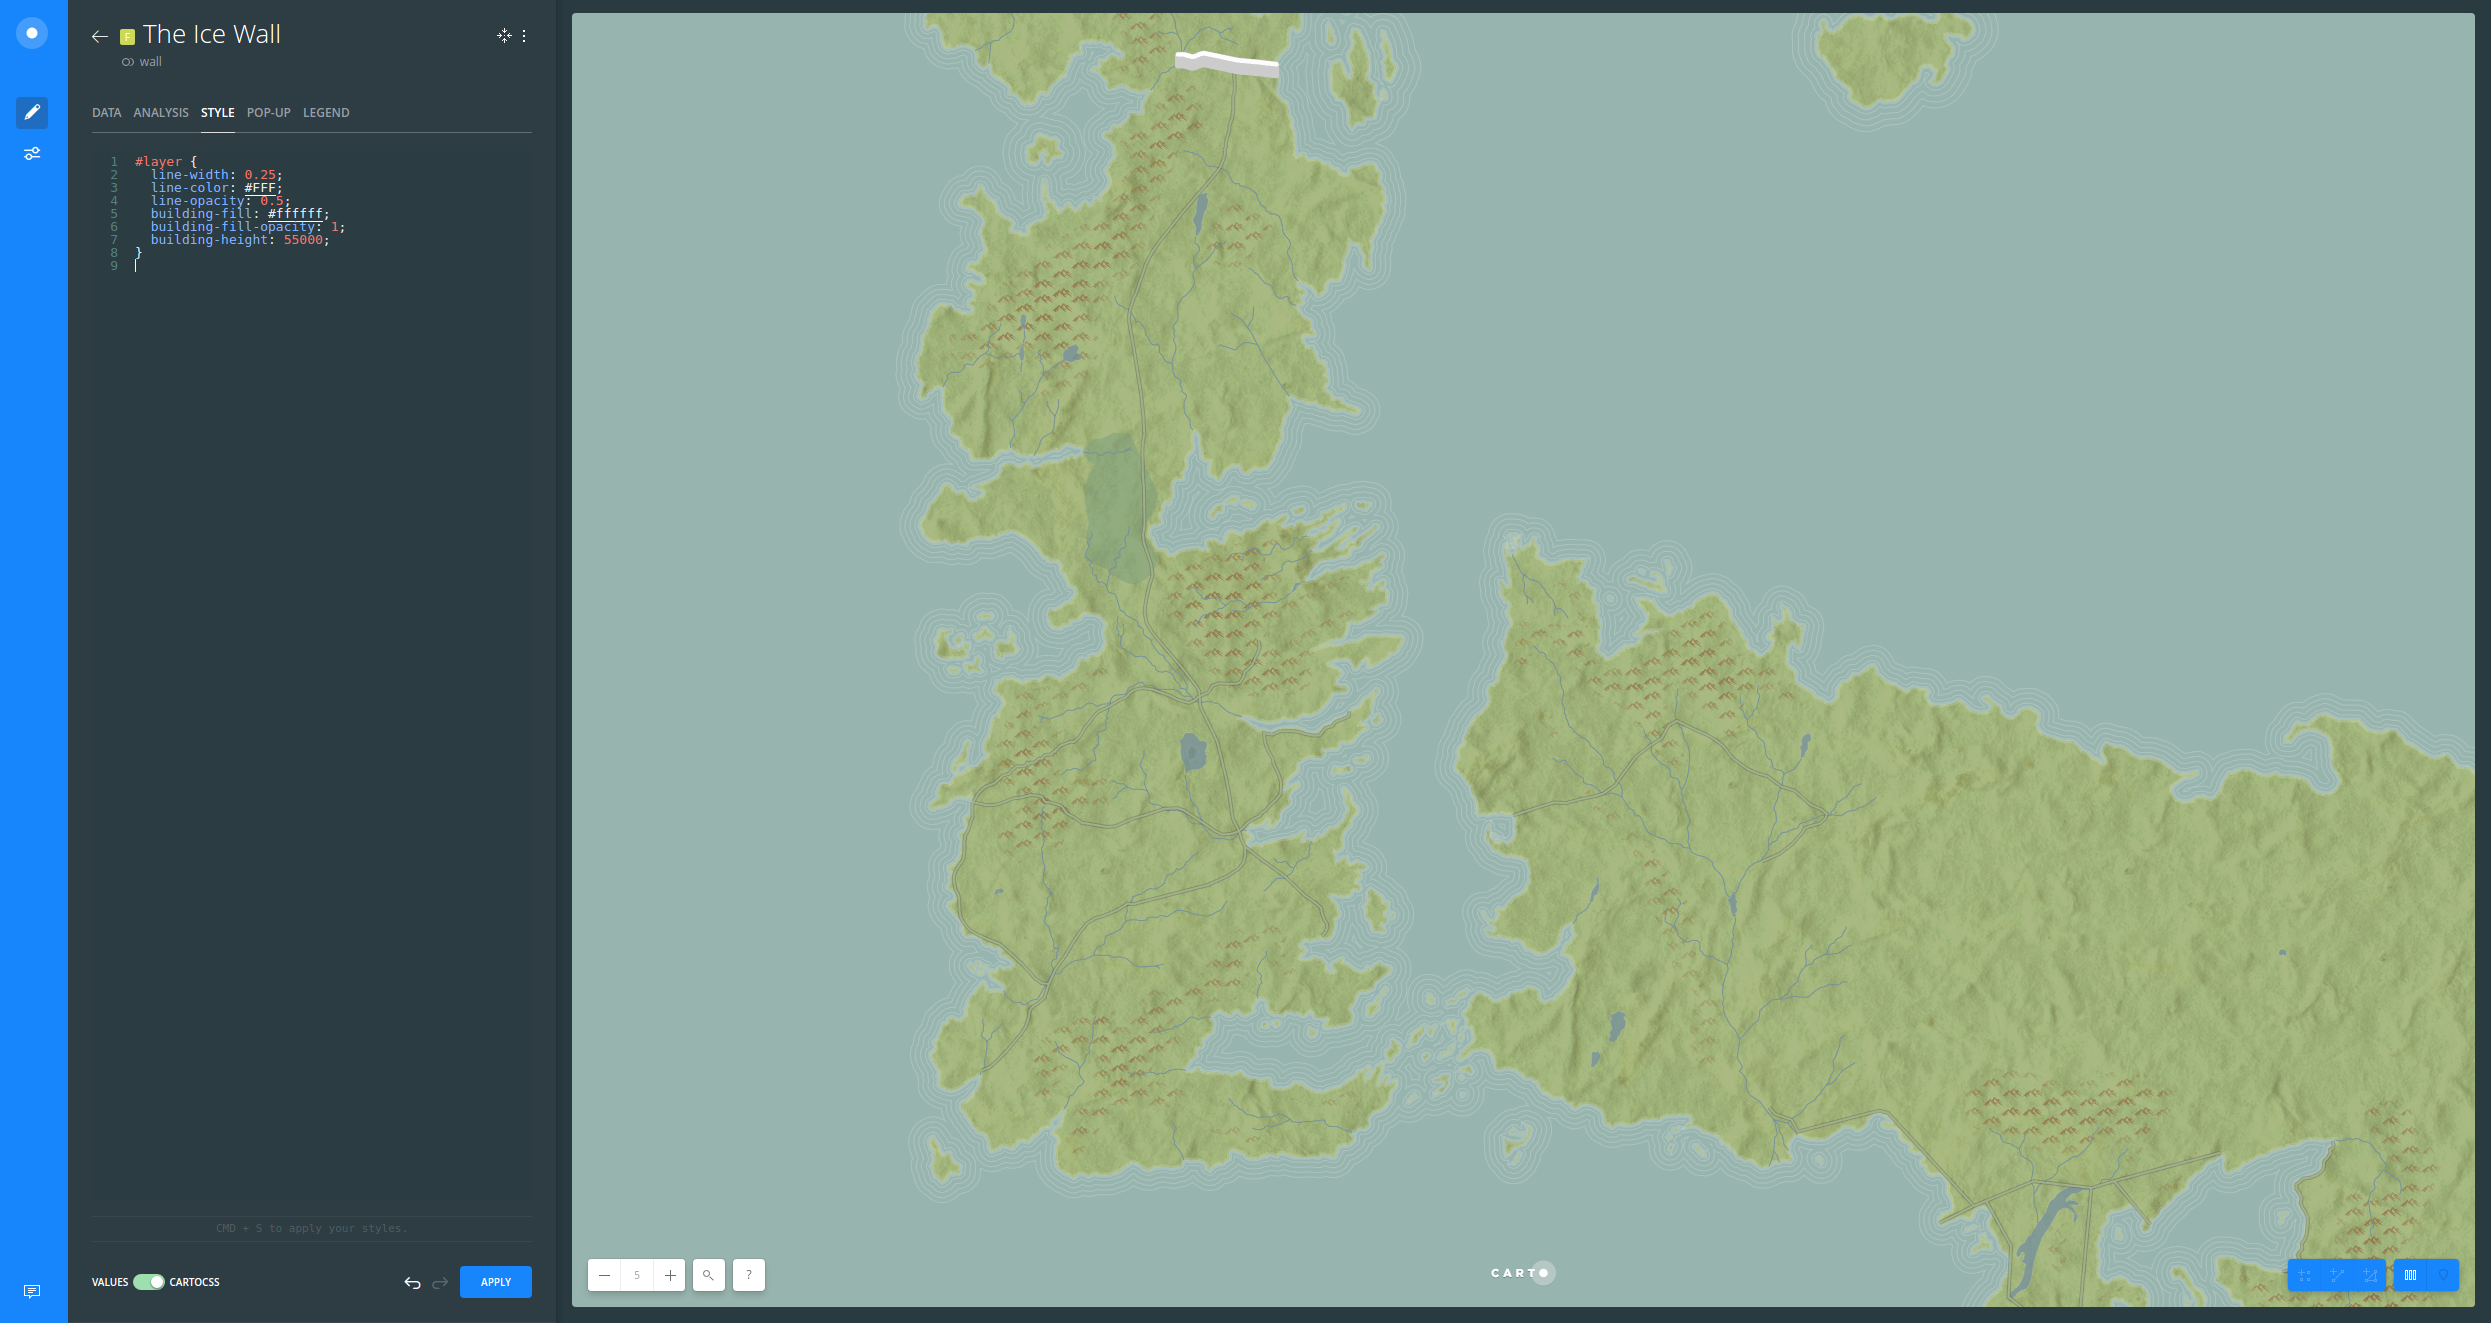
The Ice Wall and beyond
- In order to create a 2.5D effect, follow these instructions:
- Click on the The Ice Wall layer and go to the ANALYSIS tab
- Click on ADD ANALYSIS button to add a new analysis
- Select Create Areas of influence
- Click on ADD ANALYSIS
- Set the parameters as follows:
- TYPE:
Distance - UNITS:
km(kilometers) - RADIUS:
9 - TRACTS:
1 - BOUNDARIES:
Intact
- TYPE:
- Click APPLY
- Go to the STYLE tab and switch from VALUES to CARTOCSS
- Replace the default style with the following:
#layer {
  line-width: 0.25;
  line-color: #FFF;
  line-opacity: 0.5;
  building-fill: #ffffff;
  building-fill-opacity: 1;
  building-height: 55000;
}
The 2.5D effect was made because of the
buildingproperties. Check CartoCSS documentation for more detailed information about this method.
- Click APPLY
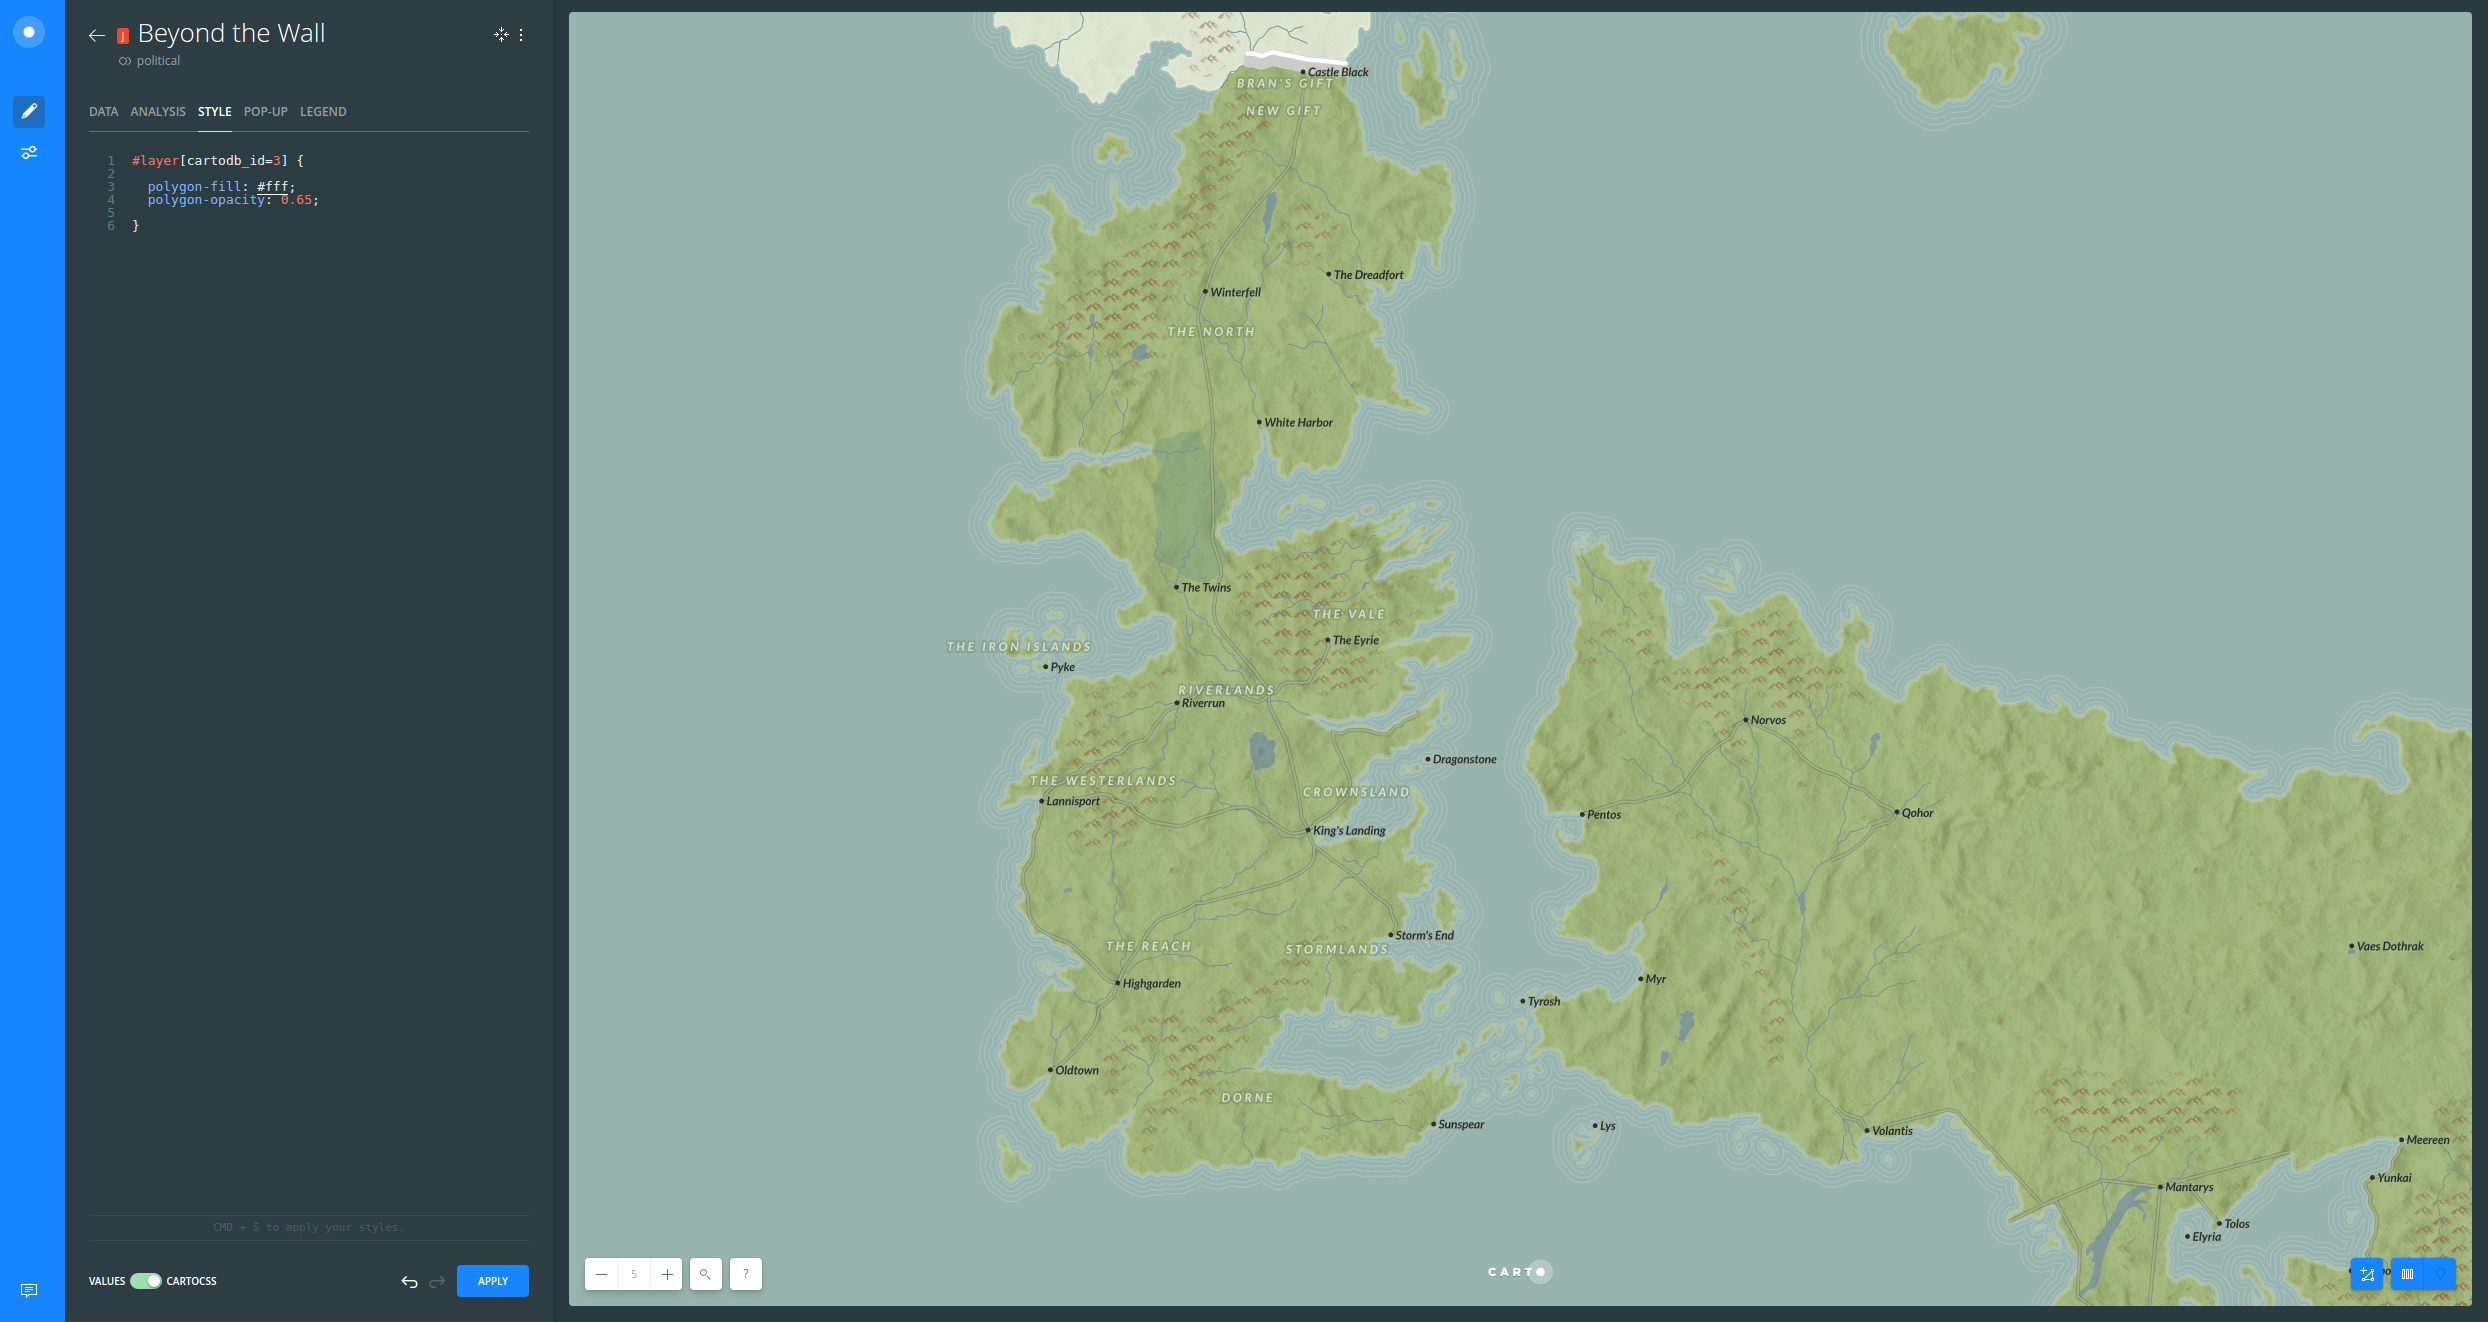
- Show the Beyond the Wall layer from the Map View
- Again, follow these instructions to style this layer:
- Click on Beyond the Wall layer
- Switch from VALUES to CARTOCSS
- Replace the default style with the following:
#layer[cartodb_id=3] {
  polygon-fill: #fff;
  polygon-opacity: 0.65;
}
- Click APPLY
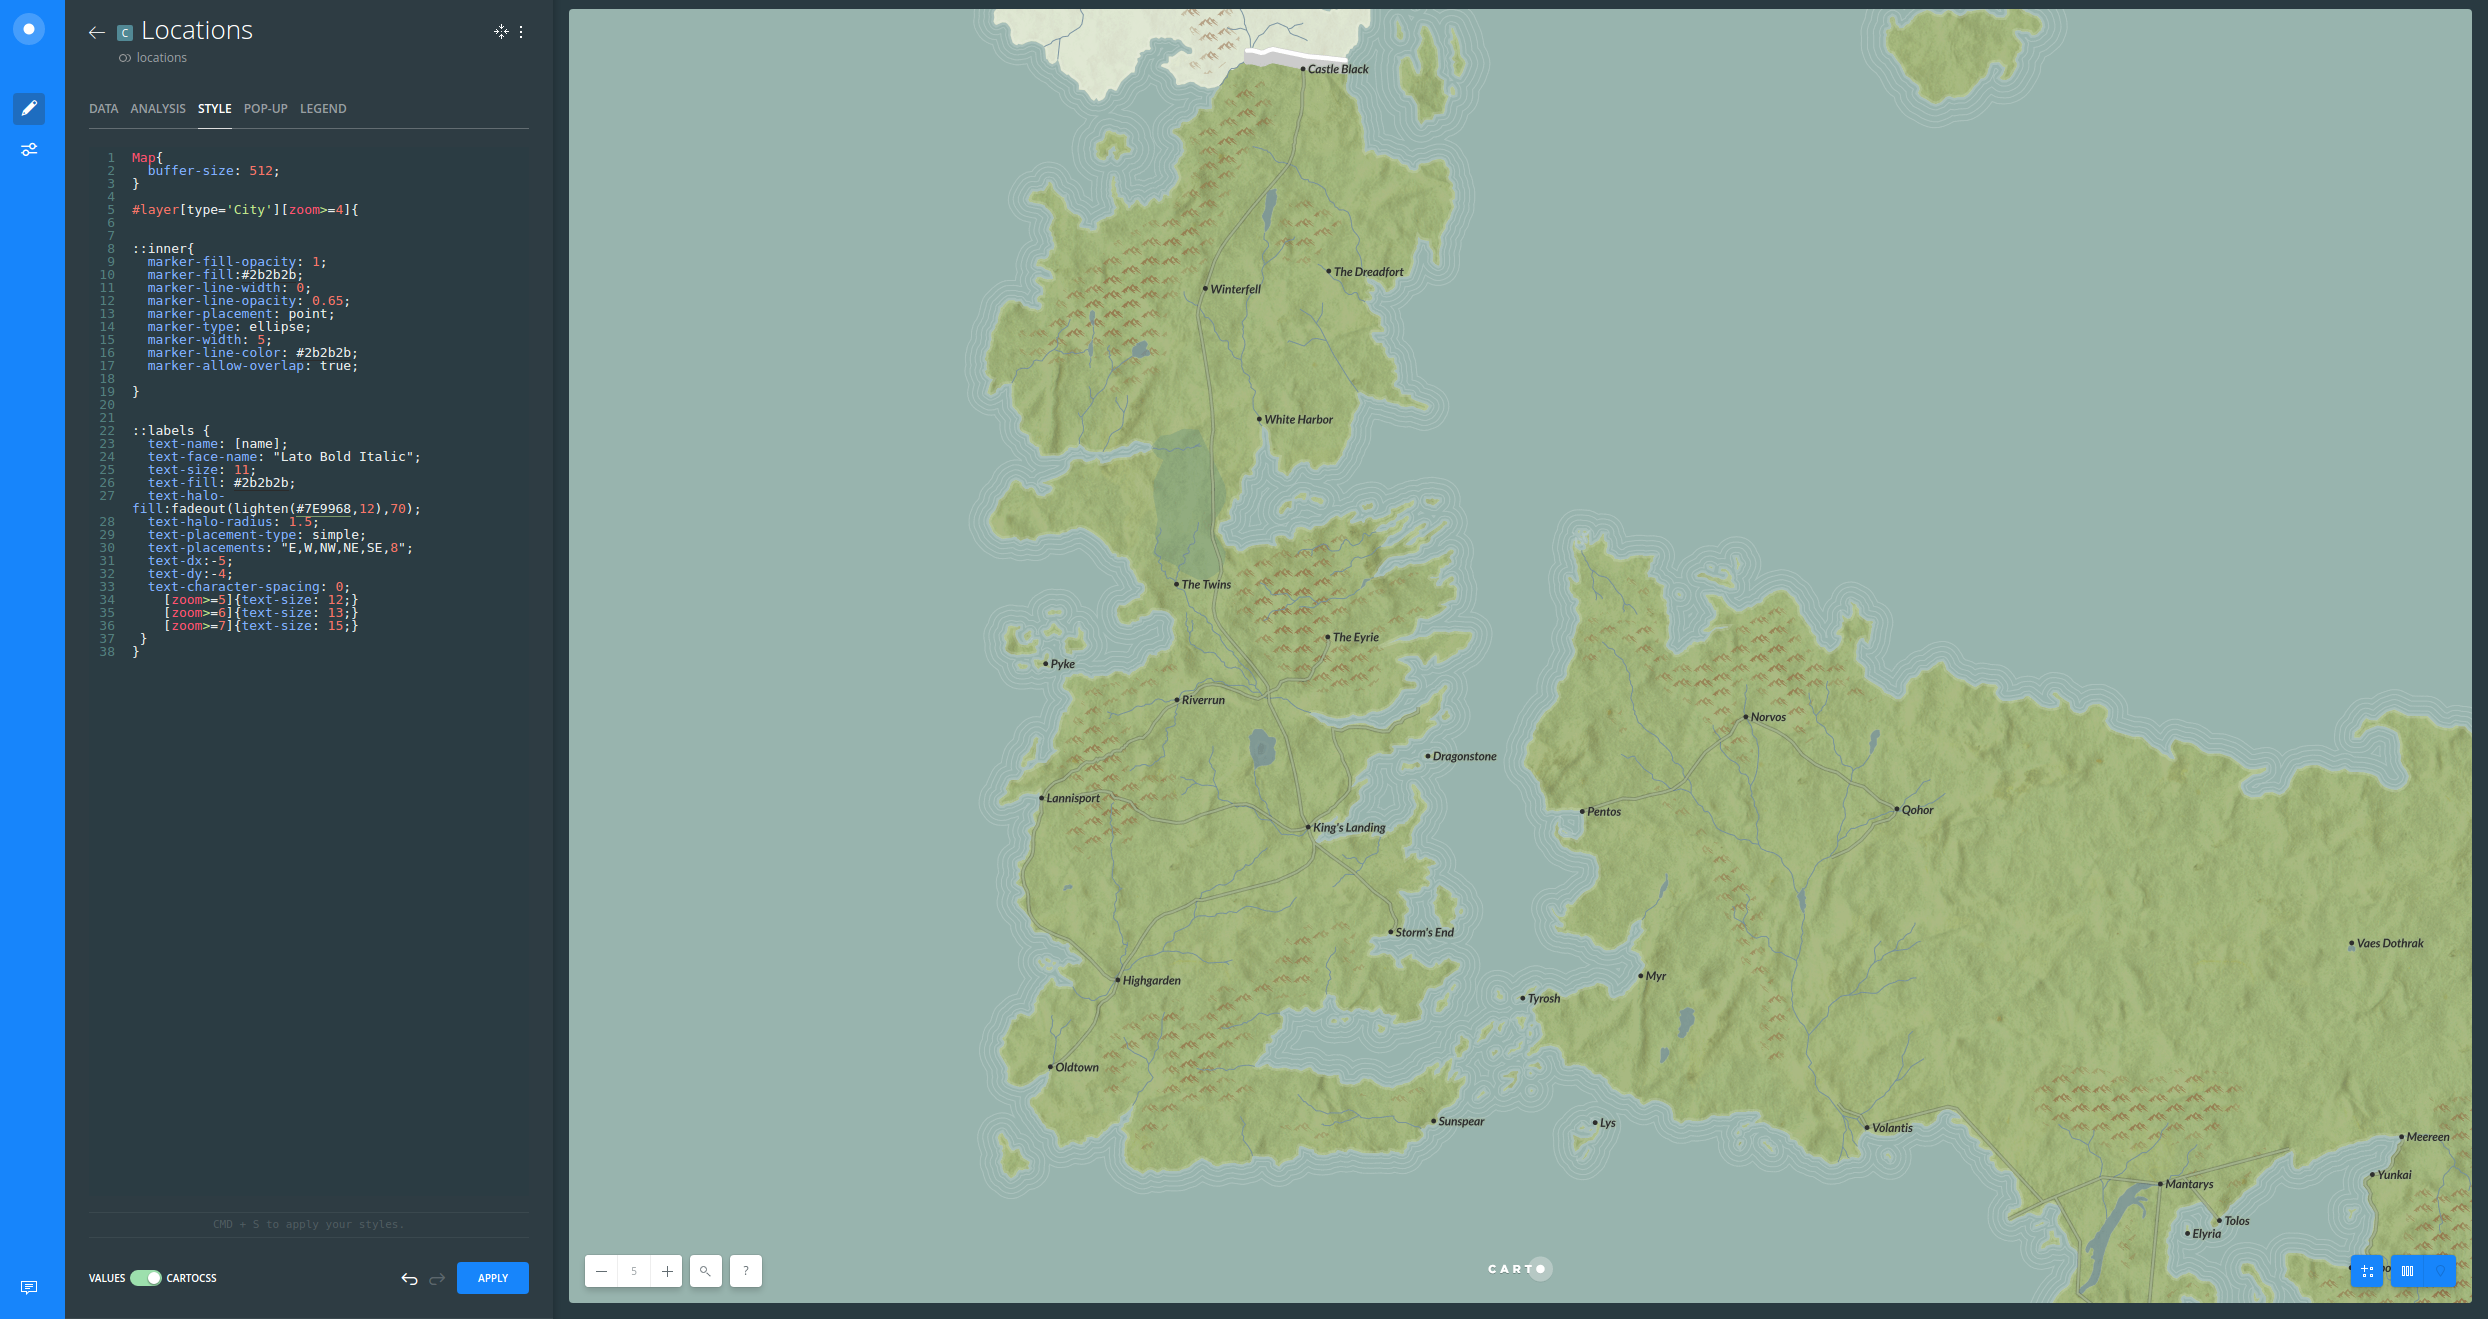
Regions and towns
- Show the Locations layer from the Map View
- Follow these instructions to style this layer:
- Click on Locations layer
- Switch from VALUES to CARTOCSS
- Replace the default style with the following:
Map{
  buffer-size: 512;
}
#layer[type='City'][zoom>=4]{
  ::inner{
    marker-fill-opacity: 1;
    marker-fill:#2b2b2b;
    marker-line-width: 0;
    marker-line-opacity: 0.65;
    marker-placement: point;
    marker-type: ellipse;
    marker-width: 5;
    marker-line-color: #2b2b2b;
    marker-allow-overlap: true;
  }
  ::labels {
    text-name: [name];
    text-face-name: "Lato Bold Italic";
    text-size: 11;
    text-fill: #2b2b2b;
    text-halo-fill:fadeout(lighten(#7E9968,12),70);
    text-halo-radius: 1.5;
    text-placement-type: simple;
    text-placements: "E,W,NW,NE,SE,8";
    text-dx:-5;
    text-dy:-4;
    text-character-spacing: 0;

      [zoom>=5]{text-size: 12;}
      [zoom>=6]{text-size: 13;}
      [zoom>=7]{text-size: 15;}
  }
}
Location labels are also styled based on zoom. Labels work nicely because of the font, size, halo and placement.
- Click APPLY
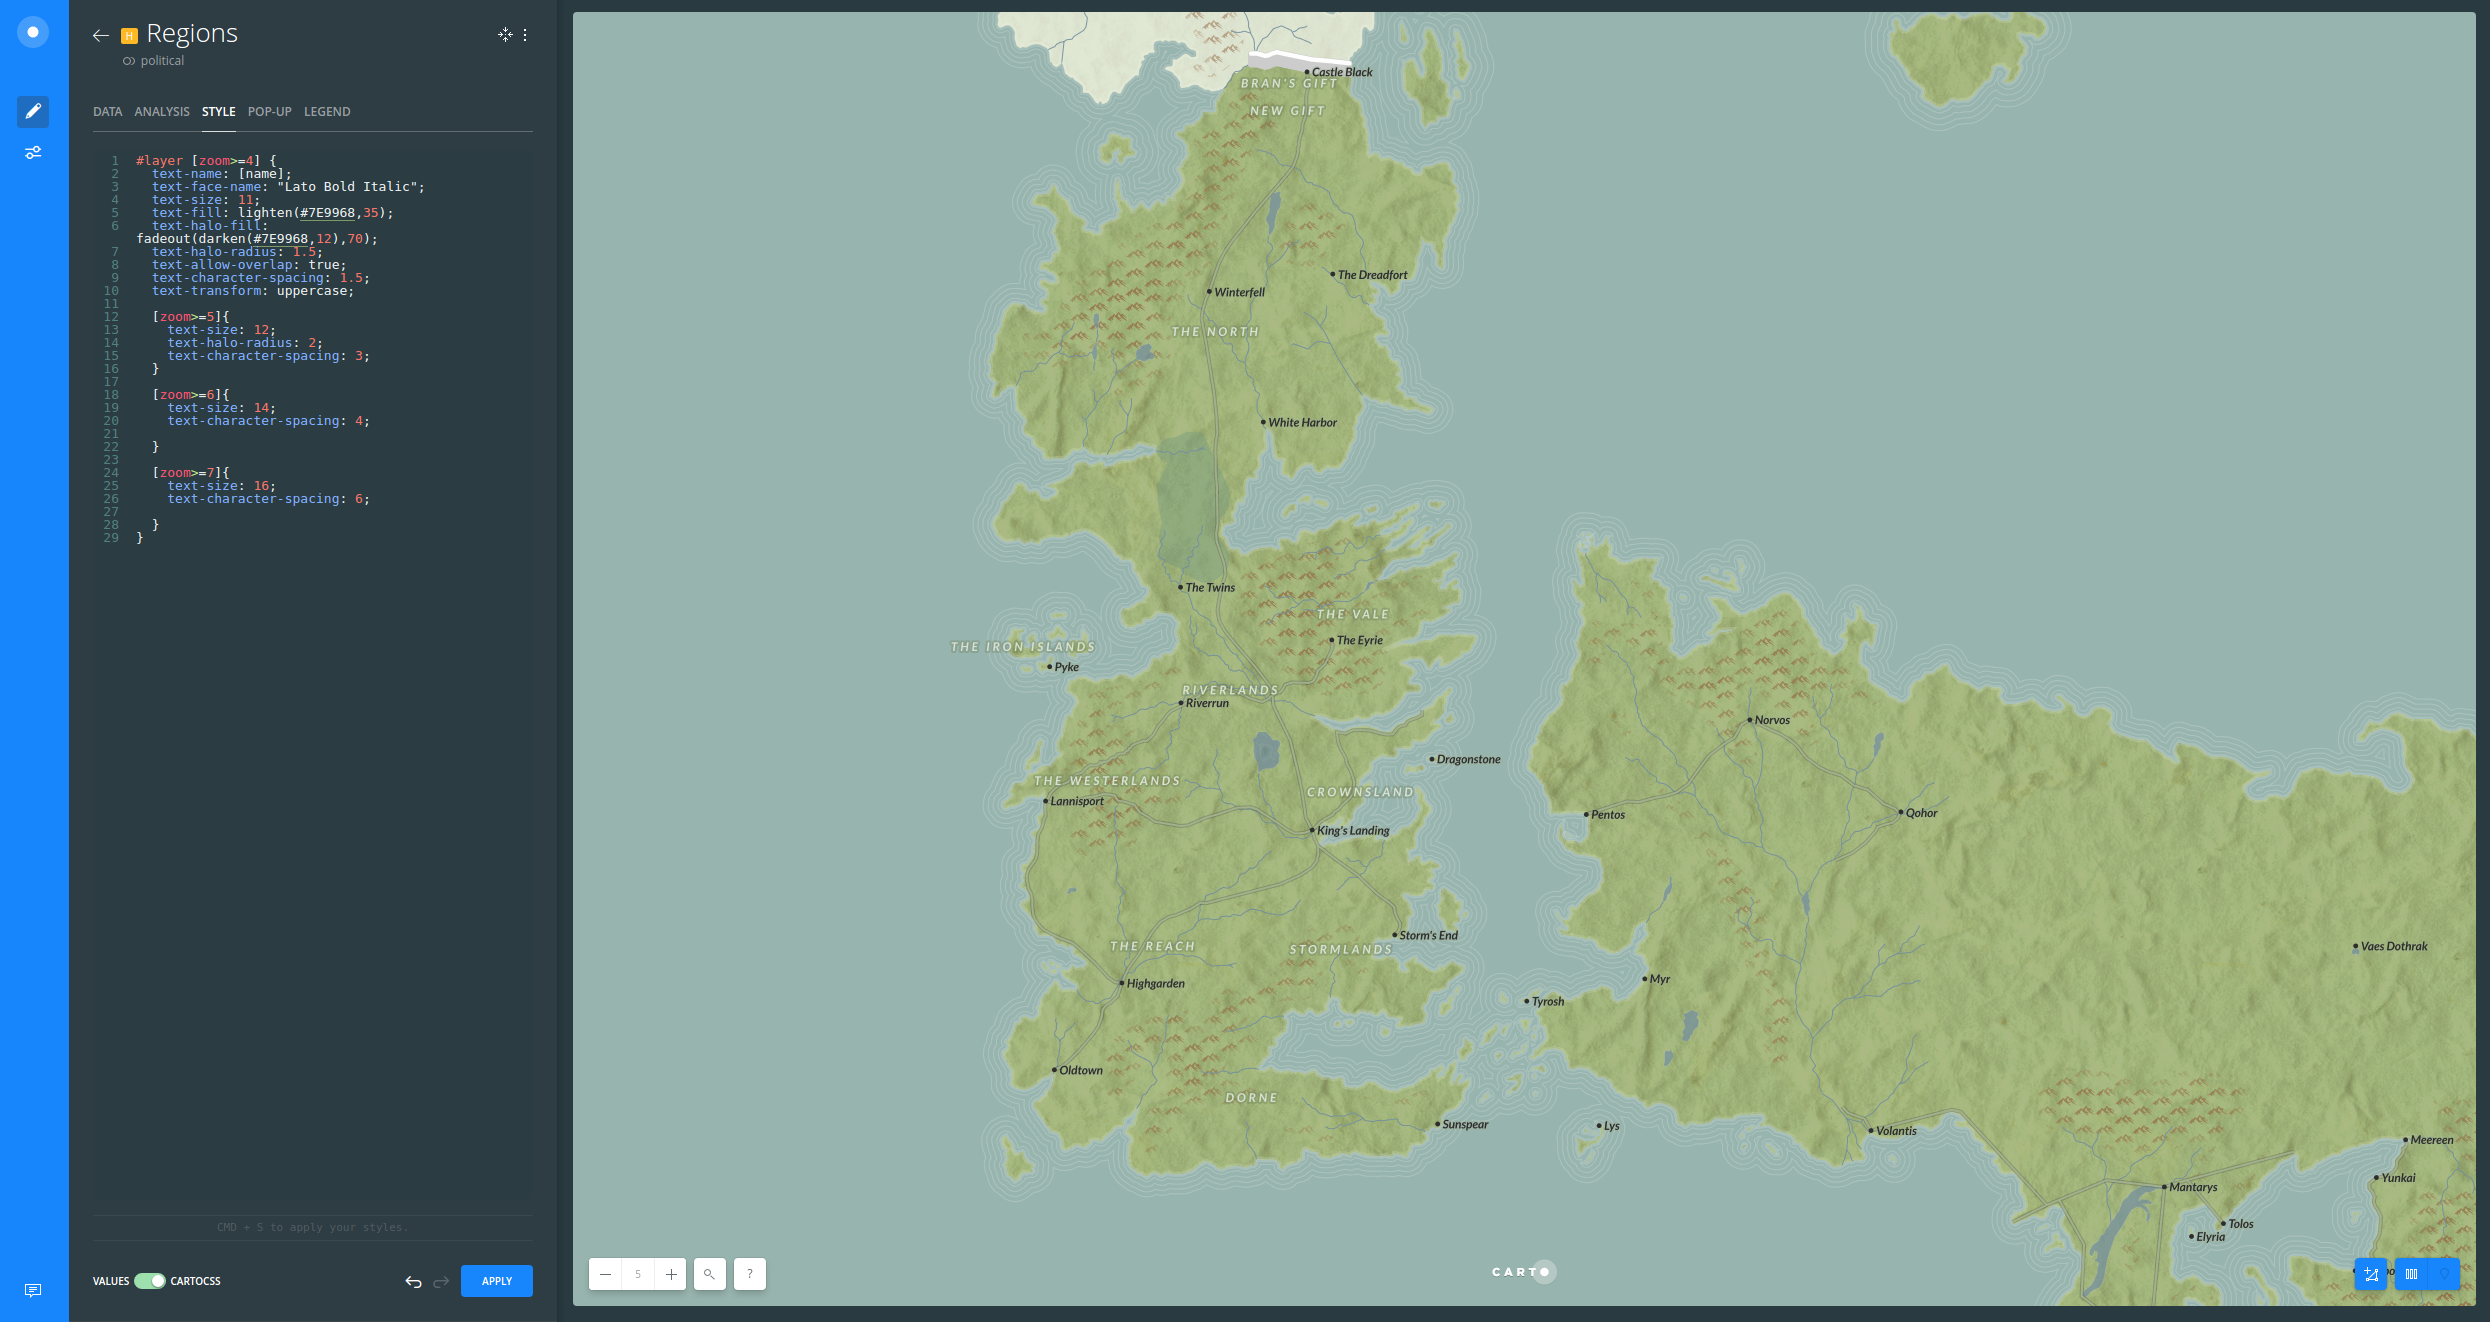
- Show the Locations layer from the Map View
- Follow these instructions to style this layer:
- Click on Locations layer
- Switch from VALUES to CARTOCSS
- Replace the default style with the following:
#layer [zoom>=4] {
  text-name: [name];
  text-face-name: "Lato Bold Italic";
  text-size: 11;
  text-fill: lighten(#7E9968,35);
  text-halo-fill: fadeout(darken(#7E9968,12),70);
  text-halo-radius: 1.5;
  text-allow-overlap: true;
  text-character-spacing: 1.5;
  text-transform: uppercase;

  [zoom>=5]{
    text-size: 12;
    text-halo-radius: 2;
    text-character-spacing: 3;
  }

  [zoom>=6]{
    text-size: 14;
    text-character-spacing: 4;
  }

  [zoom>=7]{
    text-size: 16;
    text-character-spacing: 6;
  }
}
Regions were styled based upon zoom, similar to how location labels were styled. A very cool effect is giving some spaces between the word characters and transforming them into
uppercase.
- Click APPLY
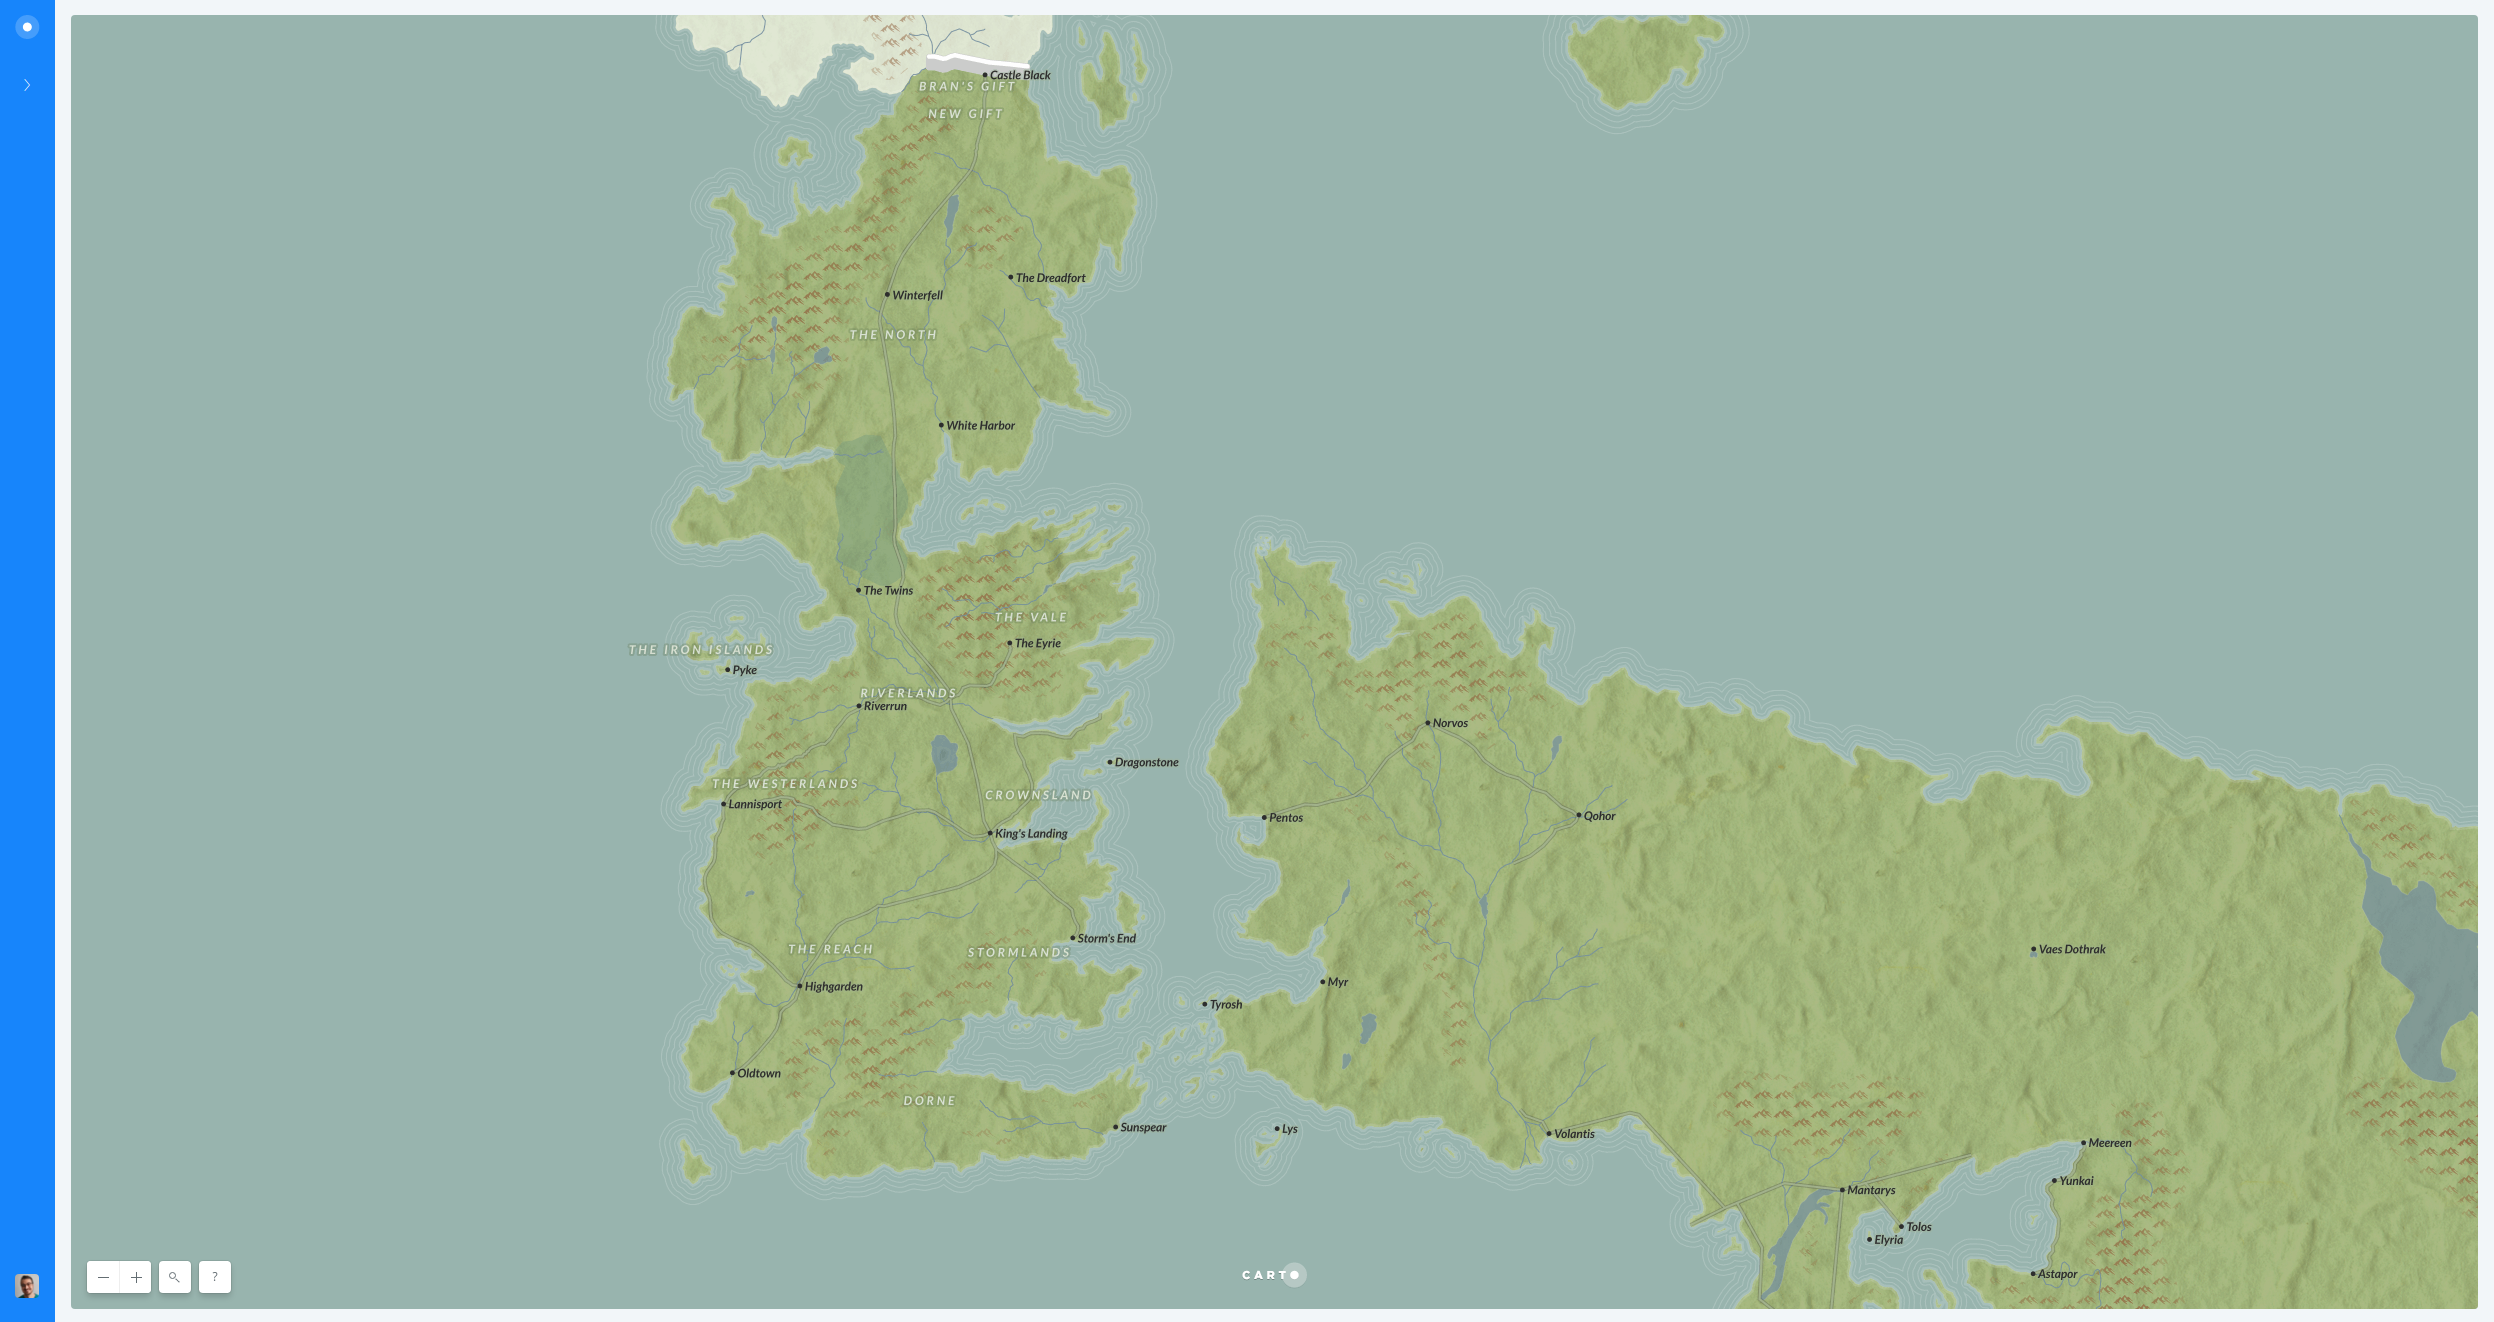
You know nothing!
- Share your map following these instructions:
- Click on SHARE
- Click on PUBLISH
a. Share the URL of your map:
https://public.carto.com/builder/d6700550-7314-434f-9691-0645d86c7cc3/embedb. Embed the iframe into your website:
<iframe width="100%" height="520" frameborder="0" src="" allowfullscreen webkitallowfullscreen mozallowfullscreen oallowfullscreen msallowfullscreen></iframe>
- As a bonus, we are going to convert this Builder map into a basemap. This will allow us to put on top character thematic data:
- Open the
Networktab from your browser developer tools console. - Look for the call that starts with
jsonand get the template id from theRequest URL:
- Open the
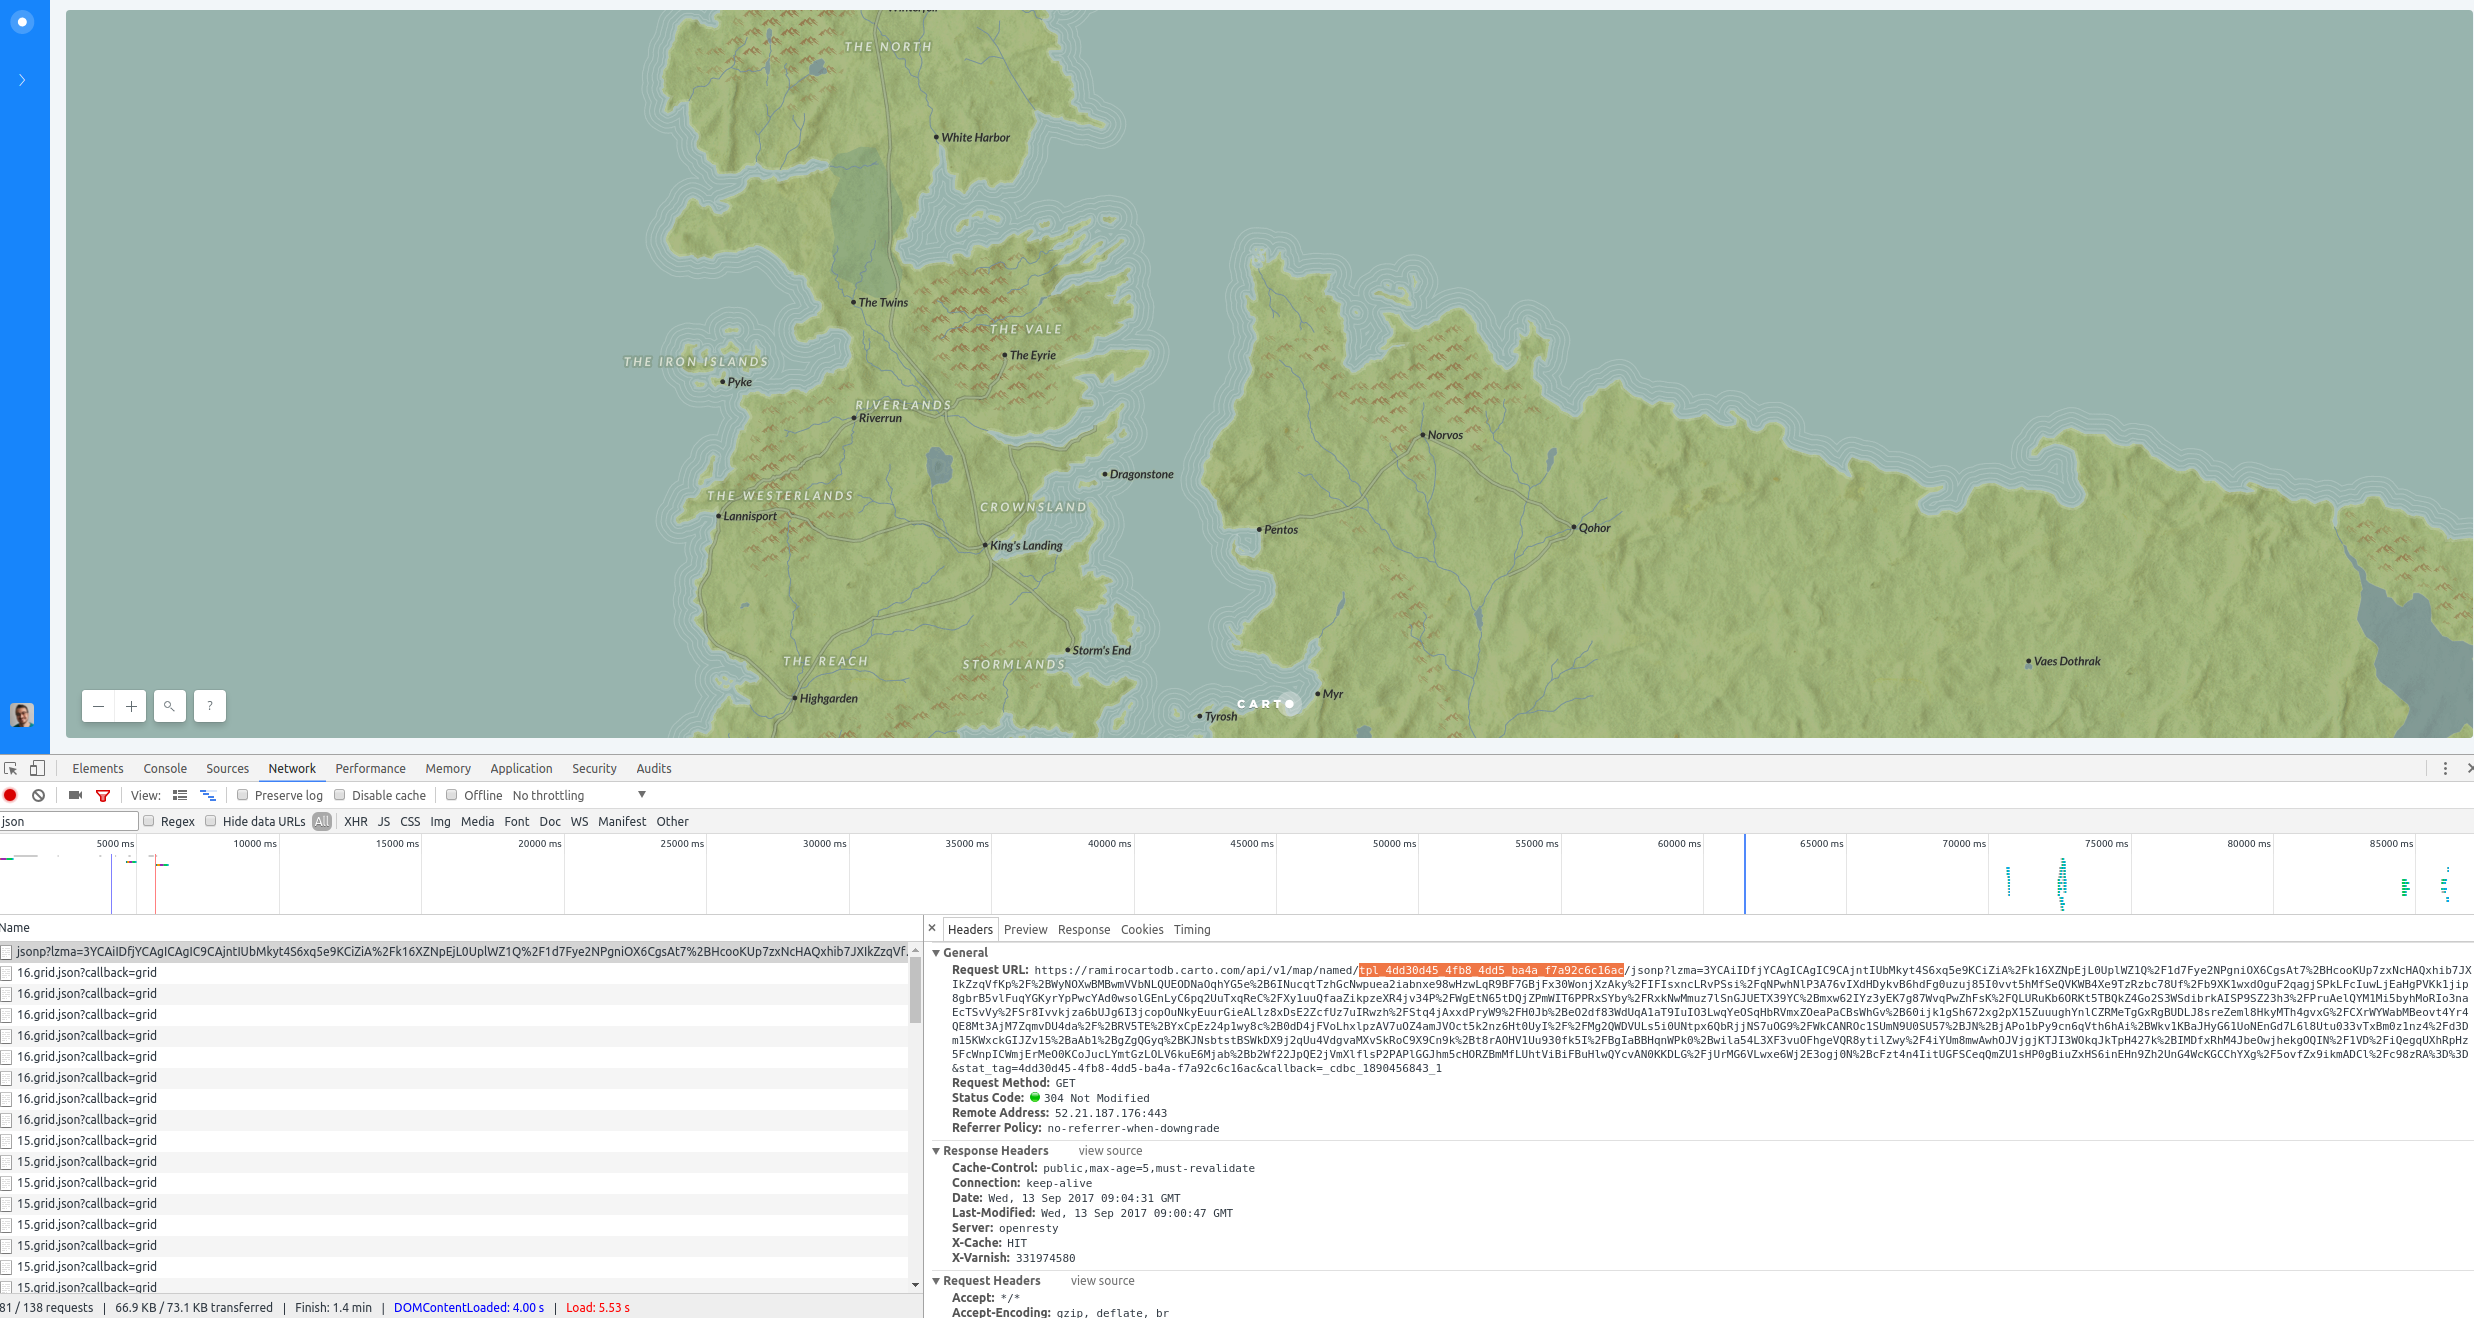
iii. Replace your user name and template id in the following URL:
https://http://cartocdn-gusc.global.ssl.fastly.net/USERNAME/api/v1/map/named/TEMPLATE_ID/all/{z}/{x}/{y}.png
iv. You will end up with a URL similar to this one:
https://cartocdn-gusc.global.ssl.fastly.net//ramirocartodb/api/v1/map/named/tpl_756aec63_3adb_48b6_9d14_331c6cbc47cf/all/{z}/{x}/{y}.pngg
- Finally, you can add this custom basemap following this guide.