How to Enrich Spatial Analysis on BigQuery, Snowflake, & more


Making access to spatial datasets as frictionless as possible is core to our mission of increasing the efficiency of analysts and data scientists working with spatial analytics. For this reason we created the Data Observatory, a repository of thousands of spatial datasets from public and premium sources that are offered ready-to-use via multiple access methods across our platform. The Data Observatory dramatically reduces not only the cost of discovering and licensing relevant third-party datasets but also the time-to-insight for our users; positioning CARTO as the leading one-stop shop for both spatial data and technology.
Data Enrichment, the process of combining first party data with third-party external data sources for richer insights, is of increasing importance for businesses across sectors such as Retail, CPG, Real Estate, and Advertising in order to generate a competitive advantage in a far more data-centric world. Enriching with location-based context plays a critical role in a globalized economy, by taking into account, the geospatial footprint of businesses and their nuances across territories.
In the past months we have announced the complete redevelopment of our leading Location Intelligence platform, adopting a fully cloud native architecture; extending the geospatial capabilities of Google BigQuery, Snowflake, Databricks, and AWS Redshift, while keeping the benefits around privacy, compliance, scalability, and lower costs that these data warehouses bring.
One of the key components of the new platform is the Analytics Toolbox, which provides a complete framework of analysis capabilities to perform spatial analytics in SQL, computed natively in the leading cloud data warehouse platforms. In this blogpost, we are going to demonstrate how to leverage our Analytics Toolbox to perform data enrichment directly on your cloud platform without the need for any complex ETL.
Data Enrichment in Google BigQuery
With the CARTO Spatial Extension for BigQuery users can now supercharge their data warehouse with geospatial capabilities and benefit from everything the CARTO platform has to offer. This also means accessing both Data Observatory subscriptions and Analytics Toolbox functions within BigQuery without the user having to build or run any ETL processes; enabling users to run scalable enrichment queries without their data leaving their own systems.
The Analytics Toolbox for BigQuery already offers more than 100 spatial functions and procedures covering a broad range of spatial use cases including: data transformations, spatial indexing, advanced functions to carry out geospatial statistics (e.g. Moran’s I, Geographically Weighted Regression, Getis-ord Gi*, G-function) clustering, routing, and more.
For Data Enrichment we have implemented a set of 12 procedures which can be differentiated based on three properties:
- Type of geometries to be enriched - whether they are points polygons, or spatial indices (H3, quadkey, S2, or geohash).
- Source of data - whether the features used in the enrichment are coming from data subscriptions of our Data Observatory or from tables provided by the user.
- Whether the user wants the function to perform the enrichment based on a specified aggregation operation (e.g. sum average count) or prefers to receive the unaggregated results i.e. the results from all the intersections between the target and source datasets, and handle the aggregations manually. These are the procedures ended by _RAW.
For example, if the user wants to enrich a set of polygons using features from the Data Observatory and compute the aggregations automatically, then the procedure to use is the DATAOBS_ENRICH_POLYGONS. If what the user wants is to enrich a grid with features coming from another one of their tables and only receive the results of the intersections, then the method to use would be ENRICH_GRID_RAW.
This video shows how to run spatial data enrichments in BigQuery using CARTO leveraging data from two different subscriptions from the Data Observatory.
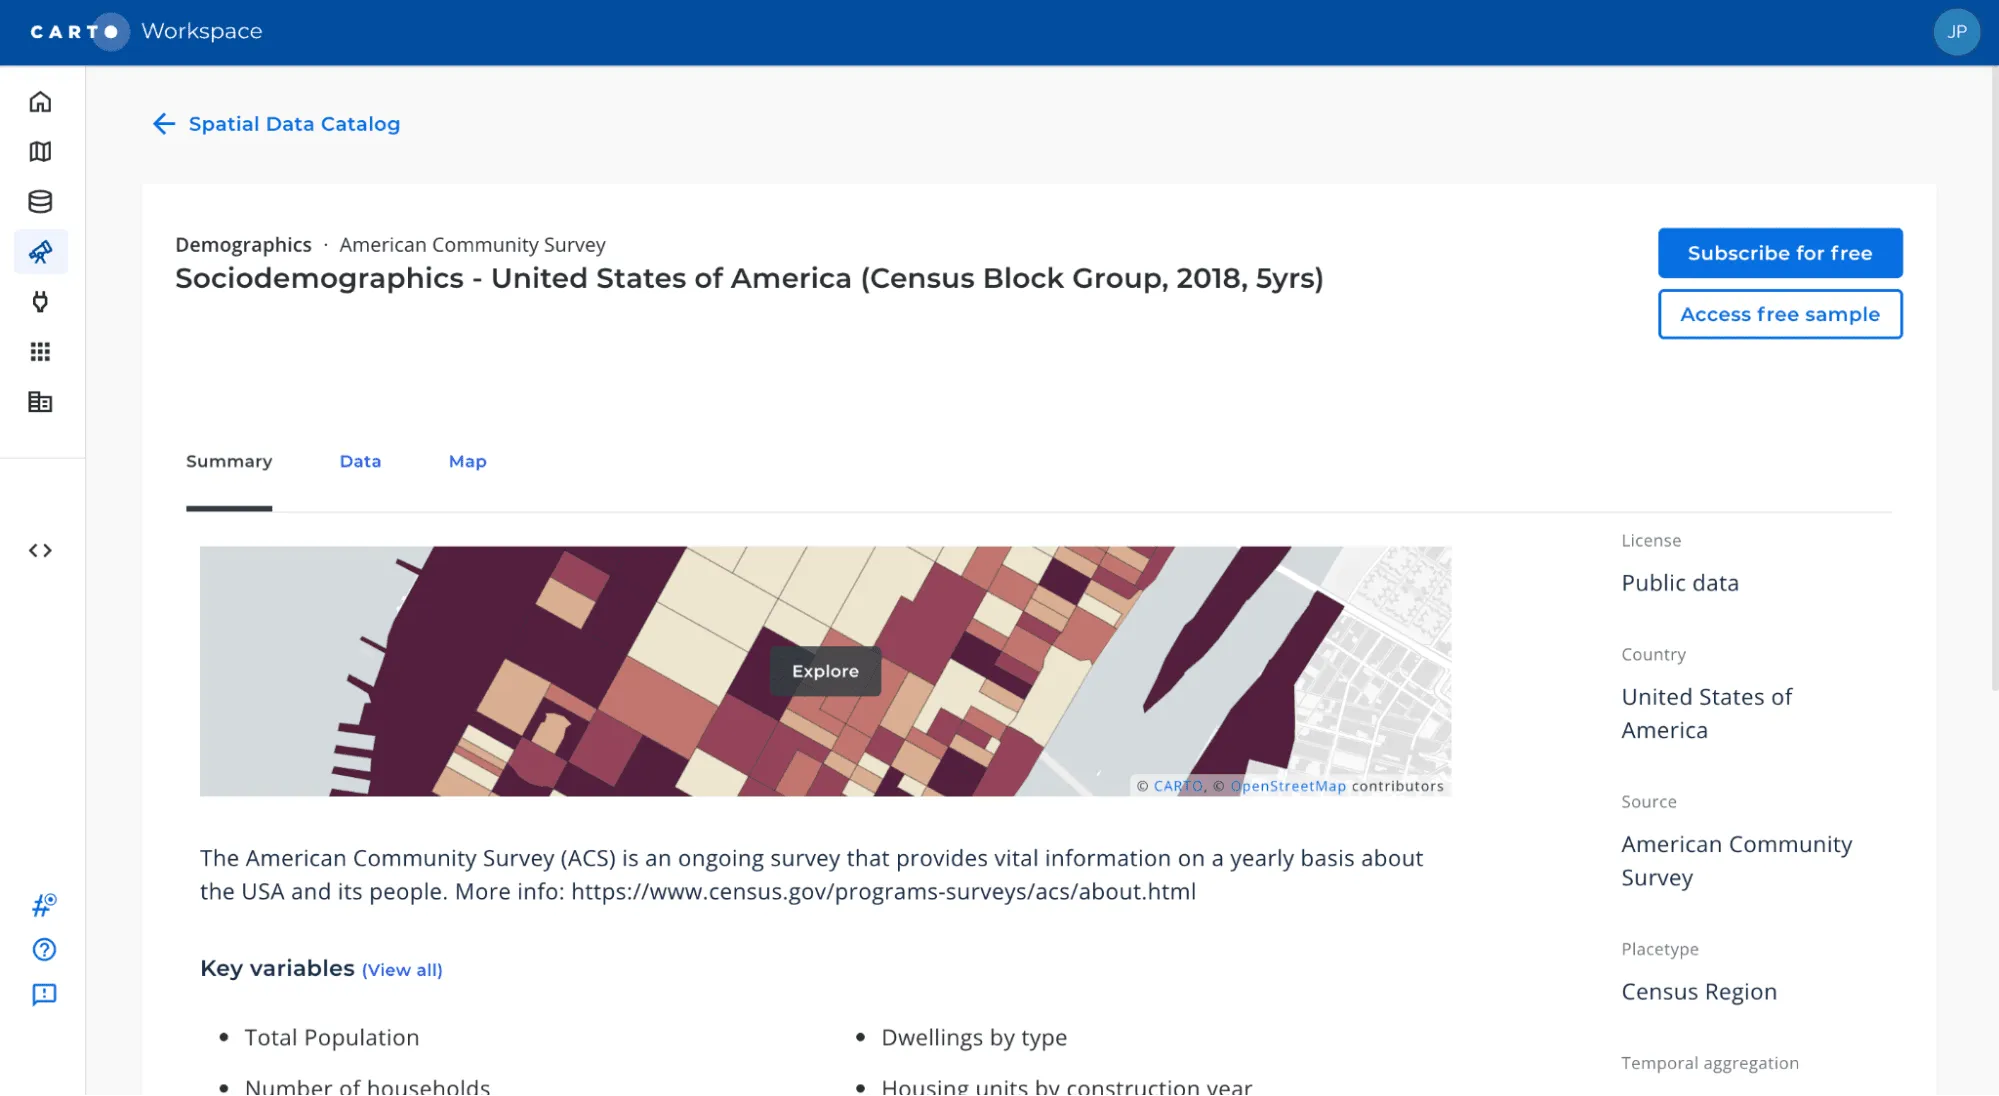
As illustrated in the video, users can subscribe for free to public datasets and request the start of the subscription process for premium datasets via the Data Observatory catalog available in the CARTO Workspace.
Once the subscription is ready and the user has connected CARTO with a Google BigQuery account, the data becomes available directly in that data warehouse platform.
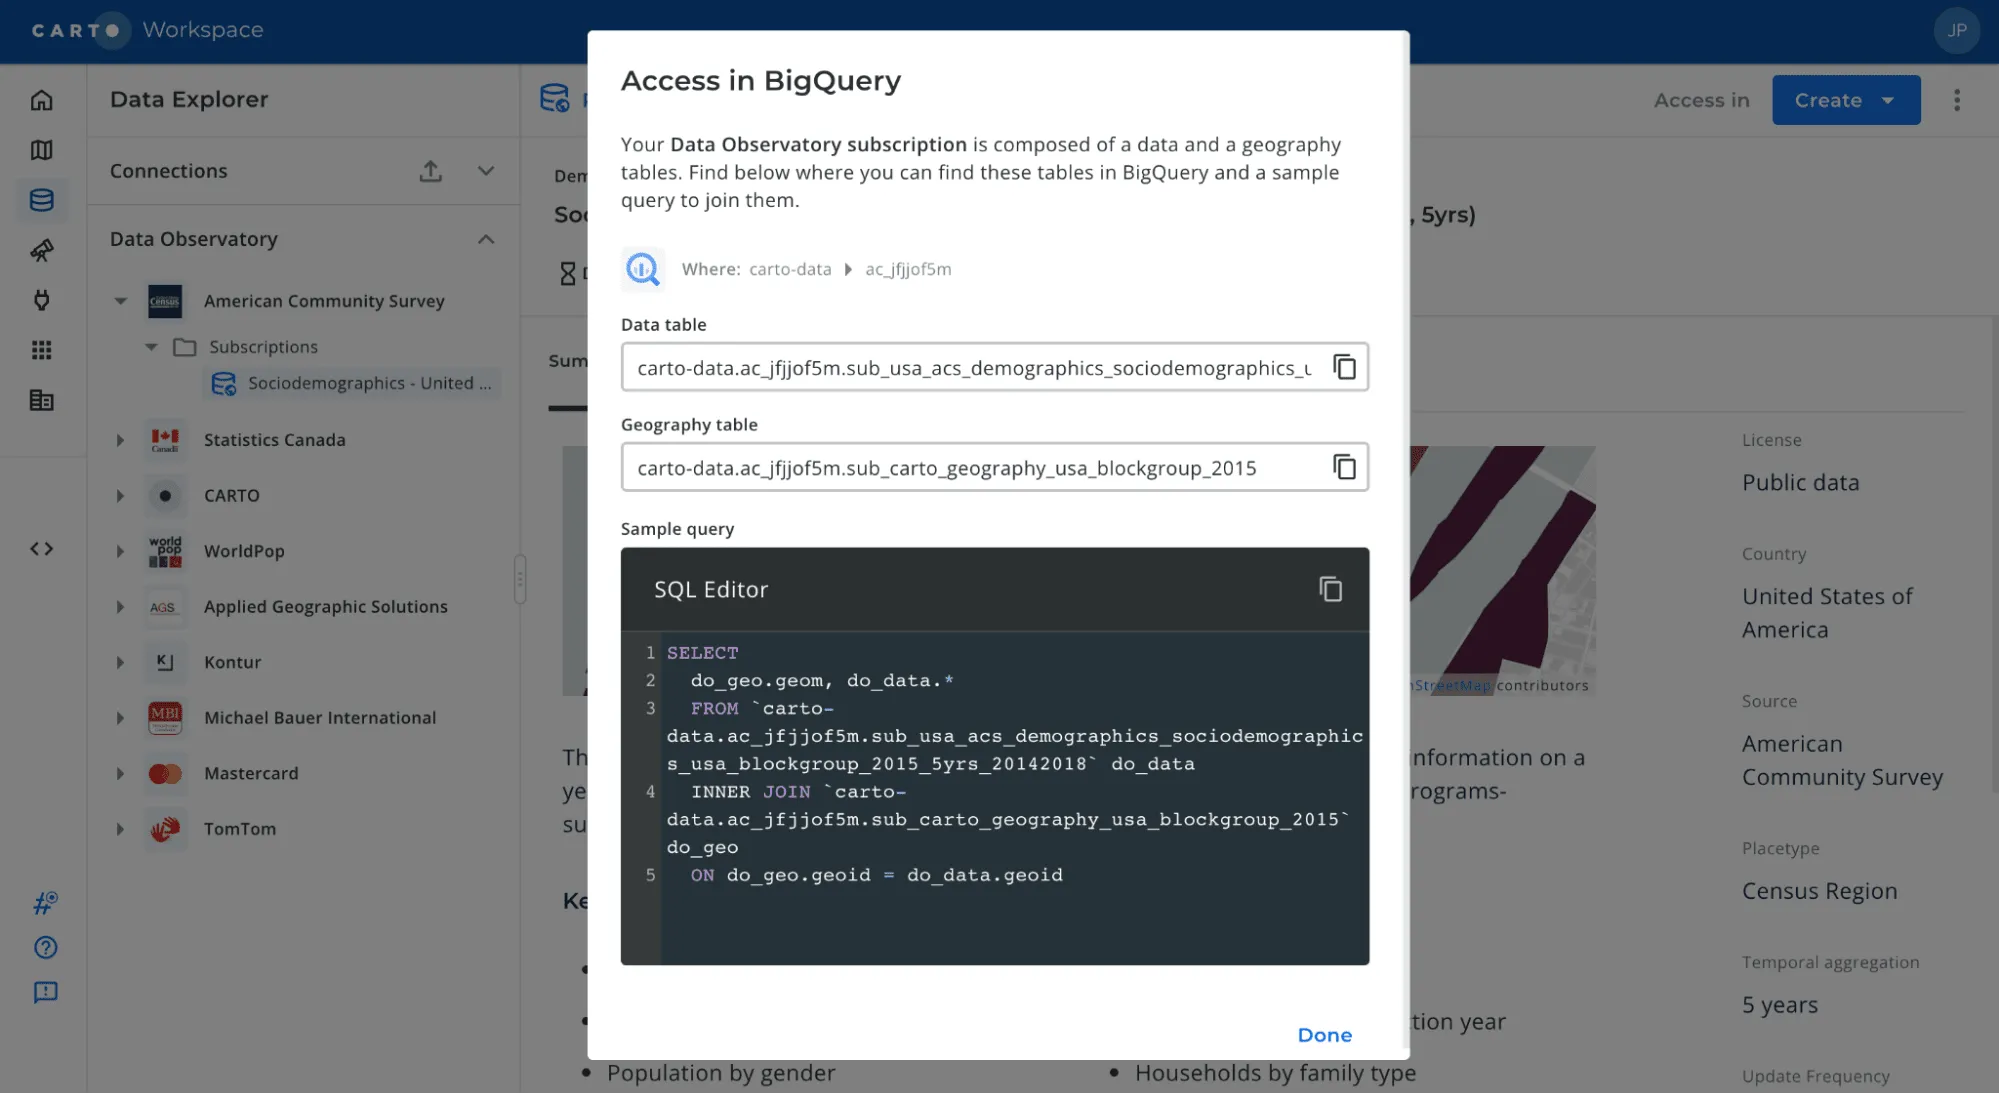
Users can access their Data Observatory subscriptions in conjunction with the Analytics Toolbox directly from their BigQuery console or from SQL and Python notebooks using the BigQuery client, as demonstrated in the example that follows. This example is also available and reproducible through this Google Colab notebook.

With the DATAOBS_SUBSCRIPTIONS procedure the user can check which are the active data subscriptions available in the account:
CALL `carto-un`.carto.DATAOBS_SUBSCRIPTIONS('carto-data.ac_lqe3zwgu' '');
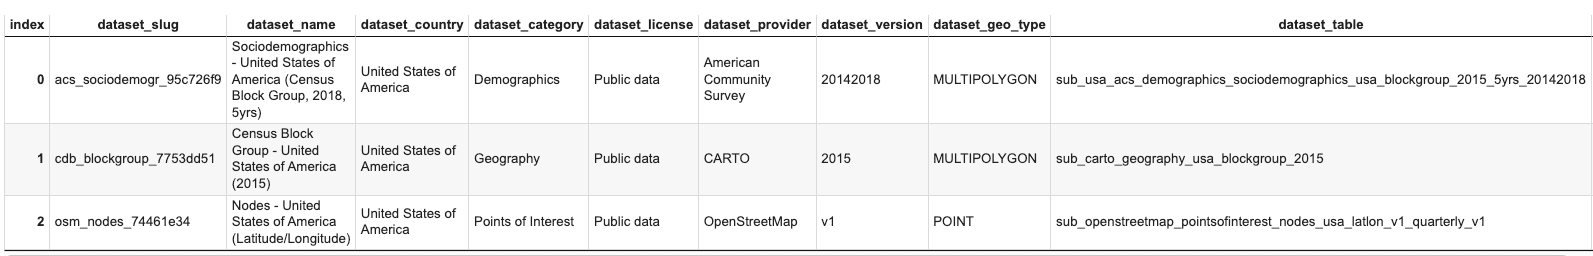
This operation is also useful to retrieve the IDs of the datasets of interest in order to look for the variables we want to use in the enrichment. In this example, we are interested in the following two datasets: ACS Sociodemographics - USA (Census Block Group 2018 5 years) with ID ‘acs_sociodemogr_95c726f9’ and OSM Nodes - USA (Latitude/Longitude) with ID ‘osm_nodes_74461e34’.
Once the datasets of interest are known, users can use the DATAOBS_SUBSCRIPTION_VARIABLES procedure in order to identify the relevant variables they want to use for enriching their analysis:
CALL `carto-un`.carto.DATAOBS_SUBSCRIPTION_VARIABLES('carto-data.ac_lqe3zwgu' "");
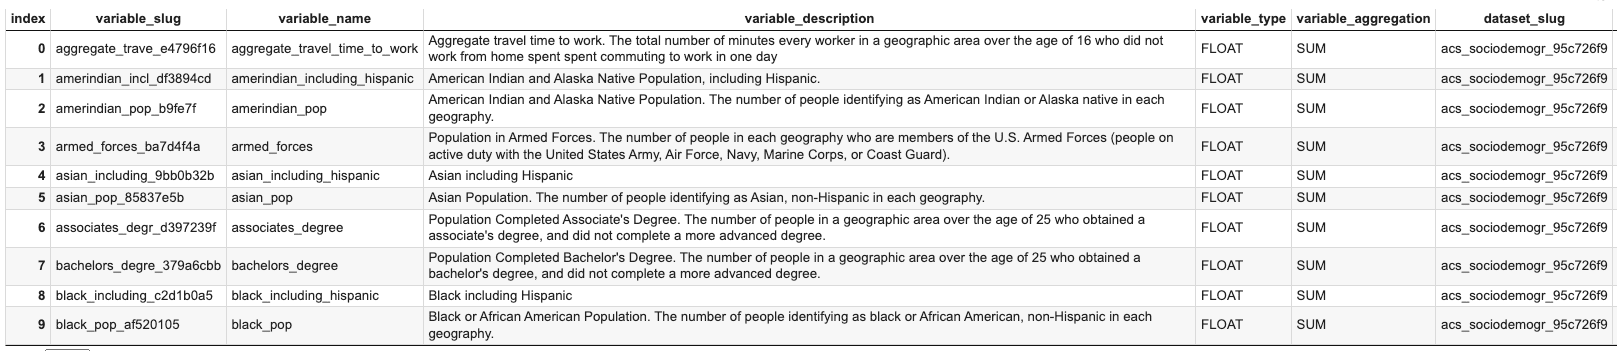
We could have used the following query instead if we wanted to only list the variables of the ACS Sociodemographics - USA (Census Block Group 2018 5 years) dataset:
CALL `carto-un`.carto.DATAOBS_SUBSCRIPTION_VARIABLES('carto-data.ac_lqe3zwgu' "dataset_slug = 'acs_sociodemogr_95c726f9'");
We identified the following variables for our data enrichment example:
- total_pop (‘total_pop_3409f36f’): Total Population. The total number of all people living in a given geographic area from the ACS Sociodemographics dataset.
- median_age (‘median_age_e4b1c48c‘): Median Age. The median age of all people in a given geographic area from the ACS Sociodemographics dataset.
- income_per_capita (‘income_per_capi_bfb55c80’): Average per Capita Income over 12 Months. Per capita income is the mean income computed for every man woman and child in a particular group. It is derived by dividing the total income of a particular group by the total population; also from the ACS Sociodemographics dataset.
- shop (‘shop_eede86ac’): number of POIs categorised as shops as provided by the OSM Nodes dataset.
In this example, the goal is to enrich a grid covering New York, which is publicly available from the table cartobq.docs.nyc_boundary_h3z6. In order to build this grid we used the H3_POLYFILL function of the Analytics Toolbox, as shown in the query below:
SELECT h3id FROM unnest(`carto-un`.carto.H3_POLYFILL(
(SELECT urban_area_geom
FROM `bigquery-public-data.geo_us_boundaries.urban_areas`
Once we have the target geometries that we want to enrich with the external features (i.e. the H3 cells covering New York), we are ready to call the DATAOBS_ENRICH_GRID procedure to run the spatial enrichment process.
CALL `carto-un`.carto.DATAOBS_ENRICH_GRID
('h3'
R'''
SELECT * from `cartobq.docs.nyc_boundary_h3z6`
'''
'h3id'
[('total_pop_3409f36f' 'sum') ('median_age_e4b1c48c' 'avg') ('income_per_capi_bfb55c80' 'avg') ('shop_eede86ac' 'count')]
NULL
['`cartobq.docs.nyc_boundary_h3z6_enriched']
'carto-data.ac_lqe3zwgu')
This last query returns the result of the enrichment process i.e. the H3 grid cells enriched with the values of the external features we selected from our Data Observatory subscriptions. These results are stored in the publicly available table cartobq.docs.nyc_boundary_h3z6_enriched.
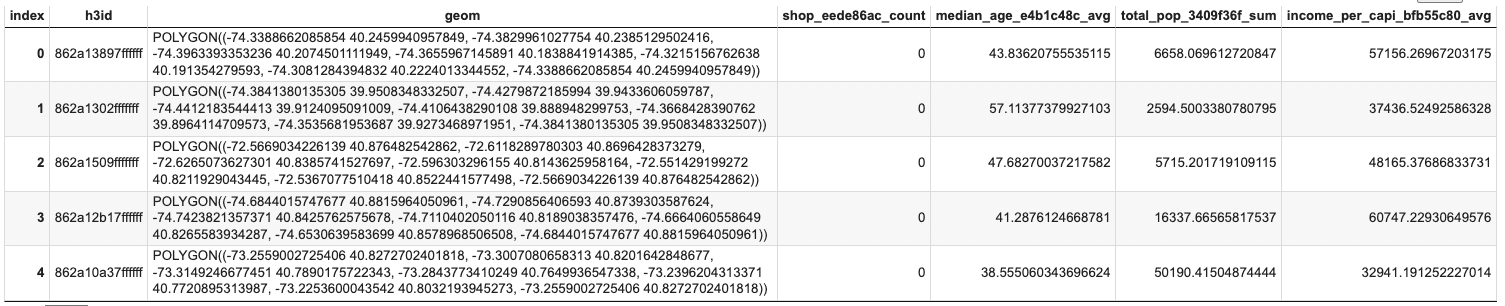
This dashboard showcases the result of the enrichment, where we can visualize the H3 grid covering New York and filter the cells by the different features we have used in the enrichment.
Data Enrichment in Snowflake
Similar to the implementation in Google BigQuery we have showcased in the previous example the Analytics Toolbox for Snowflake includes, among others, procedures to perform data enrichment natively within Snowflake. These procedures work based on the same logic and similar structure as the ones we have shown in the previous example.
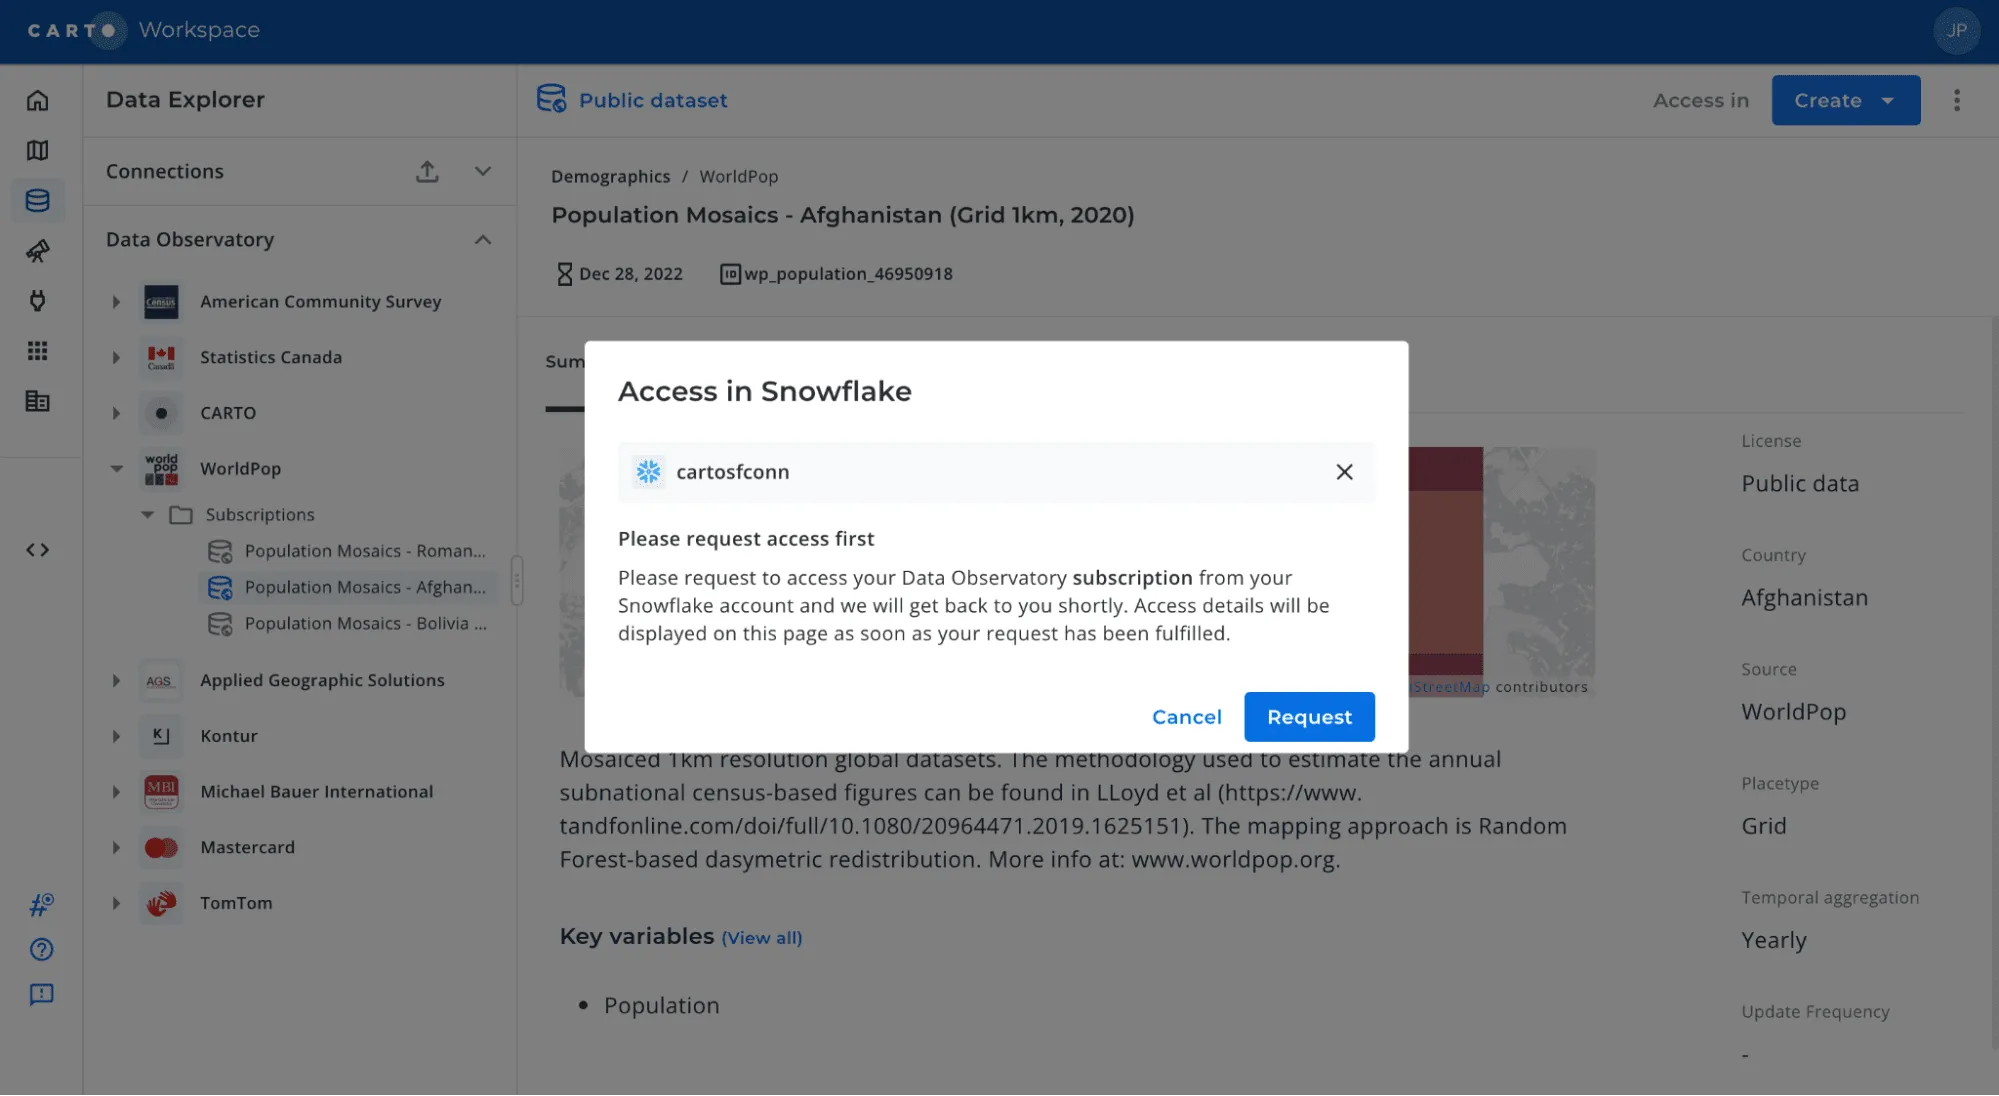
CARTO offers the possibility to obtain access to data from Data Observatory subscriptions in Snowflake on demand. Users just need to send us a request via the Data Explorer interface and our team will get in touch in order to make the data subscriptions available in the Snowflake database the user has connected CARTO to.
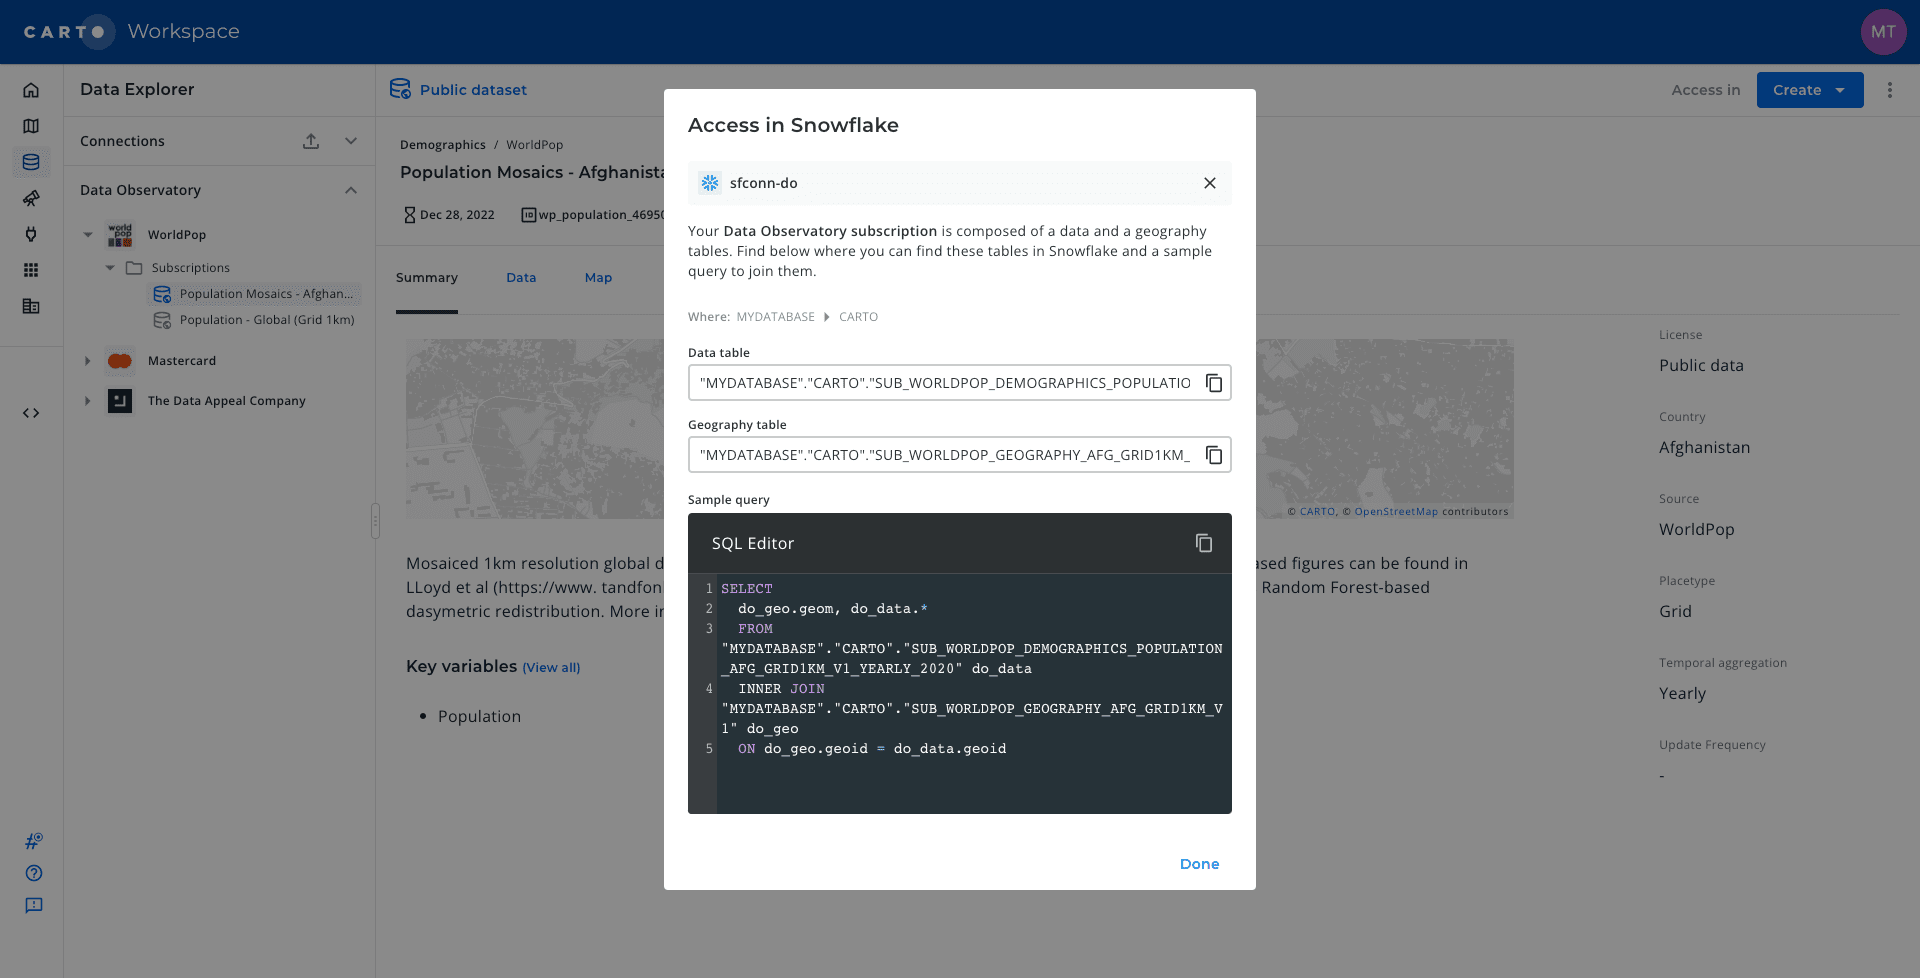
Once users have installed and have access to both the Analytics Toolbox functions and data subscriptions in their Snowflake database they can perform the spatial enrichment process in either their Snowflake console or a SQL notebook connected to Snowflake.
Amazon Redshift and Databricks coming next
In the coming months as we continue developing CARTO Spatial Extensions on top of the different cloud data warehouse platforms we will be also adding support for data enrichment methods in our Analytics Toolbox for Redshift and Analytics Toolbox for Databricks; so stay tuned for regular updates from us!
The Analytics Toolbox for BigQuery and Snowflake are components of our cloud native Location Intelligence platform. To access sign up for a free trial or contact our team of experts for a personalized demo.