From PostgreSQL to the Cloud: Setting up a Spatial Data Infrastructure in BigQuery


PostgreSQL is one of the most popular open source relational database systems available with + 30 years in development, 1,500,000 lines of submitted code and more than 650 active contributors. According to Stackshare, over 5,800 companies are reported to use PosgreSQL as part of their tech stack.
For geospatial workloads, PostGIS extends PostgreSQL to support SQL queries of geographic objects. For many years, this combination has been the de-facto solution for managing spatial data types, spatial indexes, and spatial functions.
However, as the migration to cloud-based architectures gains momentum across organizations, some key limitations of this traditional database approach for geospatial analytics are becoming ever more apparent. In this post, we will outline some of these limitations and provide a step-by-step guide to migrating PostgreSQL spatial data and analytics workflows to Google’s BigQuery cloud data warehouse, using CARTO.
Lack of Compute-Storage Separation
With databases such as PostgreSQL, there is no separation between computing and storage. This can be expensive, from a storage perspective, when dealing with large spatial datasets. In geospatial analyses this cost burden is compounded by the fact that for many spatial workloads there is no need to access all of the stored spatial data to run most analytical workflows.
Complexity when scaling
For users handling large spatial datasets, there is an added layer of complexity. Data needs to be partitioned and the developer/analyst has to dedicate a lot of their time patching pieces together in order to scale processes to handle large volumes of location-based data.
Sharing Limitations
Relational databases such as PostgreSQL complicate data sharing across the organization. As the processing and sharing of spatial data and insights normally extends beyond traditional geospatial teams to include more diverse business users, these limitations bring operational inefficiencies that can be costly in terms of time and effort.
Access the ultimate guide to navigating the new geospatial landscape. Download the free report: Modernizing the Geospatial Analysis Stack today.
Migrating Geospatial to the Cloud
Cloud data warehouses, such as, Google’s BigQuery, provide unparalleled levels of scalability, performance and security. With a “single source” of data truth hosted in the cloud, ETL processes are simplified, often eliminated, and as we all know, the cost of storage and computing in the cloud is significantly lower than traditional server-based infrastructures. Moreover, data sharing across the organization is simplified, opening up spatial analytics to a broader user base using universal tools, such as Spatial SQL.
Although the functionalities of PostGIS are extremely rich, the current geographical support for geospatial analytics on BigQuery covers the most demanded workloads and our own Spatial Extension for BigQuery unlocks a toolbox of more than 100 User Defined Functions and routines giving data engineers, analysts and data scientists a powerful arsenal of tools for advanced spatial analytics, and at almost limitless scale.
So how can we easily migrate our geospatial analysis to BigQuery using CARTO?
In this post, we will outline the key steps required to migrate your PostgreSQL spatial data infrastructure to BigQuery and showcase how the CARTO platform can be used to enrich your data from 3rd party sources, run advanced spatial analytics and develop powerful spatial visualizations to be shared publicly, and within your organization or with specific users.
Step 1 : Setup your spatial data infrastructure in BigQuery
As a first step, we need to create a project in Google Cloud if you don’t have one already. BigQuery has two pricing models, on-demand or flat rate. With on-demand pricing, you pay for what you use and queries run using a shared pool of slots. With flat-rate pricing, you purchase guaranteed capacity. You should decide the option that best fits your organization. If you go for the on-demand option, we recommend you to apply the relevant quotas to ensure you have full control over your account consumption and billing.
Now you’re set up with BigQuery; next go to app.carto.com and create a CARTO account. We offer a free 14-day trial or you can sign up to one of our enterprise plans, by contacting the CARTO team.
Once you have logged into the CARTO Workspace, you can create a BigQuery connection. If you don’t have your own BigQuery data warehouse already, then no problem! CARTO provides an out-of-the-box CARTO Data Warehouse that runs on BigQuery infrastructure for you to get started with.
Step 2 : Import your data from PostgreSQL
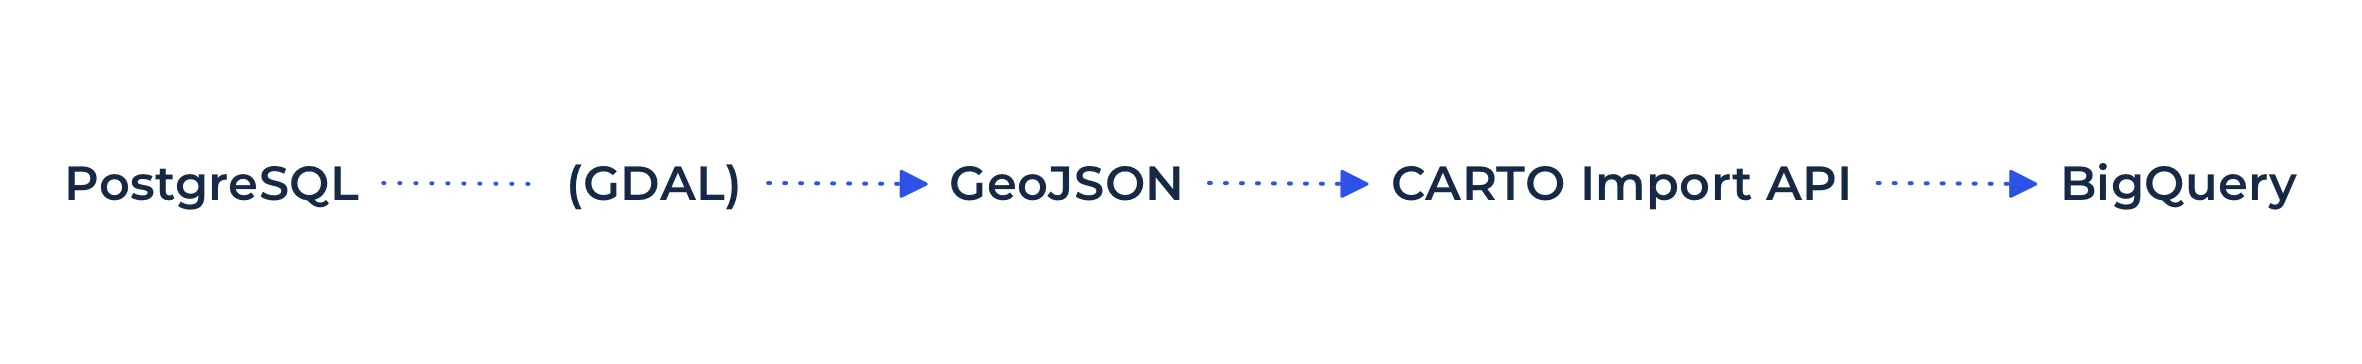
The most effective way to import data from a PostgreSQL database into the BigQuery environment is by using the open source GDAL translator library.
To do this, we’ll use a command line tool called ogr2ogr (from the GDAL library) to convert a table from PostgreSQL into a GeoJSON format, and then we’ll upload the GeoJSON to our BigQuery instance via the Data Explorer.
The first step is to run the command line to export your PostgreSQL table into a GeoJSON file, for more information on how to do this click here.
Let’s focus on a typical spatial use case. In the following example, we are going to export a geographic table that contains data on all of the US counties to a GeoJSON file.
ogr2ogr \
-f GeoJSON geography_usa_county_2019.geojson \
PG:"host='YOURHOST' dbname=carto_dev_data' user=USER password='XXX'" "geography_usa_county_2019"
Once we have our GeoJSON formatted file of US counties, we can import this data table into BigQuery using the interface in our Data Explorer.
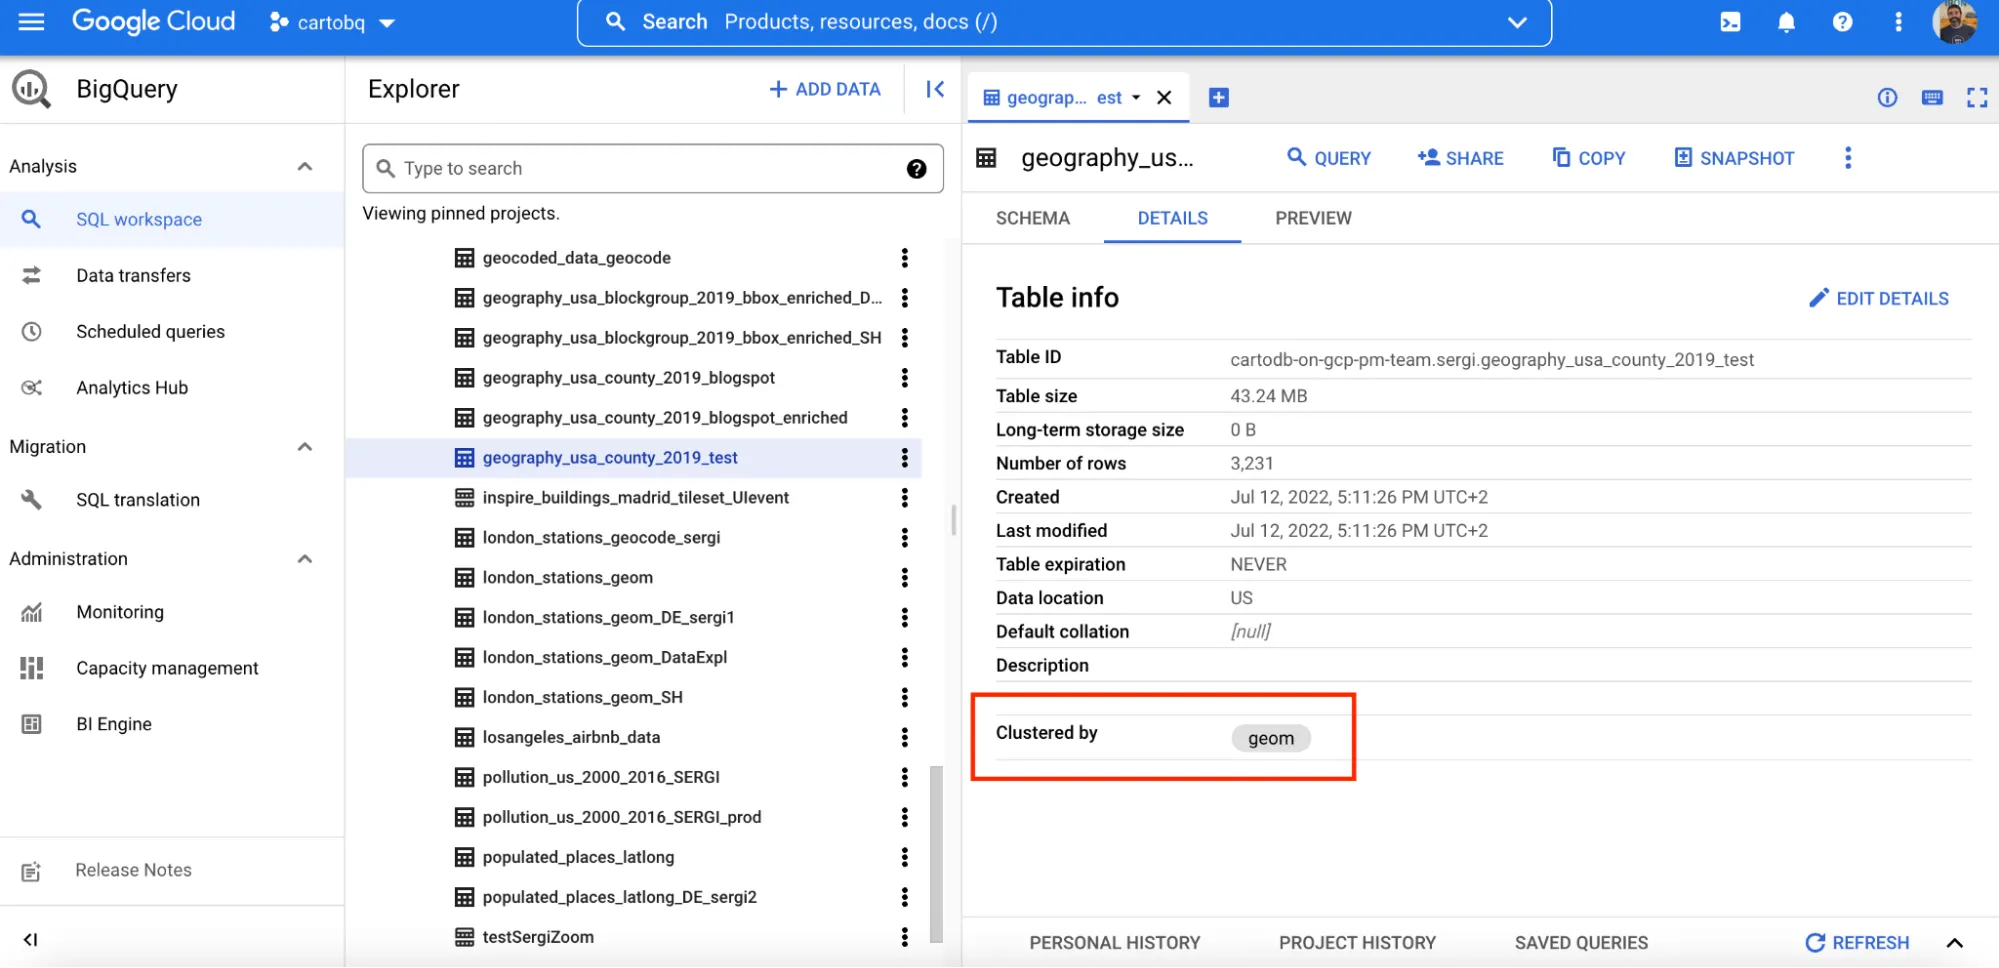
Once the data table of US counties is imported, you’ll be able to see it by accessing the BigQuery section, through the Google Cloud console.
Note: CARTO Import API has a limit of 512MB, if you need to import a larger file you will need to use the standard BigQuery methods for importing. See here for more information.
Step 3: Spatially cluster data tables
.webp)
You’ve probably noticed that the table we imported was clustered by geom.
The table is automatically clustered by geom column using our Import API. This ensures that geospatial queries are faster and more cost-effective. If you have a large amount of geospatial data which you are frequently querying with spatial filters such as SELECT WHERE ST_*(geo_column geo_constant) it might be beneficial for query performance and cost to spatially cluster the stored data. Cluster tables are similar to spatial indexes in PostgreSQL.
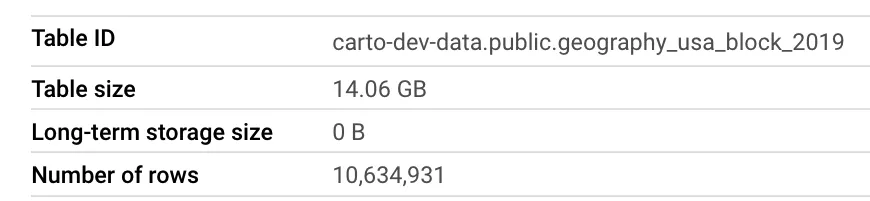
Let’s see an example. The following query runs a spatial filter against a dataset of 14GB and 10M rows.
SELECT *  FROM `carto-dev-data.public.geography_usa_block_2019`
WHERE ST_INTERSECTS(geom  st_geogpoint(-73.971321  40.776676))
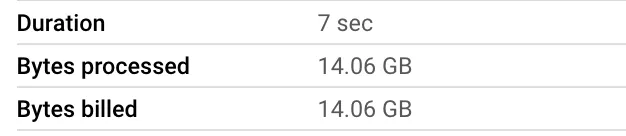
Results without clustering by geom:
Results with clustering by geom:
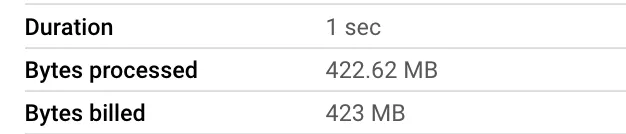
As you can see with this simple test, our query is 7 times faster and 34 times cheaper (the main driver for cost in BigQuery is the bytes processed by the query). The larger the table, the better the performance and cost effectiveness for these types of spatial queries.
To cluster a table by geom via SQL, you can use the following command:
CREATE TABLE `project.dataset.table` CLUSTER BY geom
AS SELECT geom FROM `carto-dev-data.public.geography_usa_block_2019`
You can find more detailed information about clustered tables here.
Step 4: Accelerate your queries
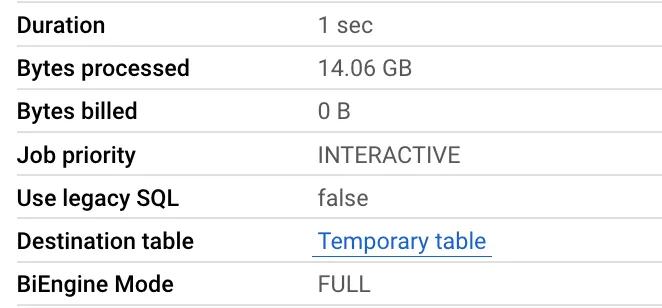
BigQuery BI Engine is a fast, in-memory analysis service. BI Engine lets you analyze data stored in BigQuery with sub-second query response times while providing compute cost savings.
We recommend you enable BigQuery BI Engine to make the most of this smart caching method to improve speed and reduce costs. If we run the previous query with BigQuery’s BI Engine enabled, we don’t get billed for the query as BiEngine Mode is in place:
Step 5: Sharing data
With data hosted in the cloud, one powerful feature of BigQuery (which is a practical limitation of PostgreSQL) is how easy it is to grant access to your data to other users outside of your department, or even with other organizations.
To be able to grant access to your data to an external organization in PostgreSQL, you usually have to deal with your Infrastructure team to open a firewall create a new user in the database for that organization generate security certificates etc.
As a result, in most of the cases, you’ll end up sharing the data as CSV files or developing a custom ETL project to duplicate and move the data, ultimately creating two (or more!) sources of truth! This in the long run, will be more complex and more expensive to maintain, not to mention being a very risky way of managing data.
This process is much simpler with BigQuery. You can easily grant access to datasets, tables or views using the BigQuery console or by using simple SQL.
In the following example, we outline the simple steps to share a table with an external collaborator through the BigQuery console.
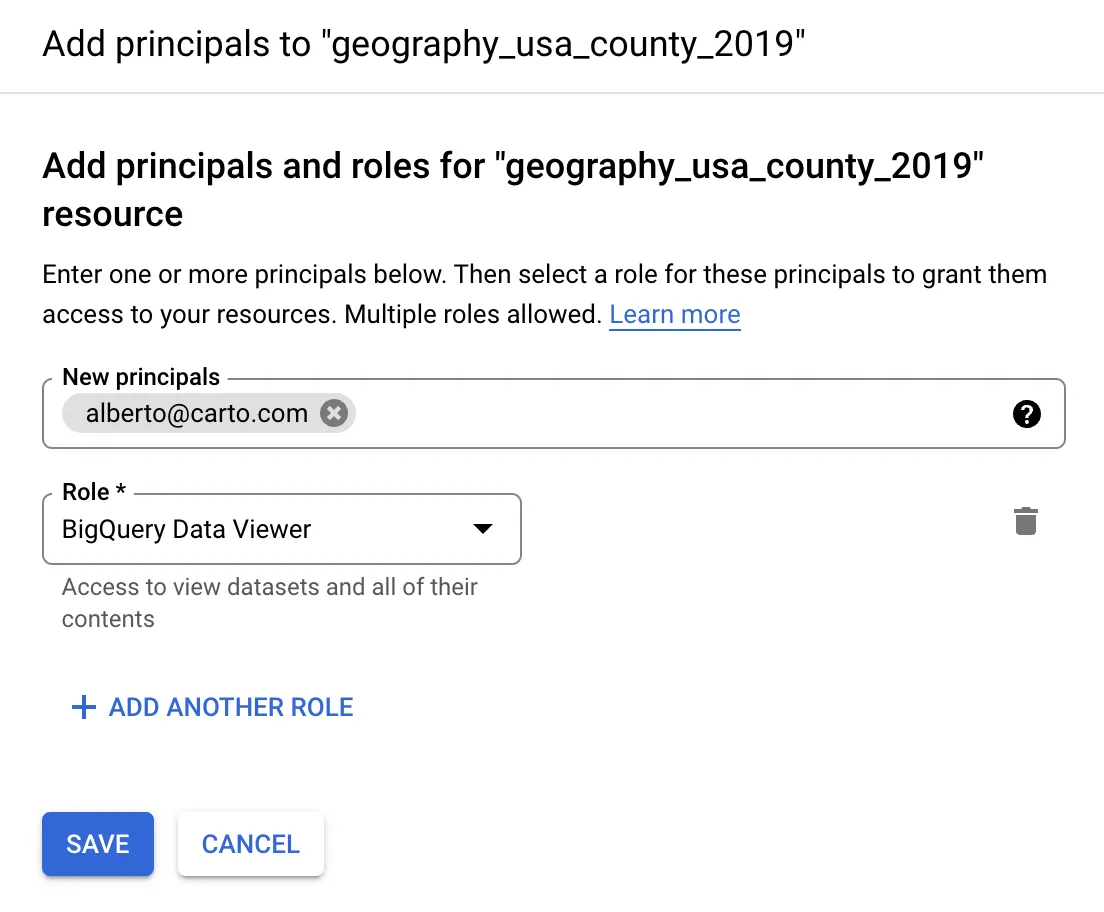
And using SQL:
GRANT `roles/bigquery.dataViewer`
ON TABLE `carto-dev-data.public.geography_usa_county_2019`
TO 'alberto@carto.com';
Easy right? But wait… If I share this dataset will it have an impact on my billing? Absolutely not. Thanks to the separation between compute and storage in BigQuery, the external user will only be billed for the computing used to access your shared data.
In PostgreSQL you’re paying for the computing an external user is doing against your data as you’re granting access to your system. PostgreSQL doesn’t follow the concept of computing and storage separation.
For more info check out https://cloud.google.com/bigquery/docs/dataset-access-controls
Step 6: Spatial analysis and visualization using CARTO
Once we have imported our -geography_usa_county_2019- data to the folder under the BigQuery connection, we can now start to run some powerful spatial processing and analyses, such as enriching our dataset with 3rd party data variables.
The first step is to move within the CARTO Workspace to our Data Observatory. This is a curated catalog of more than 11 000 public and premium spatial datasets you can use to enrich your spatial analysis. For this example, we are going to enrich our original dataset with sociodemographic variables from the 2019 American Community Survey at Census Block Group level. To do this, we first need to subscribe to this dataset from the Spatial Data Catalog using the CARTO interface.
Once subscribed to the dataset we can start the simple data enrichment process using the CARTO interface.
Note: To enrich the table, we can use any variable we need for our analysis. In this particular scenario, we are using sociodemographic variables about higher education degrees and gender, so we can generate insights on the level of education and gender in each US county.
This same enrichment process can be run using the following SQL commands:
CALL `carto-un`.carto.DATAOBS_ENRICH_POLYGONS('cartodb-on-gcp-pm-team.sergi.geography_usa_county_2019' 'geom' [('total_pop_3ed336df' 'SUM') ('male_pop_a385623' 'SUM') ('female_pop_88348615' 'SUM') ('bachelors_degre_fa322b80' 'SUM') ('masters_degree_fbf24be8' 'SUM') ('doctorate_degre_abdd3309' 'SUM')] NULL ['cartodb-on-gcp-pm-team.sergi.geography_usa_county_2019_enriched3'] 'carto-data.ac_lqe3zwgu');
For detailed information on how to enrich your data with spatial datasets from the CARTO Data Observatory, take a look at our documentation.
Once we have enriched our table, we can start creating an interactive map visualization in Builder. Builder offers advanced map making and publishing features alongside powerful point-and-click spatial analysis. Using Builder, we can analyze our data, add map features, styling, widgets, tooltips and easily share the results of our analysis throughout our organization, or create a publicly accessible map visualizations.
Once published the we can access the public map visualization here:
Furthermore, by sharing the map publicly we are able to use the ID of the generated map to incorporate the visualization into a spatial app developed using deck.gl. With an html template like the one shown in this example from our CARTO documentation we just need to change the code line and input our Map ID.
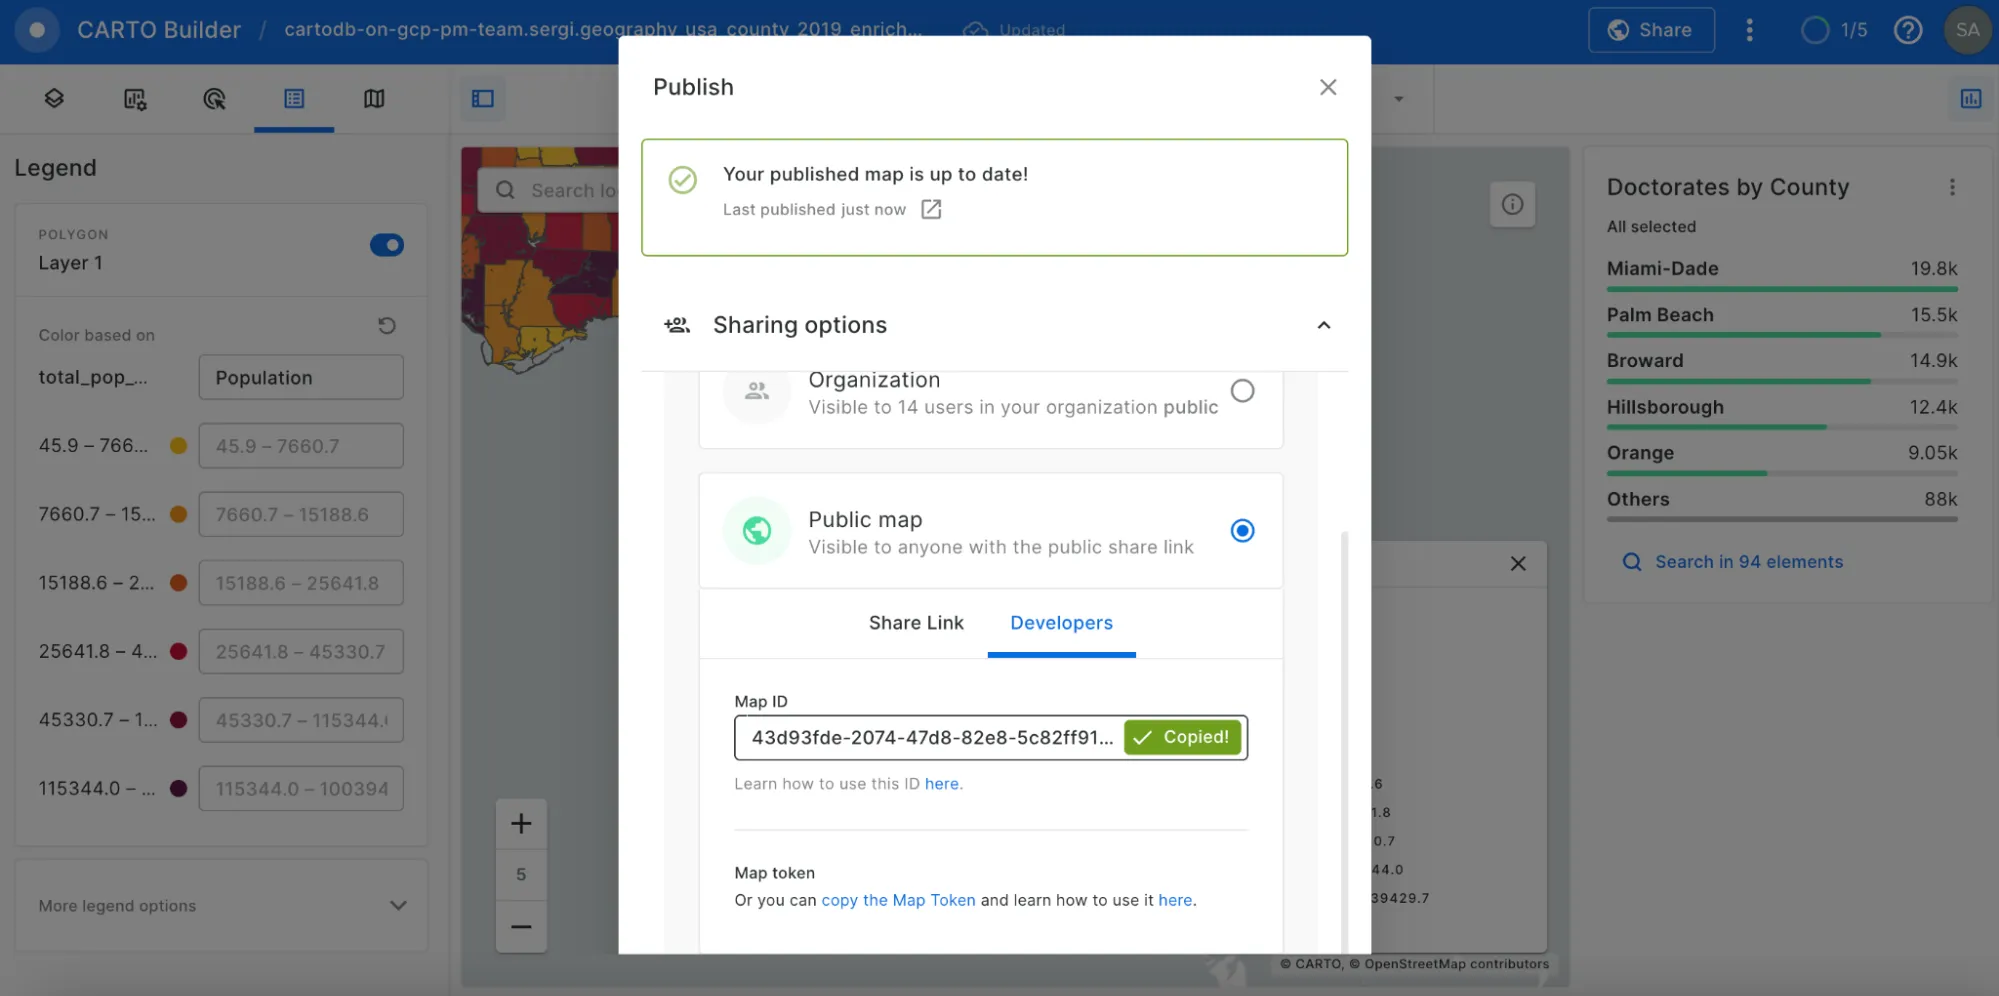
Map ID in Sharing options
In the html template we are using a fetchmap function to extract the properties of the map. Finally, to visualize your map simply, you just need to insert the generated html template in the codepen site.
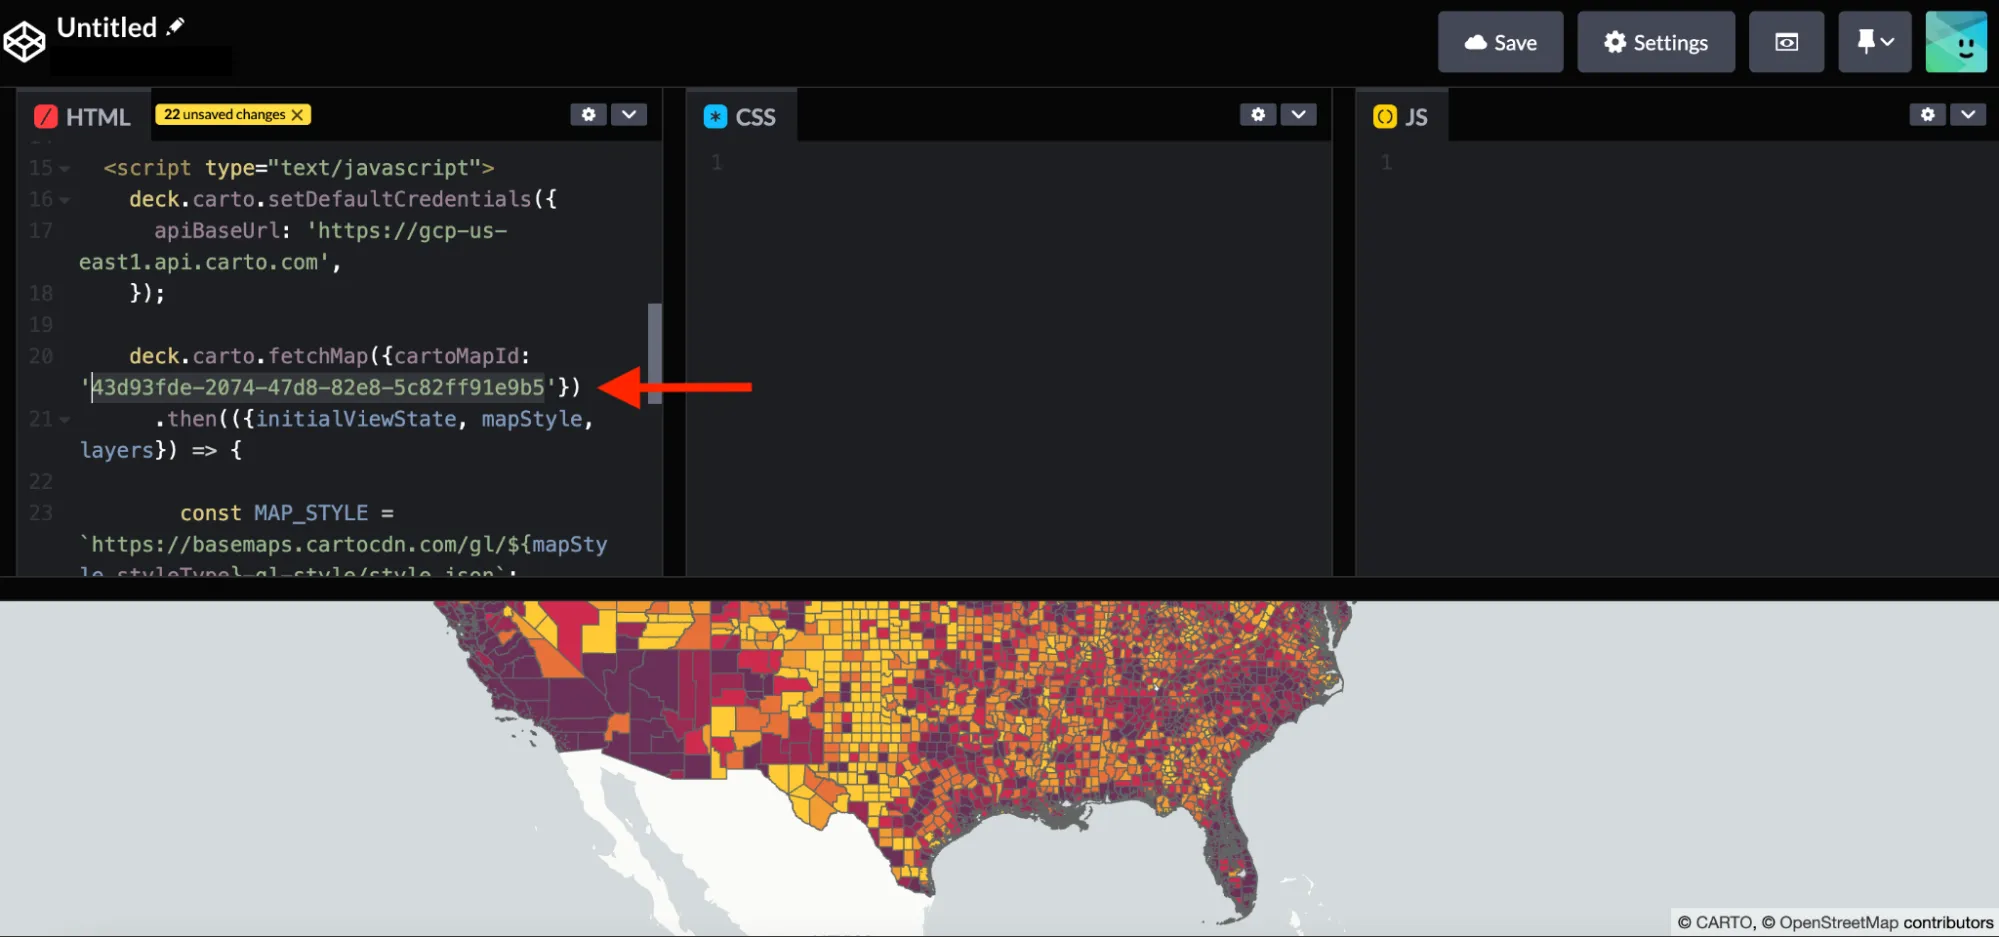
Code line of the Map ID to change in the html template (Visualization in Codepen)
So in 6 simple steps we have outlined how geospatial workflows can be easily migrated from PostgreSQL to a cloud data warehouse platform such as BigQuery. Native support for geospatial in BigQuery and the Spatial Extension that CARTO offers, bring a wealth of functionality for analytical workflows using location data with the added benefits of security, scalability, shareability and cost effectiveness. If you’d like to find out how to migrate your PostgreSQL spatial stack to the cloud reach out to our experts. We’ll happily support you on your journey to the cloud.