Map Tiles: Everything You Need To Know


Visualizing geospatial data has always been a complex issue, and with location data volumes on the increase, this complexity will no doubt continue in the future. When visualizing geospatial data, some key characteristics need to be considered:
- At high zoom scales, you only need to show a generalized or limited view of the data, and at lower levels, you need to show most or all of the data in full detail.
- Limitations of the browser in terms of how much data can be efficiently visualized
- The need to integrate and use databases to handle the heavy data lifting or tile creation.
Fortunately all these considerations have been solved from a technical standpoint, yet the adoption of these geospatial visualization tools has been limited. They require more work to develop and maintain, and for front-end developers who are generally the teams responsible for implementing these services, they often require heavy support from back-end teams or those maintaining core databases, not to mention the increased load map tile requests can place on a database.
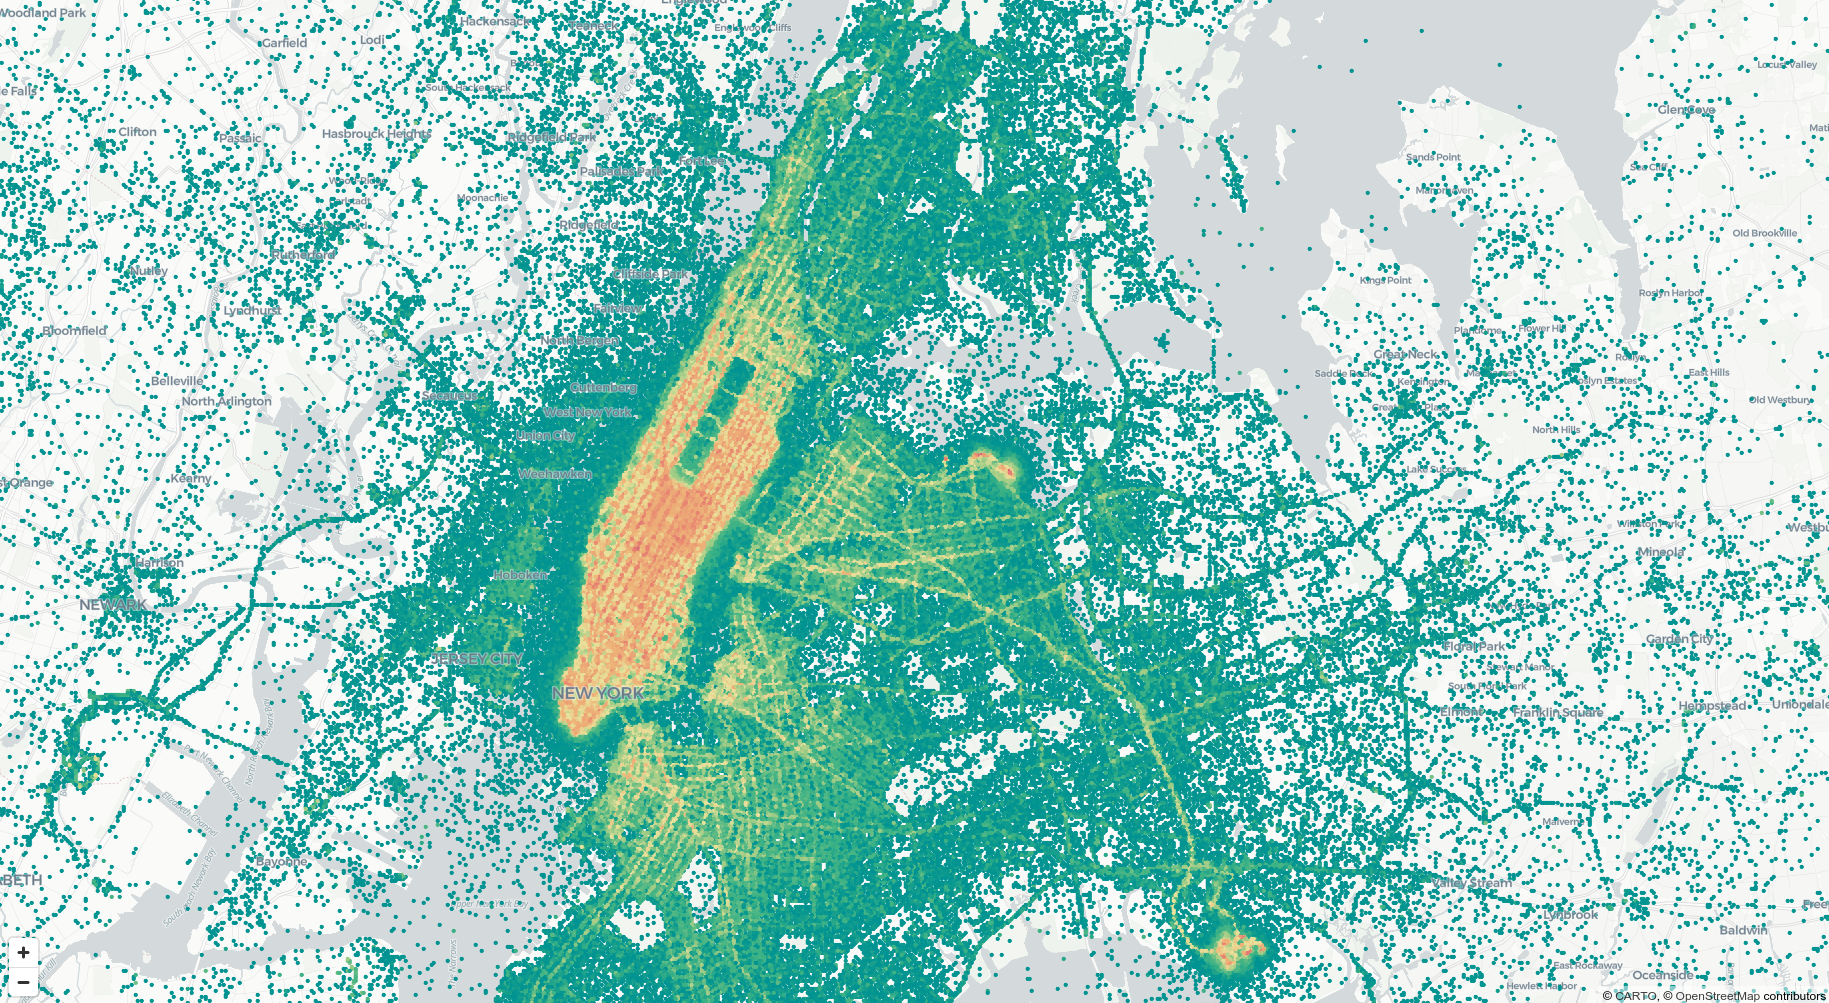
Loading data from files is slow, generating tiles is tedious
More often than not, maps on the web are generated from data files being loaded via a web map library, or else from tiles of common geometries like zip codes or census block groups that have been pregenerated. Beyond that, developers are left with few options.
The most commonly used option is Mapbox or Google Maps with tippecanoe, an open source library developed by Mapbox to create map tiles (if you aren’t familiar with map tiles check this video). Mapbox provides great support for basemaps and location data services like geocoding, routing, and more. The downside to this is that many users of course want to show other data on top of the basemap - not just the basemap itself.
The workaround here is to use tippecanoe to turn your geospatial data into a file known as MBTiles. This can compress data to make it more efficient to visualize. Finally, Mapbox allows you to upload this data to host and style it.
But this is a tedious, multi-step process and only a viable solution for one-off visualizations. Take a look at this post to see the different steps and skills you need just to create the tiles.
Even with this process there are two major issues for developers:
- What if your underlying data changes?
- What if you need tile files larger than 6GB?
The answer to the first question is that you need to repeat the process every single time the data changes. And for the latter, you are left to find your own solution. Not to mention the fact that if you have a database or data warehouse, you have to grab a data extract every time to kick this process off.
Luckily, alternative approaches are available which overcome both of these obstacles!
A brief introduction to map tiles
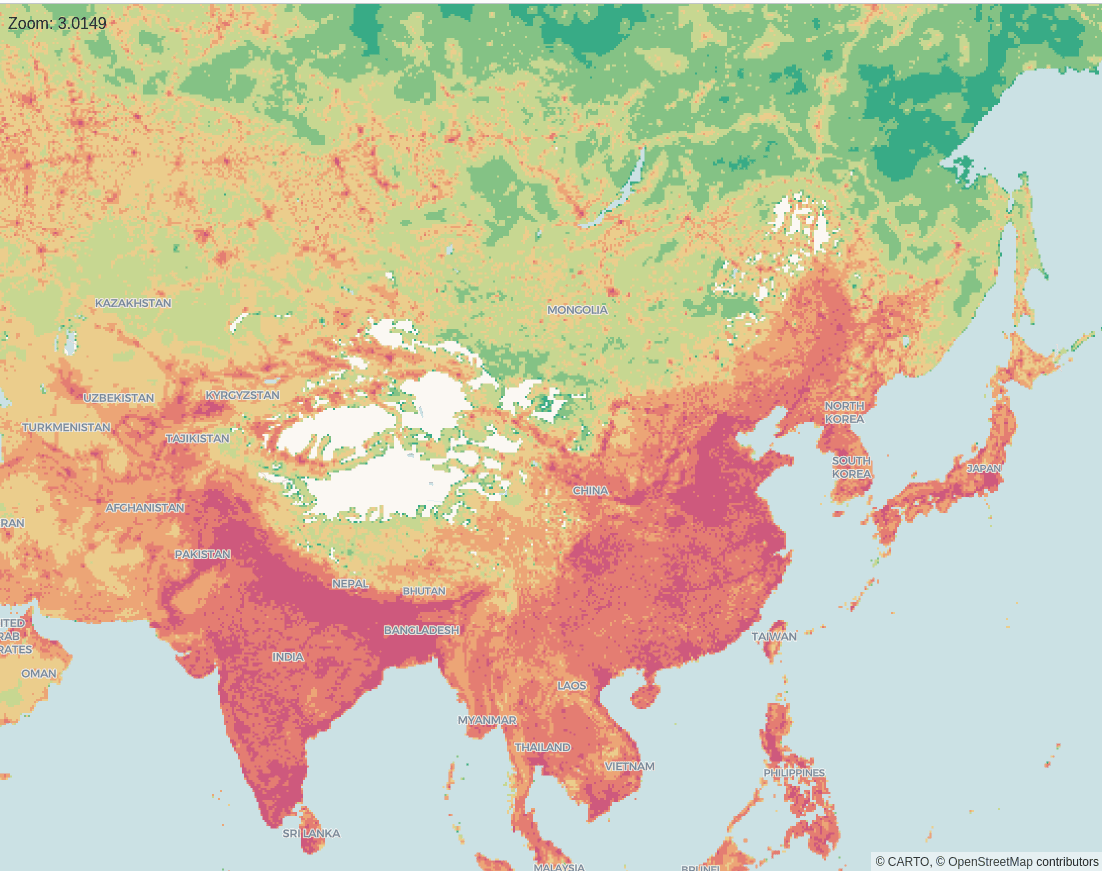
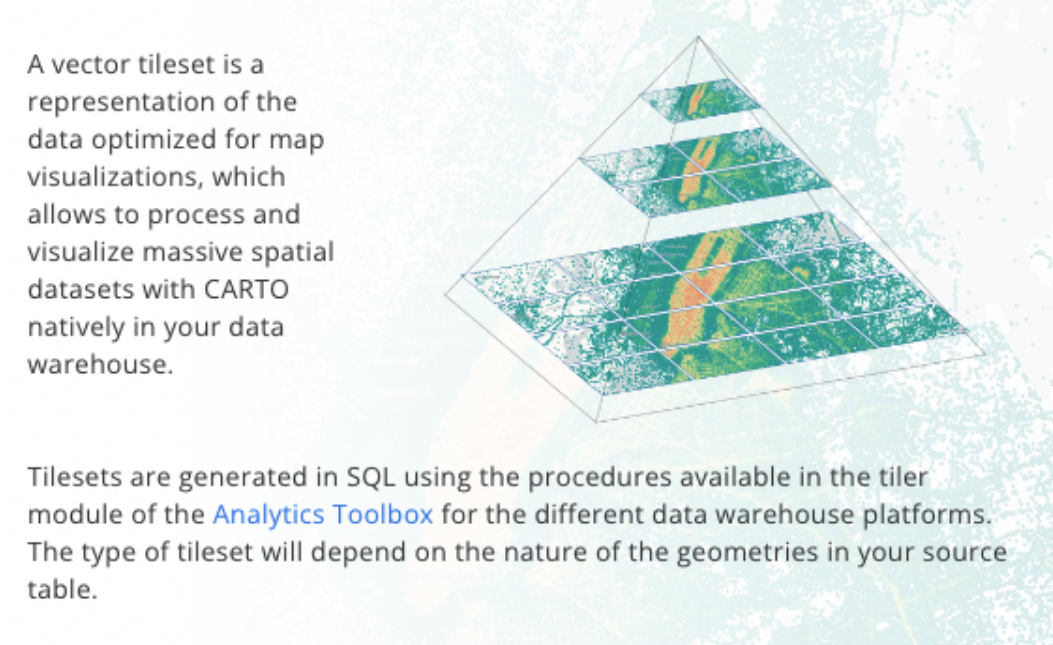
In the rest of this post we are going to talk about the concept of map tiles, so what are map tiles? In short, map tiles were invented by Google when creating Google Maps. Instead of rendering the entire map each time the user zooms in and out, the map is broken down into many smaller parts.
There are a set of tiles for each zoom level that multiply each time you zoom in. In addition, they only show the required data for each level. For example you don’t need to see roads when looking at the entire world, so that data is left off the map.
These smaller tiles not only compress data, but hand off the rendering to the web browser, further reducing the payload required by the map.
This article I wrote is a much more in depth look at map tiles, how they work, and the history behind them and web maps in general if you want to take a deeper look.
Enabling tiling in data warehouses
When we developed our tiling solution we wanted to address these exact issues: data scalability and data updates. We built a tiling system that works directly in AWS Redshift, BigQuery, Databricks, PostGIS and Snowflake. Tiles are created inside the data warehouse or database using the existing computing power of these solutions, removing the need to move data around. This saves time and resources, and crucially allows you to retain your data warehouse as the single source of truth.
All of this can be achieved without code; CARTO allows you to create a tileset in the same databases and data warehouses without writing any code. You can either use the Create Tileset wizard (available on every table's page in the Data Observatory) or the Create Tileset component in Workflows.

If you prefer to use SQL, you can use a simple SQL stored procedure from our Analytics Toolbox, such as:
  CALL carto.CREATE_SIMPLE_TILESET(
  'SELECT geom, population, category FROM mypopulationtable',
  'MYDB.MYSCHEMA.population_tileset',
  '{
	"geom_column": "geom",
	"zoom_min": 0, "zoom_max": 6,
	"properties": {
  	"population": "Number",
  	"category": "String"
	}
  }'
);
For very large amounts of data you can scale tiles as required, and you can control how and which features are dropped in what order, and even the tile size payload.
But this is only one of the methods of tiling that are supported.
Three tiling methods in CARTO
There are three methods of visualization that CARTO supports:
- Raw GeoJSON
- Dynamic tiles
- Pregenerated tiles
All of our visualizations use Deck.GL, which provides for highly performant visualization already, but when paired with CARTO tiling, this benefit is even more apparent.
GeoJSON
For small enough datasets, CARTO will call the database or data warehouse via a pre-established connection. If the Maps API (the underlying API that powers all map data) determines that the data is small enough to render without tiling, it will return GeoJSON generated from the data warehouse. DeckGL (our underlying rendering library) supports fairly large GeoJSON files (roughly 50MB) but beyond that performance starts to degrade.
Dynamic tiles
Dynamic tiles are triggered when the query or table goes beyond the size appropriate for GeoJSON. The great part about dynamic tiles is that they are created at query time, meaning that you do not have to do anything extra to actually create the tiles. As tiles are requested by the user, they are stored in our global CDN (fastly in the case of our cloud hosted platform) and in a cache for our self-hosted version. You can learn more about the benefits of dynamic tiles in this guide.
Pregenerated tiles
The final example is creating pre-generated tiles. You can see an example of this with 7.2 billion points using the same process as described in this post. Creating these tiles is very cost effective if you are already paying for a data warehouse; you are using the resources you already have in place.
Native spatial index support
As Spatial Indexes - such as H3 and Quadbins - are gaining in popularity, CARTO now supports native tiles, both dynamic and pregenerated. This means that when your table contains a Spatial Index, you don’t need to provide a geometry to CARTO to render your data; this is achieved through the Spatial Index “reference.” You can do this all in the user interface, and in ad hoc queries in Builder. Below is an example of this with ~349k records using the H3 index.
Since every index is consistent and the data size is always smaller than a geometry, the speed of rendering, query time and payload is much faster. CARTO also handles the aggregation of numeric and categorical data in your indexes with no extra work. Other platforms such as Foursquare Studio (formerly known as Unfolded.ai) and Kepler GL support index layers and tiles, but they still require pregeneration in a command line tool and don’t support dynamic tiling (all of their examples are CDN cached).
Spatial indexes require a bit of a change in your thinking geospatially as the hexagons are not in fact geometries, but this report is a great introduction to the concept.
Support for all development frameworks
CARTO provides development tools that match your current stack so you do not need to replace your current application. For those using Mapbox or Google Maps we have libraries and examples for Mapbox GL JS and Google Maps or you can use DeckGL directly or Amazon Location.
CARTO for React provides a complete application framework based on Material UI and create-react-app that provides integrations for maps and tilesets but also UI layouts, widgets, map controls, authentication, and more. You can also integrate with <a href= Angular and Vue.js too.
Visualizing Big Data with CARTO
At CARTO, we’re arming our users with the tools to work with ever larger spatial datasets. Want to find out more? Request a demo to see big data analytics in action, or sign up for a free trial and have a go yourself!