1
2
3
4
5
6
7
8
9
10
11
12
13
14
15
16
17
18
19
20
21
22
23
24
25
26
27
28
29
30
31
32
33
34
35
36
37
38
39
40
41
42
43
44
45
46
47
48
49
50
51
52
53
54
55
56
57
58
59
60
61
62
63
64
65
66
67
68
69
70
71
72
73
74
75
76
77
78
79
80
81
82
83
84
85
86
87
88
89
90
91
92
93
94
95
96
97
98
99
100
101
102
103
104
105
106
107
108
109
110
111
112
113
| <!DOCTYPE html>
<html>
<head>
<title>Change order | CARTO</title>
<meta name="viewport" content="initial-scale=1.0">
<meta charset="utf-8">
<link href="https://fonts.googleapis.com/css?family=Montserrat:400,600,700|Open+Sans:300,400,600" rel="stylesheet">
<!-- Include Google Maps -->
<script src="https://maps.googleapis.com/maps/api/js?key=AIzaSyDpVNTQI60ossApFzZ3dwSMZ1LcxOTY-rI&v=3.35"></script>
<!-- Include CARTO.js -->
<script src="https://libs.cartocdn.com/carto.js/v4.2.0/carto.min.js"></script>
<link href="https://carto.com/developers/carto-js/examples/maps/public/style.css" rel="stylesheet">
</head>
<body>
<div id="map"></div>
<aside class="toolbox">
<div class="box">
<header>
<h1>Move the layers</h1>
<button class="github-logo js-source-link"></button>
</header>
<section>
<p class="description open-sans">Update the order of your layers.</p>
<div class="separator"></div>
<section class="usage">
<header>USAGE</header>
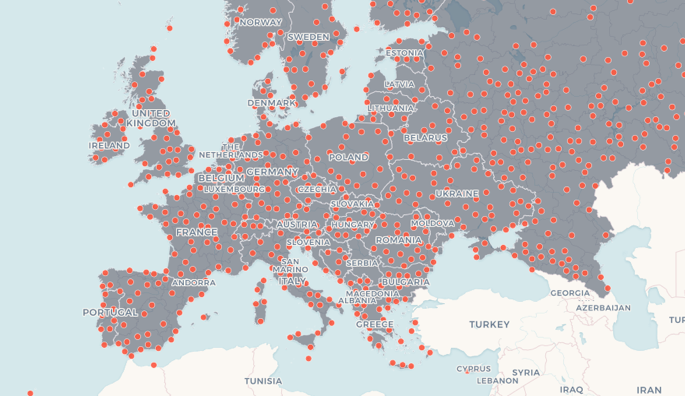
<p class="open-sans">Click to move countries layer to front/back</p>
</section>
<div id="controls">
<ul>
<li onclick="bringToBack()">
<input type="radio" name="style" id="bringToBack">
<label for="bringToBack">Bring to back</label>
</li>
<li onclick="bringToFront()">
<input type="radio" name="style" checked id="bringToFront">
<label for="bringToFront">Bring to front</label>
</li>
</ul>
</div>
</section>
<footer class="js-footer"></footer>
</div>
</aside>
<script>
var map = new google.maps.Map(document.getElementById('map'), {
center: { lat: 30, lng: 0 },
zoom: 3,
fullscreenControl: false,
gestureHandling: 'cooperative'
});
// Hide the map labels and geometry strokes
map.set('styles', [{
elementType: 'labels',
stylers: [{ visibility: 'off' }]
}, {
elementType: 'geometry.stroke',
stylers: [{ visibility: 'off' }]
}]);
const client = new carto.Client({
apiKey: 'default_public',
username: 'cartojs-test'
});
const spainCitiesSource = new carto.source.Dataset('ne_10m_populated_places_simple');
const spainCitiesStyle = new carto.style.CartoCSS(`
#layer {
marker-width: 7;
marker-fill: #EE4D5A;
marker-line-color: #FFFFFF;
}
`);
const spainCitiesLayer = new carto.layer.Layer(spainCitiesSource, spainCitiesStyle);
const europeCountriesSource = new carto.source.Dataset('ne_adm0_europe');
const europeCountriesStyle = new carto.style.CartoCSS(`
#layer {
polygon-fill: #826DBA;
polygon-opacity: 0.8;
::outline {
line-width: 1;
line-color: #FFFFFF;
line-opacity: 0.8;
}
}
`);
const europeCountriesLayer = new carto.layer.Layer(europeCountriesSource, europeCountriesStyle);
client.addLayers([europeCountriesLayer, spainCitiesLayer]);
map.overlayMapTypes.push(client.getGoogleMapsMapType(map));
function bringToBack() {
spainCitiesLayer.bringToBack();
// or
// spainCitiesLayer.setOrder(0);
// or
// client.moveLayer(spainCitiesLayer, 0);
}
function bringToFront() {
spainCitiesLayer.bringToFront();
// or
// spainCitiesLayer.setOrder(1);
// or
// client.moveLayer(spainCitiesLayer, 1);
}
</script>
</body>
</html>
|

