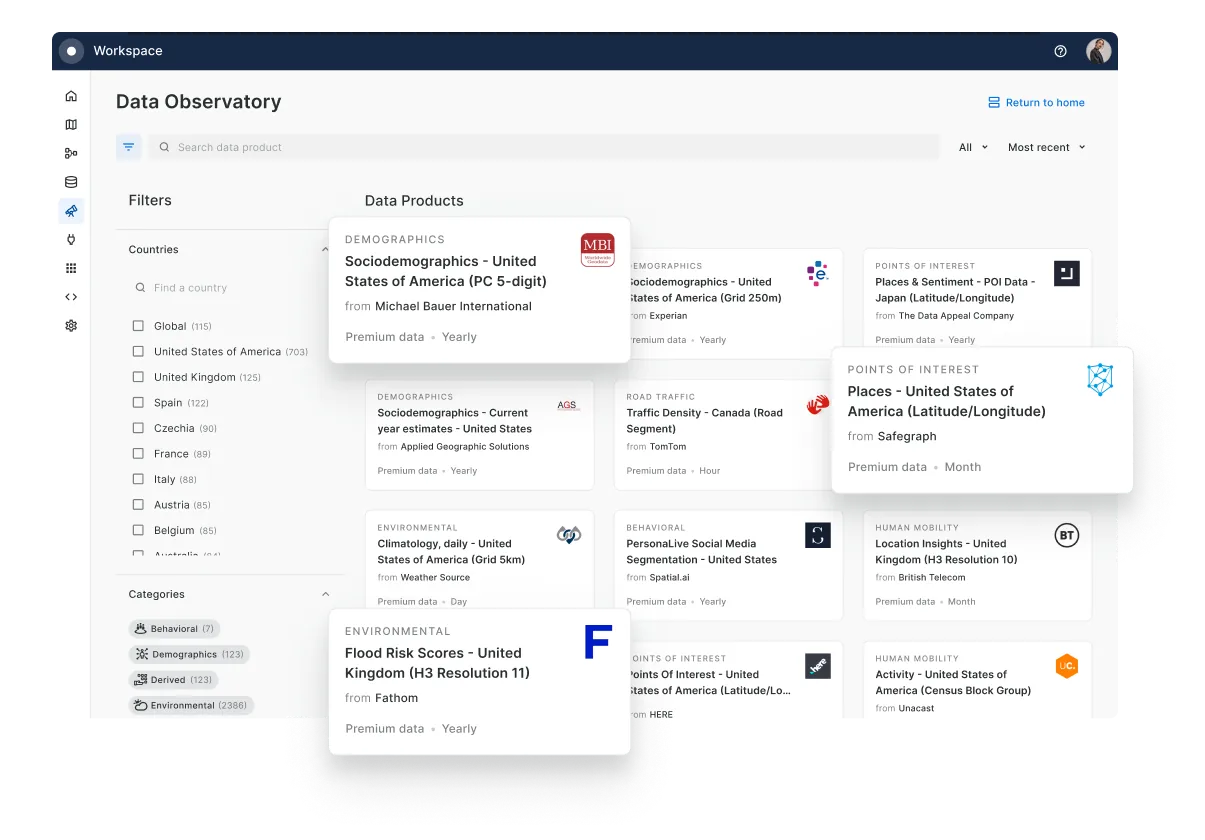
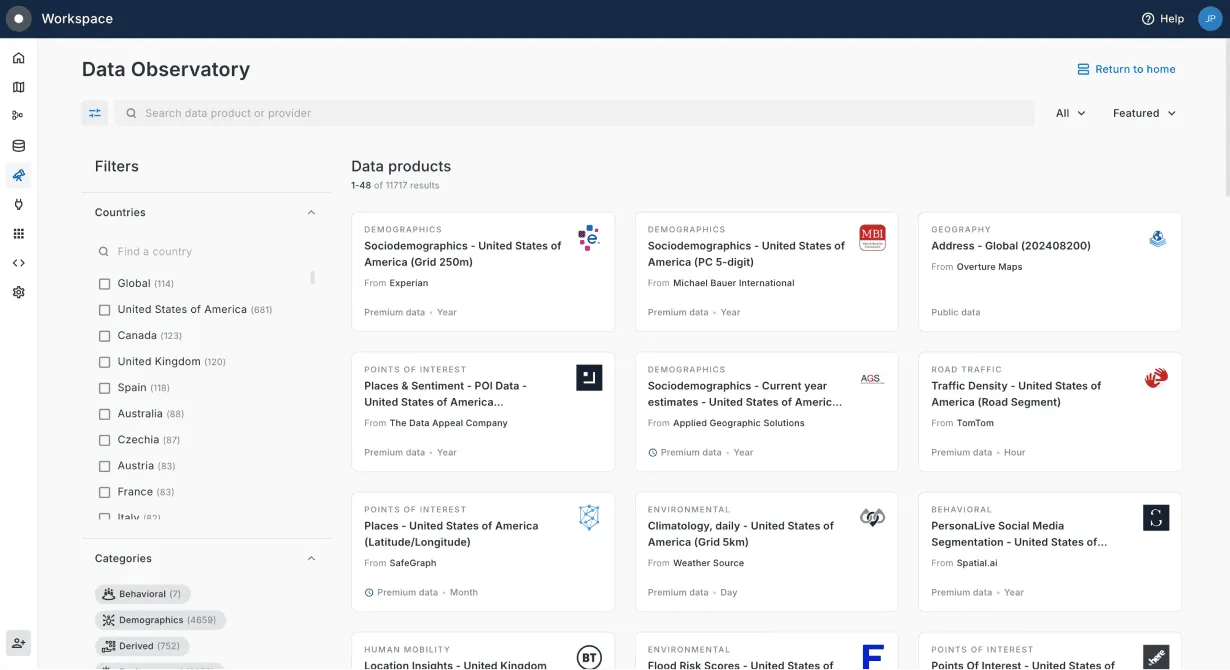
Data Observatory
Augment your internal data & broaden your analysis with the latest & greatest in third party location data, reducing the time spent gathering, evaluating & cleaning data.

The Data Observatory in numbers
CARTO's Data Observatory brings together thousands of open and premium datasets enabling a wide range of organizations to take the pain out of sourcing spatial data.
Explore catalogWorking with spatial data
- Finding the location data I need can take weeks as there are too many providers offering similar data and it’s difficult to assess quality
- Licensing can also be a long and tedious process: I’ll have to negotiate terms with every single data provider
- Enriching my data will be hard as I’ll need to deal with different formats and support geographies


How the Data Observatory can help
- Simple access to public and premium data from vetted sources
- Faster licensing process thanks to existing agreements with leading data providers
- Easy enrichment with data already presented in standardized formats
How does it work?
You can access open and premium datasets from Data Observatory in your own work environment.
For Data Scientists
Discover the most suitable datasets for your analysis, access data, select variables you want to use and enrich your dataframes - all from your Jupyter notebook using CARTOframes.
1from cartoframes.data.observatory import *
2dataset = Dataset.get('ags_sociodemogr_a7e14220')
3variables = dataset.variables
4variables
1[<Variable.get('BLOCKGROUP_30e525a6')> #'Geographic Identifier',
2<Variable.get('POPCY_4534fac4')> #'Population (2019A)',
3<Variable.get('POPCYGRP_3033ef2e')> #'Population in Group Quarters (2019A)',
4<Variable.get('POPCYGRPI_1e42899')> #'Institutional Group Quarters Population (2019A)',
5<Variable.get('AGECY0004_aaae373a')> #'Population age 0-4 (2019A)',
6<Variable.get('AGECY0509_d2d4896c')> #'Population age 5-9 (2019A)',
7...]
For Analysts
Easily bring spatial datasets to CARTO Builder, our drag and drop mapping tool, extract key insights and create lightweight, intuitive dashboards to share across your organization.
For Developers
Generate custom tilesets from your Data Observatory datasets and integrate them in your spatial analytics apps using our developer toolkit.
Derived • CARTO
Spatial Features - USA (Quadgrid 15)
population, retail, food_drink
Demographics • Instituto Nacional de Estadística
Sociodemographics - Spain (Census Sections)
population_per_sqkm, households_per_sqkm, foreigners_per_sqkm
Demographics • Consumer Data Research Centre
New American Atlas - USA (Census Tract)
spielman_singleton_group
Demographics • American Community Survey
Sociodemographics - USA (Census Block Group, 2018, 5yrs)
total_pop, households, median_income, income_per_capita
Points of Interest • OpenStreetMap
Nodes - France (Latitude/Longitude)
amenity
Integrate with other tools
Want to access datasets from other platforms via the Data Observatory? Get access to data from BigQuery or contact us to discuss your needs in other platforms, such as Snowflake or AWS.
Contact us
DATA AVAILABLE
Thousands of datasets at your fingertips


Data Analysis Examples
CPG Firms
Category
Data Set


Data Analysis Examples
Credit Card Providers
Category
Data Set


Data Analysis Examples
Local Governments
Category
Data Set


Data Analysis Examples
Retail Big Box Stores
Category
Data Set
This project has received funding from the European Union’s Horizon 2020 research and innovation programme under grant agreement No 960401.