

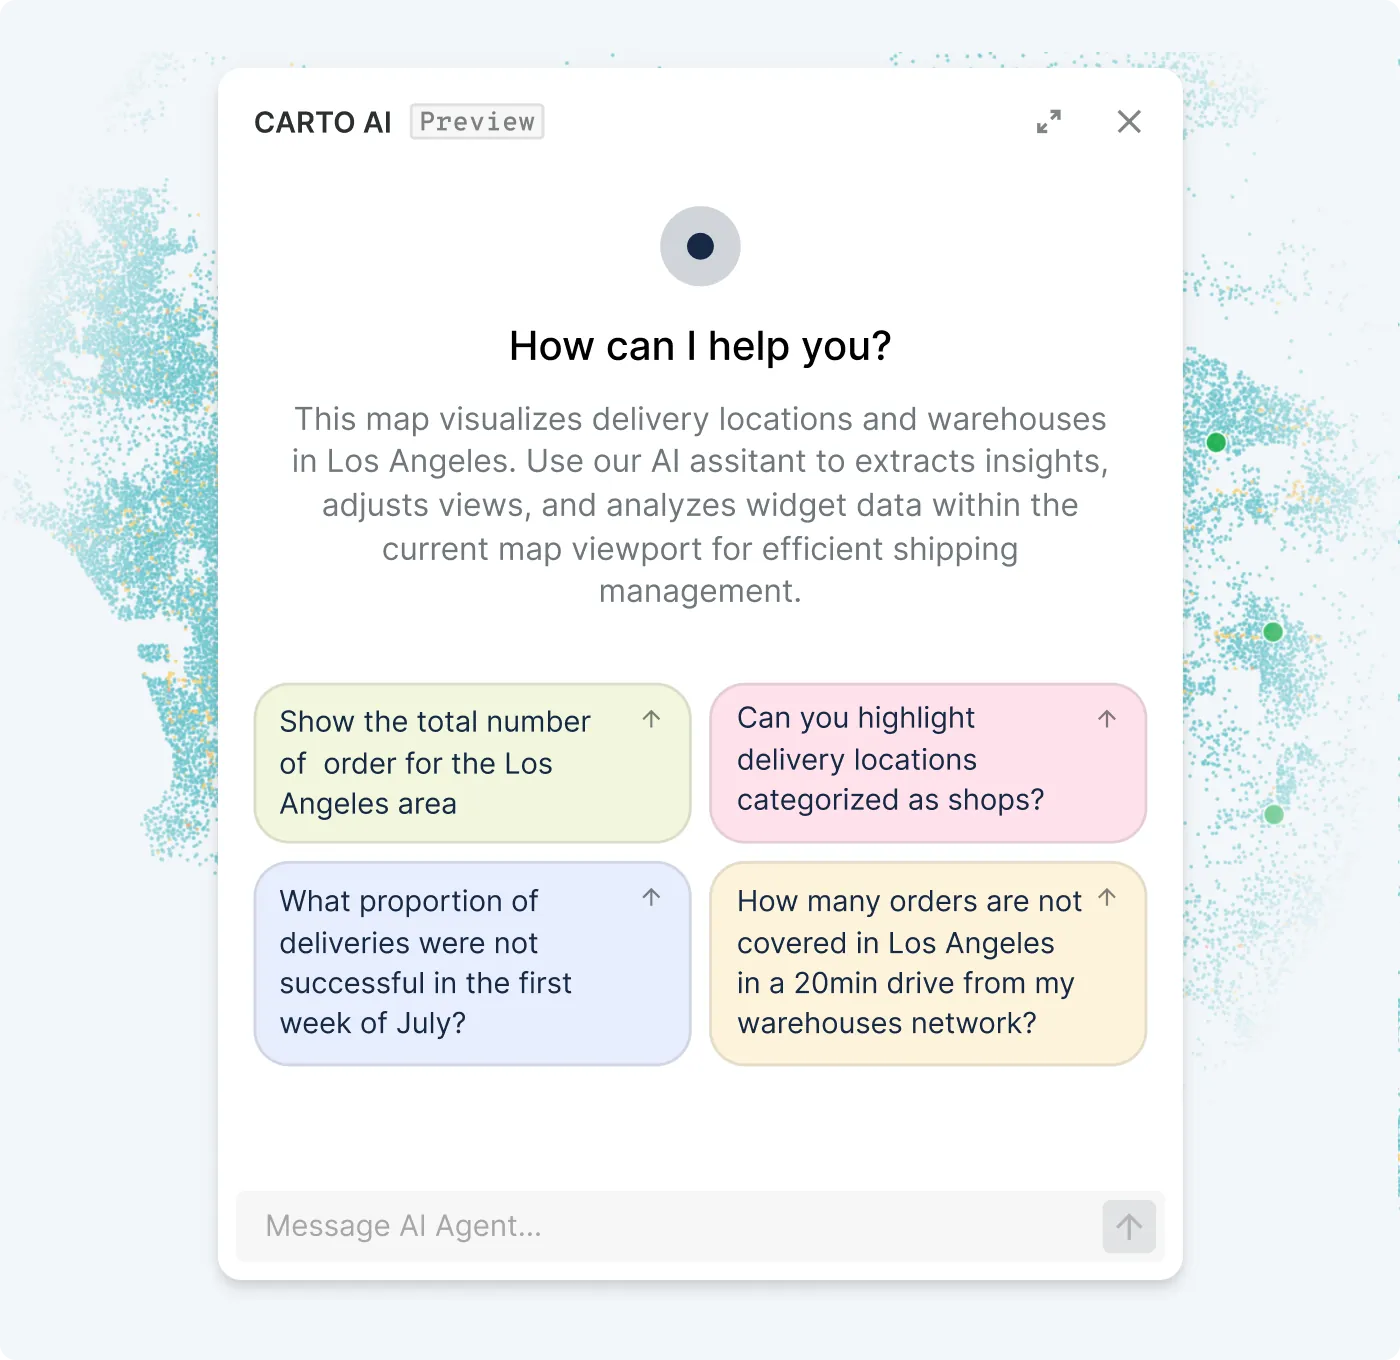
The Agentic GIS Platform
with your data never leaving BigQuery


Bring geospatial into your cloud ecosystem
Start today:
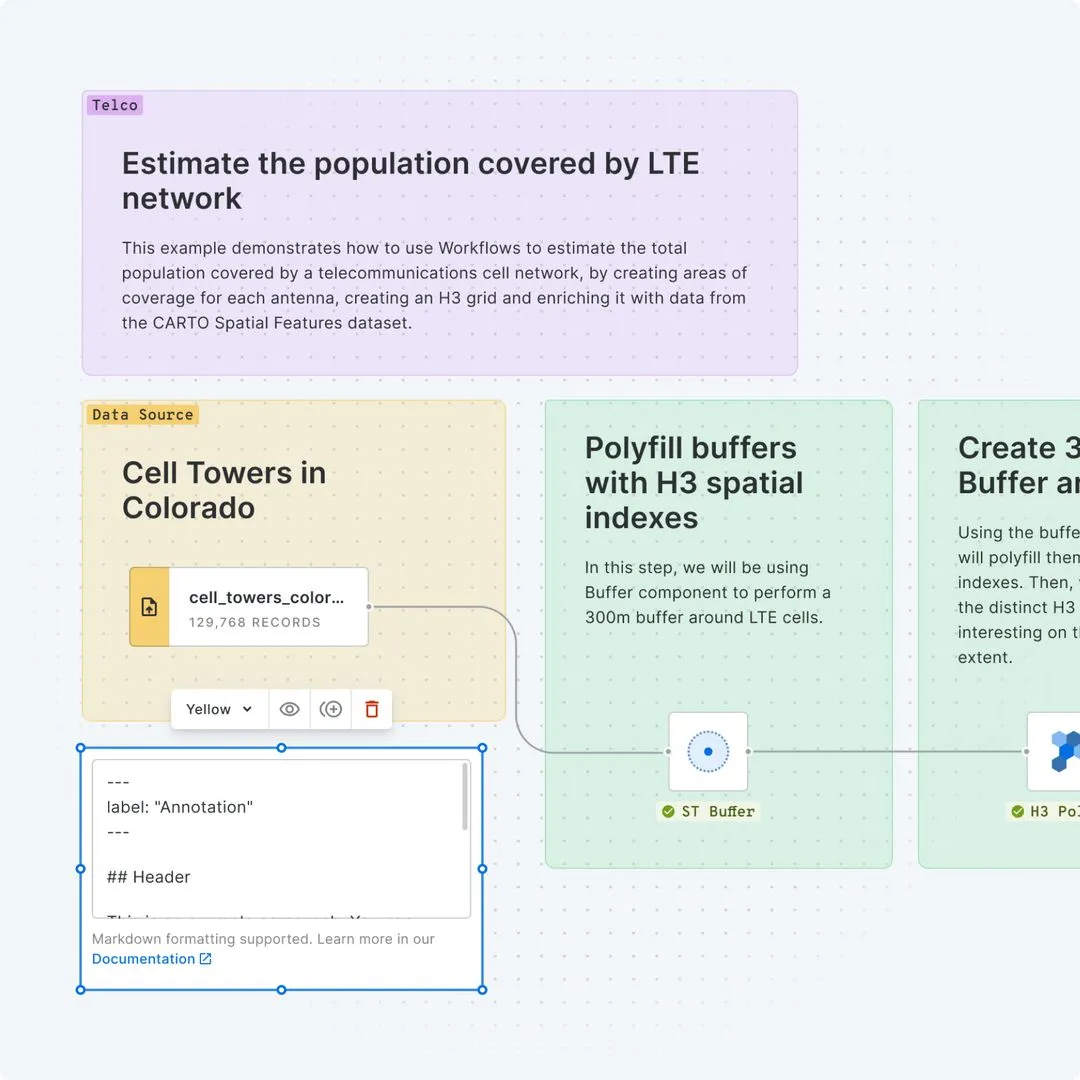
One Location Intelligence platform for all users
Redefine how GIS serves your organization with an end-to-end platform built for the enterprise. From data analysts to developers, CARTO’s tools make spatial analysis accessible to everyone.

Get inspired by our customers

With CARTO's AI Agents, predictive growth insights move beyond data analysts and into the hands of every decision-maker. Now, anyone can ask our data questions like 'Which neighborhoods will grow fastest?' and get instant answers - speeding up site planning and providing a real competitive edge.

Many firms are still using PDF reports and Powerpoint. Using CARTO, we are now moving beyond static information to provide digital solutions and a superior experience. By giving our consultants an unprecedented amount of information on locations, we can achieve our goals faster - using data to move away from traditional intuition-based decision-making.


At EQT, we constantly seek ways to enhance the strategic value of our investments and improve the decision-making process. CARTO has been a game-changer for EQT, their cloud-native platform, seamless data integration, Builder for visualization and Analytics Toolbox make it much easier for us to assess investment opportunities and provide strategic advice to our portfolio companies.

The ability to scale our data is a big selling point, as well as the features in the Analytics Toolbox. I also love how easy it is to plot something using CARTO Workflows. As a team leader, I am looking forward to what we can create and achieve using CARTO.


Managing asset and risk data at scale can be complex and costly. CARTO helps you to work with hyper-local risk intelligence to optimize decision-making and reduce expenses.
Decision-making with vast amounts of sensitive data requires robust security and real-time capabilities. Ensure data privacy while leveraging live insights for on-demand network planning.
Rigid, legacy data systems slow down decision-making in a fast-moving market. Use CARTO for flexible, seamless analytics and easily make smarter financial decisions.
Integrating massive datasets across multiple sources can be overwhelming. Seamlessly combine Location Intelligence for smarter omnichannel retail decisions.
Reaching the right audience requires precision at scale. Leverage hyper-local data to pinpoint target customers and maximize ROI.

Optimizing fleets and planning mobility at scale is complex and resource-intensive. Leverage advanced spatial analytics to enhance efficiency, reduce costs, and streamline logistics operations.
Check out our resources & join our
growing spatial community

TALK TO US
Request a demo
Schedule a 20-minute meeting with our experts to understand how you can use spatial analysis in your organization.