Hotspot analysis is a spatial analysis technique used to identify and evaluate statistically significant spatial clusters of high or low values in a dataset i.e. its spatial autocorrelation. This statistical approach helps to facilitate informed decision-making and resource allocation.
Hotspot analysis enables the identification of high or low values of data on a map, going beyond visual representation. For instance, it can pinpoint frequent violent incident locations in a city, identify regions with exceptionally high endemic species, determine popular destinations and attractions within a region or predict potential disease outbreak areas based on historical data patterns.
In the Insurance context, hotspot analysis can be used to assess and manage risks more effectively by identifying geographical areas prone to certain types of claims or losses. For other industries like Telecommunications, Transportation, or Retail, hotspot analysis can be applied to optimize network deployment, identify areas of high demand, or detect potential issues.
By analyzing the spatial autocorrelation within a dataset, hotspot analysis helps understand underlying patterns and target actions in areas like insurance, public health, and various fields requiring spatial insights.
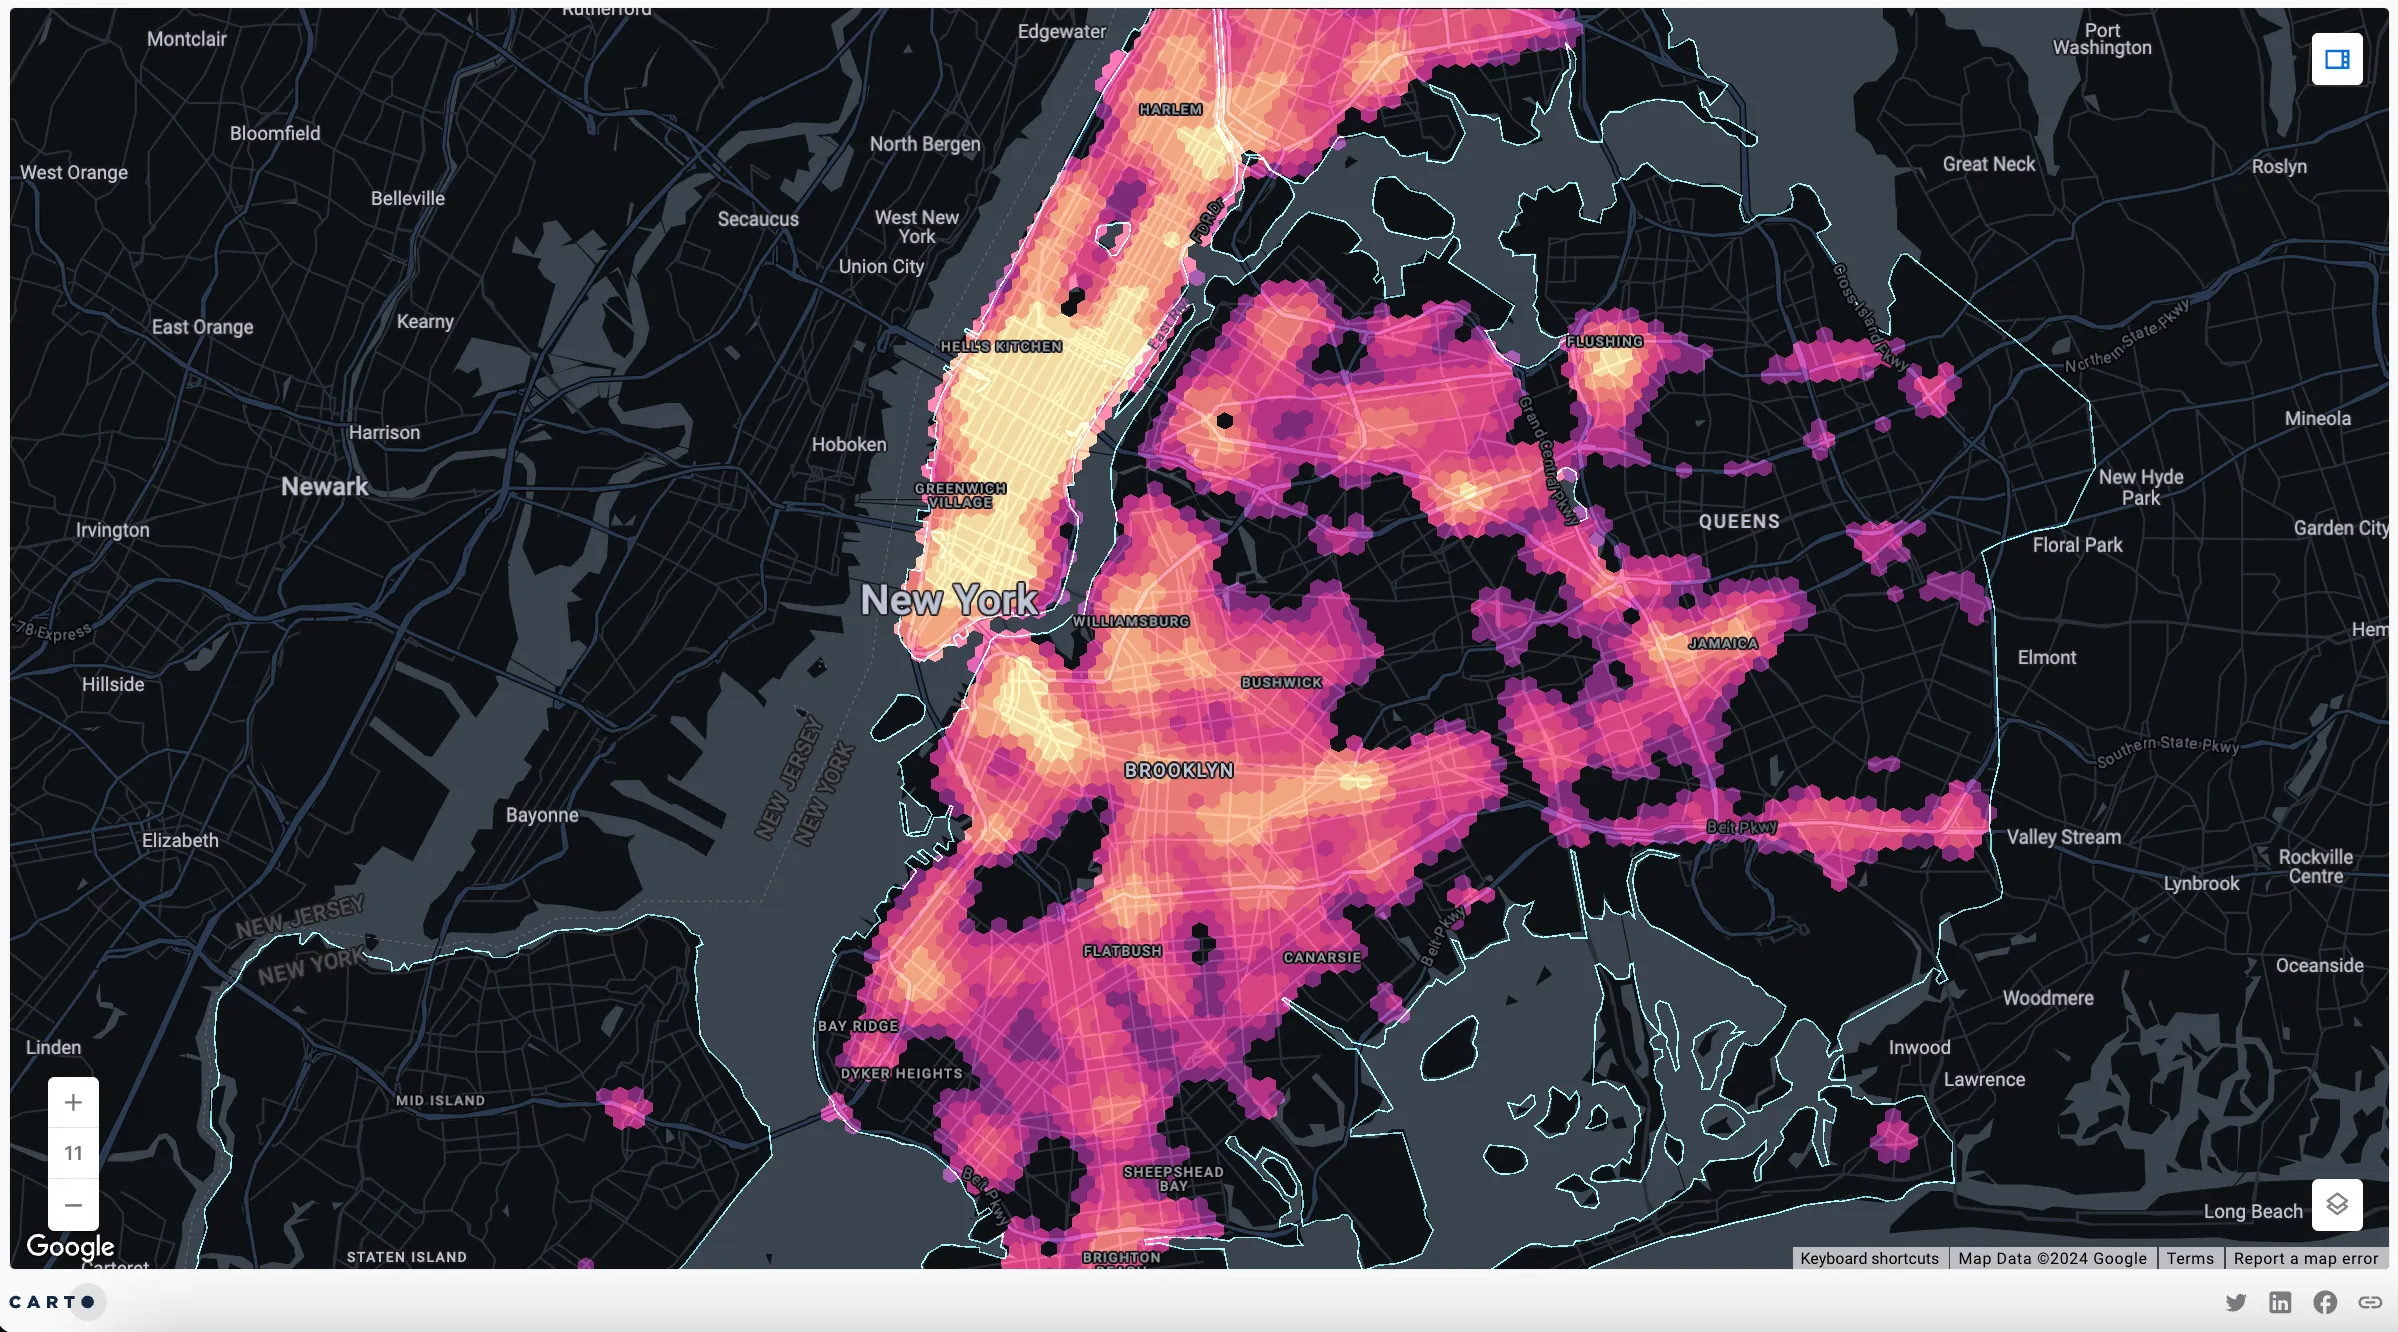
Hotspot Analysis using CARTO. Click the image to see the interactive map.
Technical Aspects of Hotspot Analysis
Spatial Autocorrelation Measures
Spatial autocorrelation measures, such as Moran’s I and Getis-Ord Gi*, are fundamental statistical tools employed in hotspot analysis. Getis-Ord*assesses the spatial clustering of similar values among neighboring locations, while Local Moran’s I can be used to determine spatial outliers within clusters. Understanding these measures helps in quantifying the degree and significance of spatial patterns in the data.
Spatial Weights and Neighborhood Definitions
Spatial weight matrices and neighborhood definitions play a crucial role in hotspot analysis. These determine the relationships between spatial units based on proximity or contiguity. Selecting appropriate neighborhood definitions impacts the identification of clusters and the accuracy of hotspot detection within the data.
Hotspot Analysis Algorithms and Implementations
Various algorithms, including Local Indicators of Spatial Association (LISA) and other emerging spatial statistical techniques, contribute to refined hotspot identification. Understanding these algorithms and their implementations aids in selecting the most suitable method for specific spatial analysis use cases.
For instance, Hotspot Analysis Algorithms and Implementations could play a crucial role in the Insurance industry for risk assessment and fraud detection. With Local Indicators of Spatial Association (LISA) and other advanced spatial statistical techniques, insurers can identify geographical areas with a higher concentration of claims, enabling them to adjust premiums accordingly. For instance, if a specific region consistently shows a clustering of auto accidents, insurance companies can use hotspot analysis to refine their pricing models and offer more accurate coverage in that area. Discover here how to predict traffic accident hotspots with Spatial Data Science.
In contrast, by employing LISA in the Telco sector, companies can pinpoint locations experiencing network congestion or areas with a surge in data usage. This information helps them strategically deploy resources such as additional cell towers or network capacity upgrades. For example, if hotspot analysis reveals a concentration of users in a specific neighborhood, a telecom company can enhance its infrastructure in that area to ensure a seamless and reliable network experience for customers.
Time Series and Temporal Aspects
Incorporating time series data into hotspot analysis provides insights into temporal trends and changes in spatial patterns over time. Analyzing temporal aspects aids in identifying evolving hotspots and understanding the dynamic nature of spatial phenomena. Imagine you need to optimize food deliveries; you could use space-time clustering to go beyond identifying spatial hotspots and consider when these hotspots occur.
This simultaneous analysis of space and time helps, for example, in dispatching delivery drivers efficiently to areas with varying demand levels at different times of the day. Read this blog post to learn how to employ algorithms like the Getis-Ord Gi* (GI*) statistic, and see how it helped reveal statistically significant clusters over both space and time. This space-time clustering approach proves value for businesses driving growth and informed decision-making.
How is Hotspot Analysis Different from Heatmaps
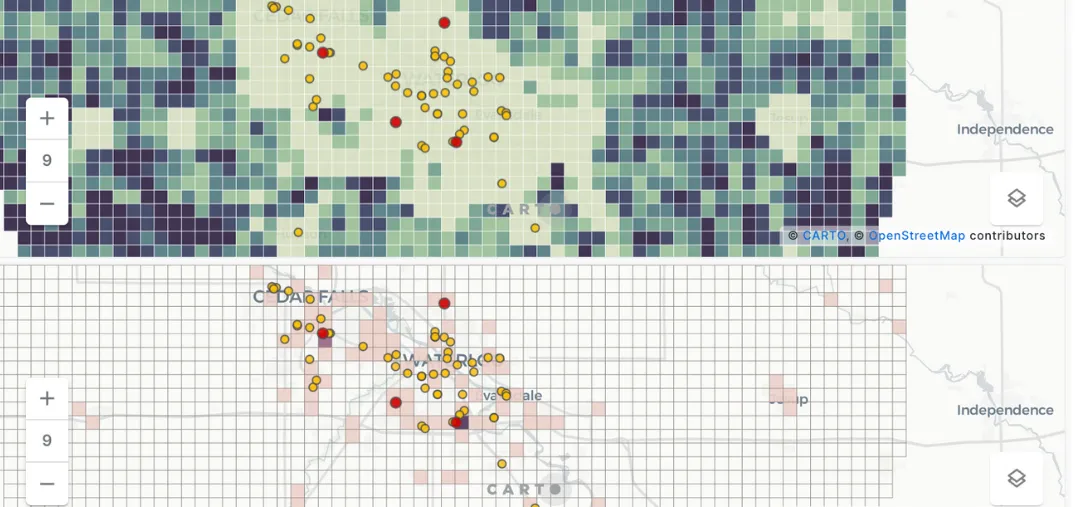
Hotspot analysis and heatmaps are distinct spatial analysis techniques serving different purposes. Hotspot analysis, employing statistical algorithms, aims to identify statistically significant clusters or concentrations of events, providing measures of significance and strength. In contrast, heatmaps visually represent the intensity or density of values across a spatial surface, using color gradients to show variations. Hotspot analysis pinpoints significant spatial event clusters, whereas heatmaps visualize data density without emphasizing statistical significance.
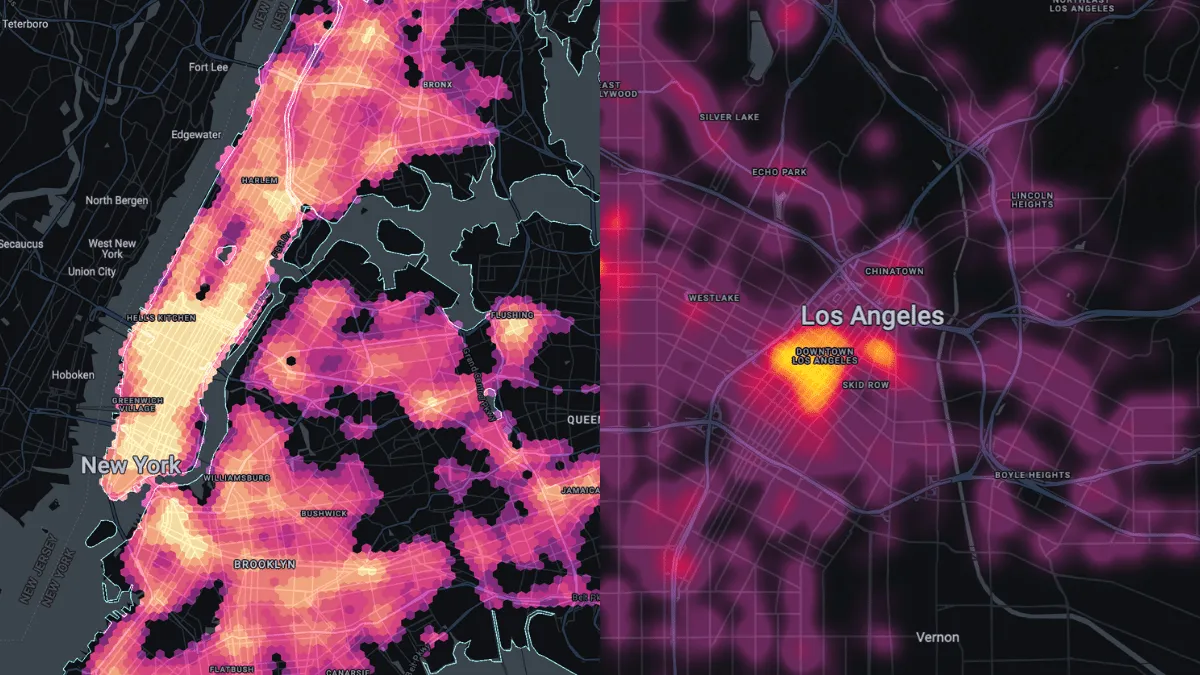
Comparison of a Hotspot Analysis (left) vs a Heatmap (right)
Hotspot Analysis Applications
As we mentioned before, Hotspot Analysis finds applications across various industries such as Telco, Insurance, and Transport. But we can further explore hotspot analysis examples with crime analysis, public health, retail and marketing, and environmental studies.
Crime Analysis
Hotspot Analysis helps to pinpoint areas with a higher concentration of criminal activities. By analyzing crime incident data, police can efficiently allocate resources, deploy patrols, and focus crime prevention strategies in these high-crime hotspots. It assists in understanding crime patterns, aiding in proactive measures to enhance public safety.
Additionally, by identifying and analyzing historical crime hotspots, law enforcement agencies can forecast future crime locations. Predictive policing utilizes Hotspot Analysis to anticipate areas susceptible to criminal activities, allowing law enforcement to take preventive actions.
Public Health
Hotspot Analysis is pivotal in identifying clusters of disease occurrences. By analyzing health-related data, such as reported cases of infections or illnesses, health authorities can swiftly detect disease outbreaks. This information helps deploy healthcare resources, implement targeted interventions, and control disease spread within affected regions.
Hospitals and healthcare facilities can prepare and allocate medical staff, equipment, vaccines, and other resources to areas with higher disease prevalence, ensuring timely and adequate medical assistance.
Retail and Marketing
Businesses utilize Hotspot Analysis to identify regions with high customer density or preferences. Analyzing consumer behavior and purchasing patterns helps in targeting marketing campaigns effectively. Retailers can tailor advertising strategies, promotions, and product placements to cater to specific demographics or areas with higher consumer demand.
For expanding businesses or new store locations, Hotspot Analysis aids in identifying prime locations with high foot traffic or consumer activity. It helps retailers decide where to establish new outlets to maximize sales and customer reach. Watch this Spatial Spotlight with an example of a hotspot analysis in London’s coffee scene that could help Pret A Mangers understand where to open new coffee shops.
Environmental Studies
Hotspot Analysis assists in identifying areas prone to natural disasters such as earthquakes, floods, or wildfires. Understanding these hotspots helps in disaster preparedness, urban planning, and implementing mitigation strategies to reduce risks and protect vulnerable communities.
How to Do Hotspot Analysis with CARTO?
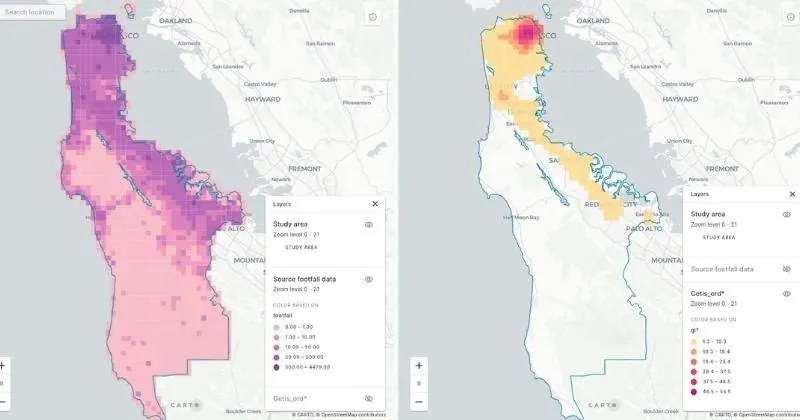
Delve deep into hotspot analysis methodologies, comparing tools like Getis-Ord* and Local Moran’s I with this step-by-step guide. It illustrates practical hotspot analysis using footfall data in San Francisco and San Mateo, showcasing the power of CARTO for impactful spatial analysis.
And if you are ready to take Hotpost Analysis to the next level, try out the Commercial Hotspots from our Analytics Toolbox to have access to a multivariate hotspot tool. In essence, you can find areas where the value of the input variables are considerably higher than the average.
Mastering hotspot analysis with tools like CARTO empowers decision-makers with actionable insights derived from spatial data, enhancing planning, resource allocation, and problem-solving across diverse sectors.