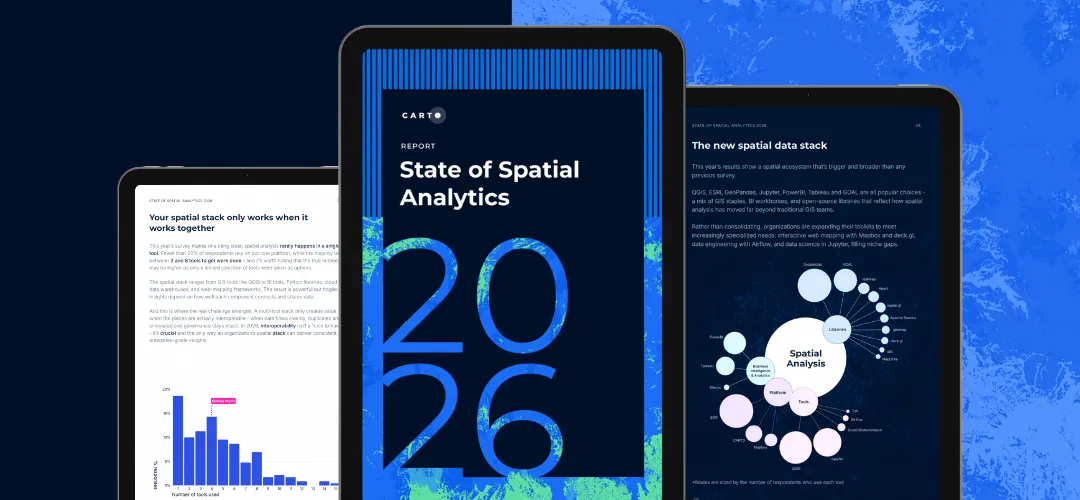
Spatial analysis & data visualization, without limits
Generate rich data insights natively in your lakehouse. Accelerate decision-making with our geospatial analytics platform.
Try for free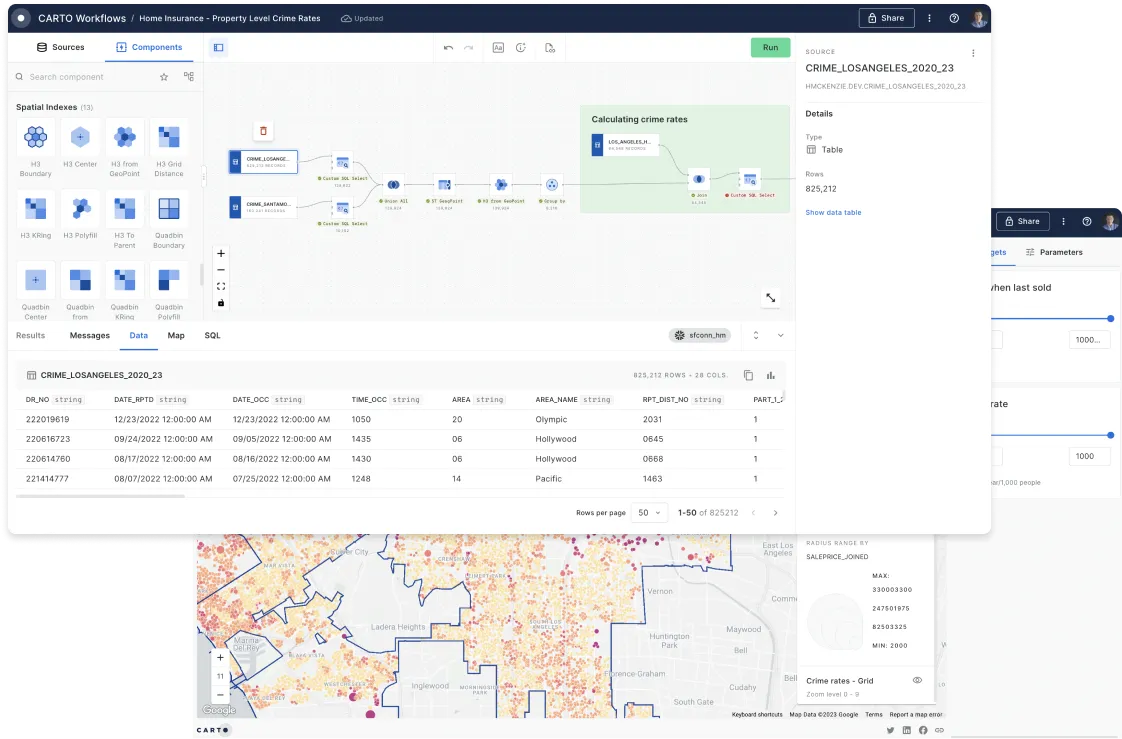

Cloud native
Data prep, analysis and visualization is done in your lakehouse. No duplication, or wasted time on complex data cleaning or ETL processing.

No-code tools for analysis
Design, run & share flexible analysis pipelines without the need for SQL coding knowledge, using a powerful drag-and-drop visual interface.

Interactive data viz tools
With Builder you can visualize, analyze & share geospatial insights securely. A fully cloud native point-and-click analysis & map making tool.
Streamline data prep and amplify insights with our no-code analysis & visualization tools
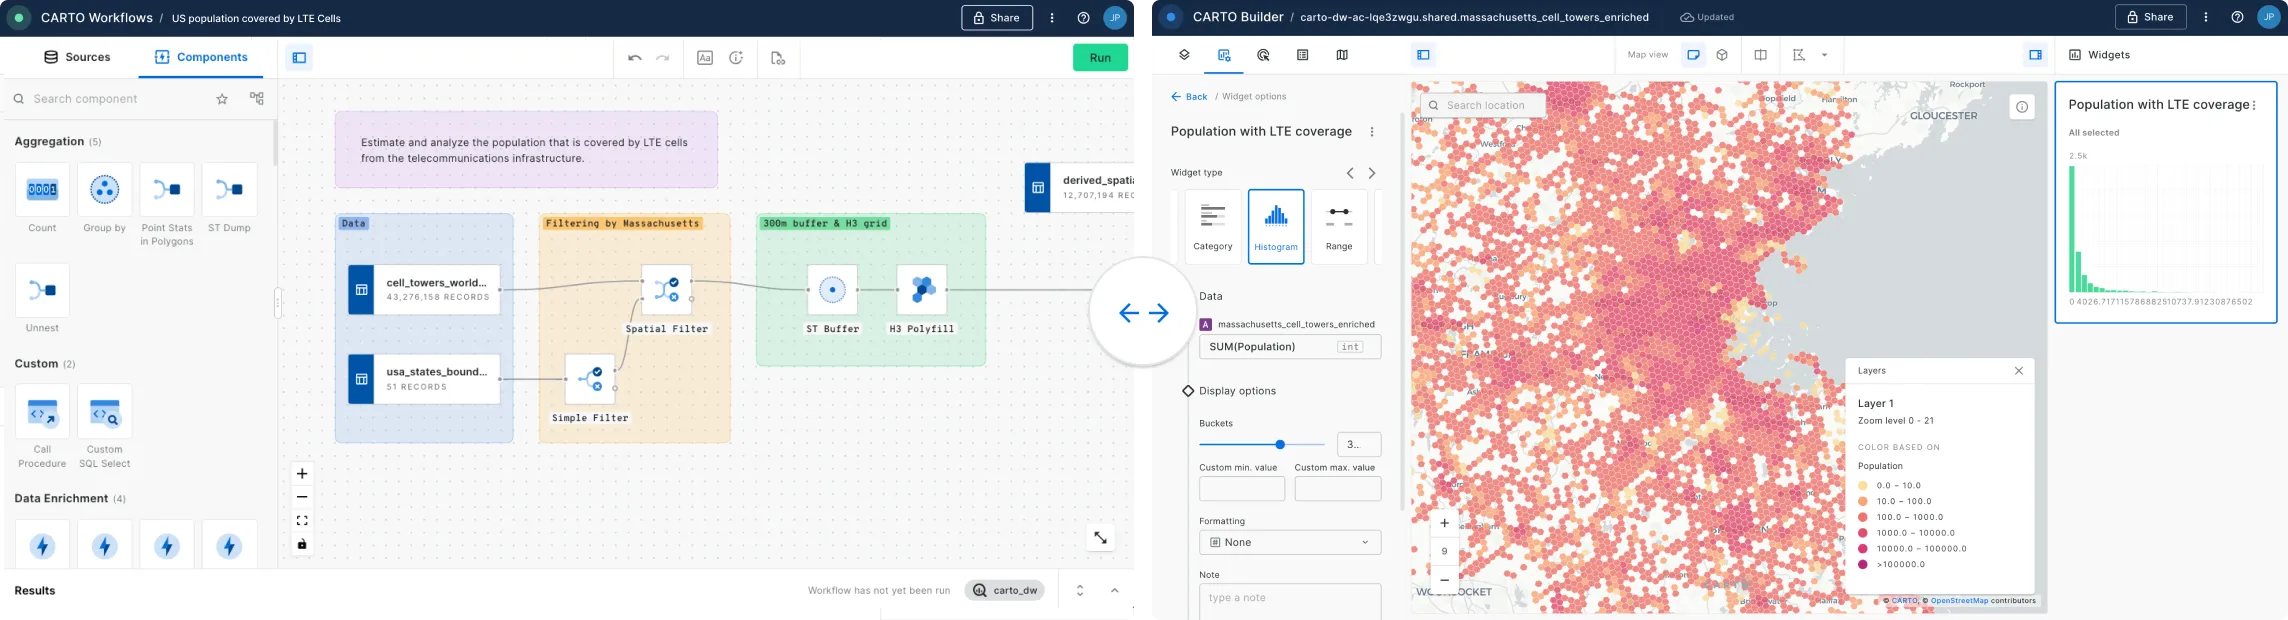
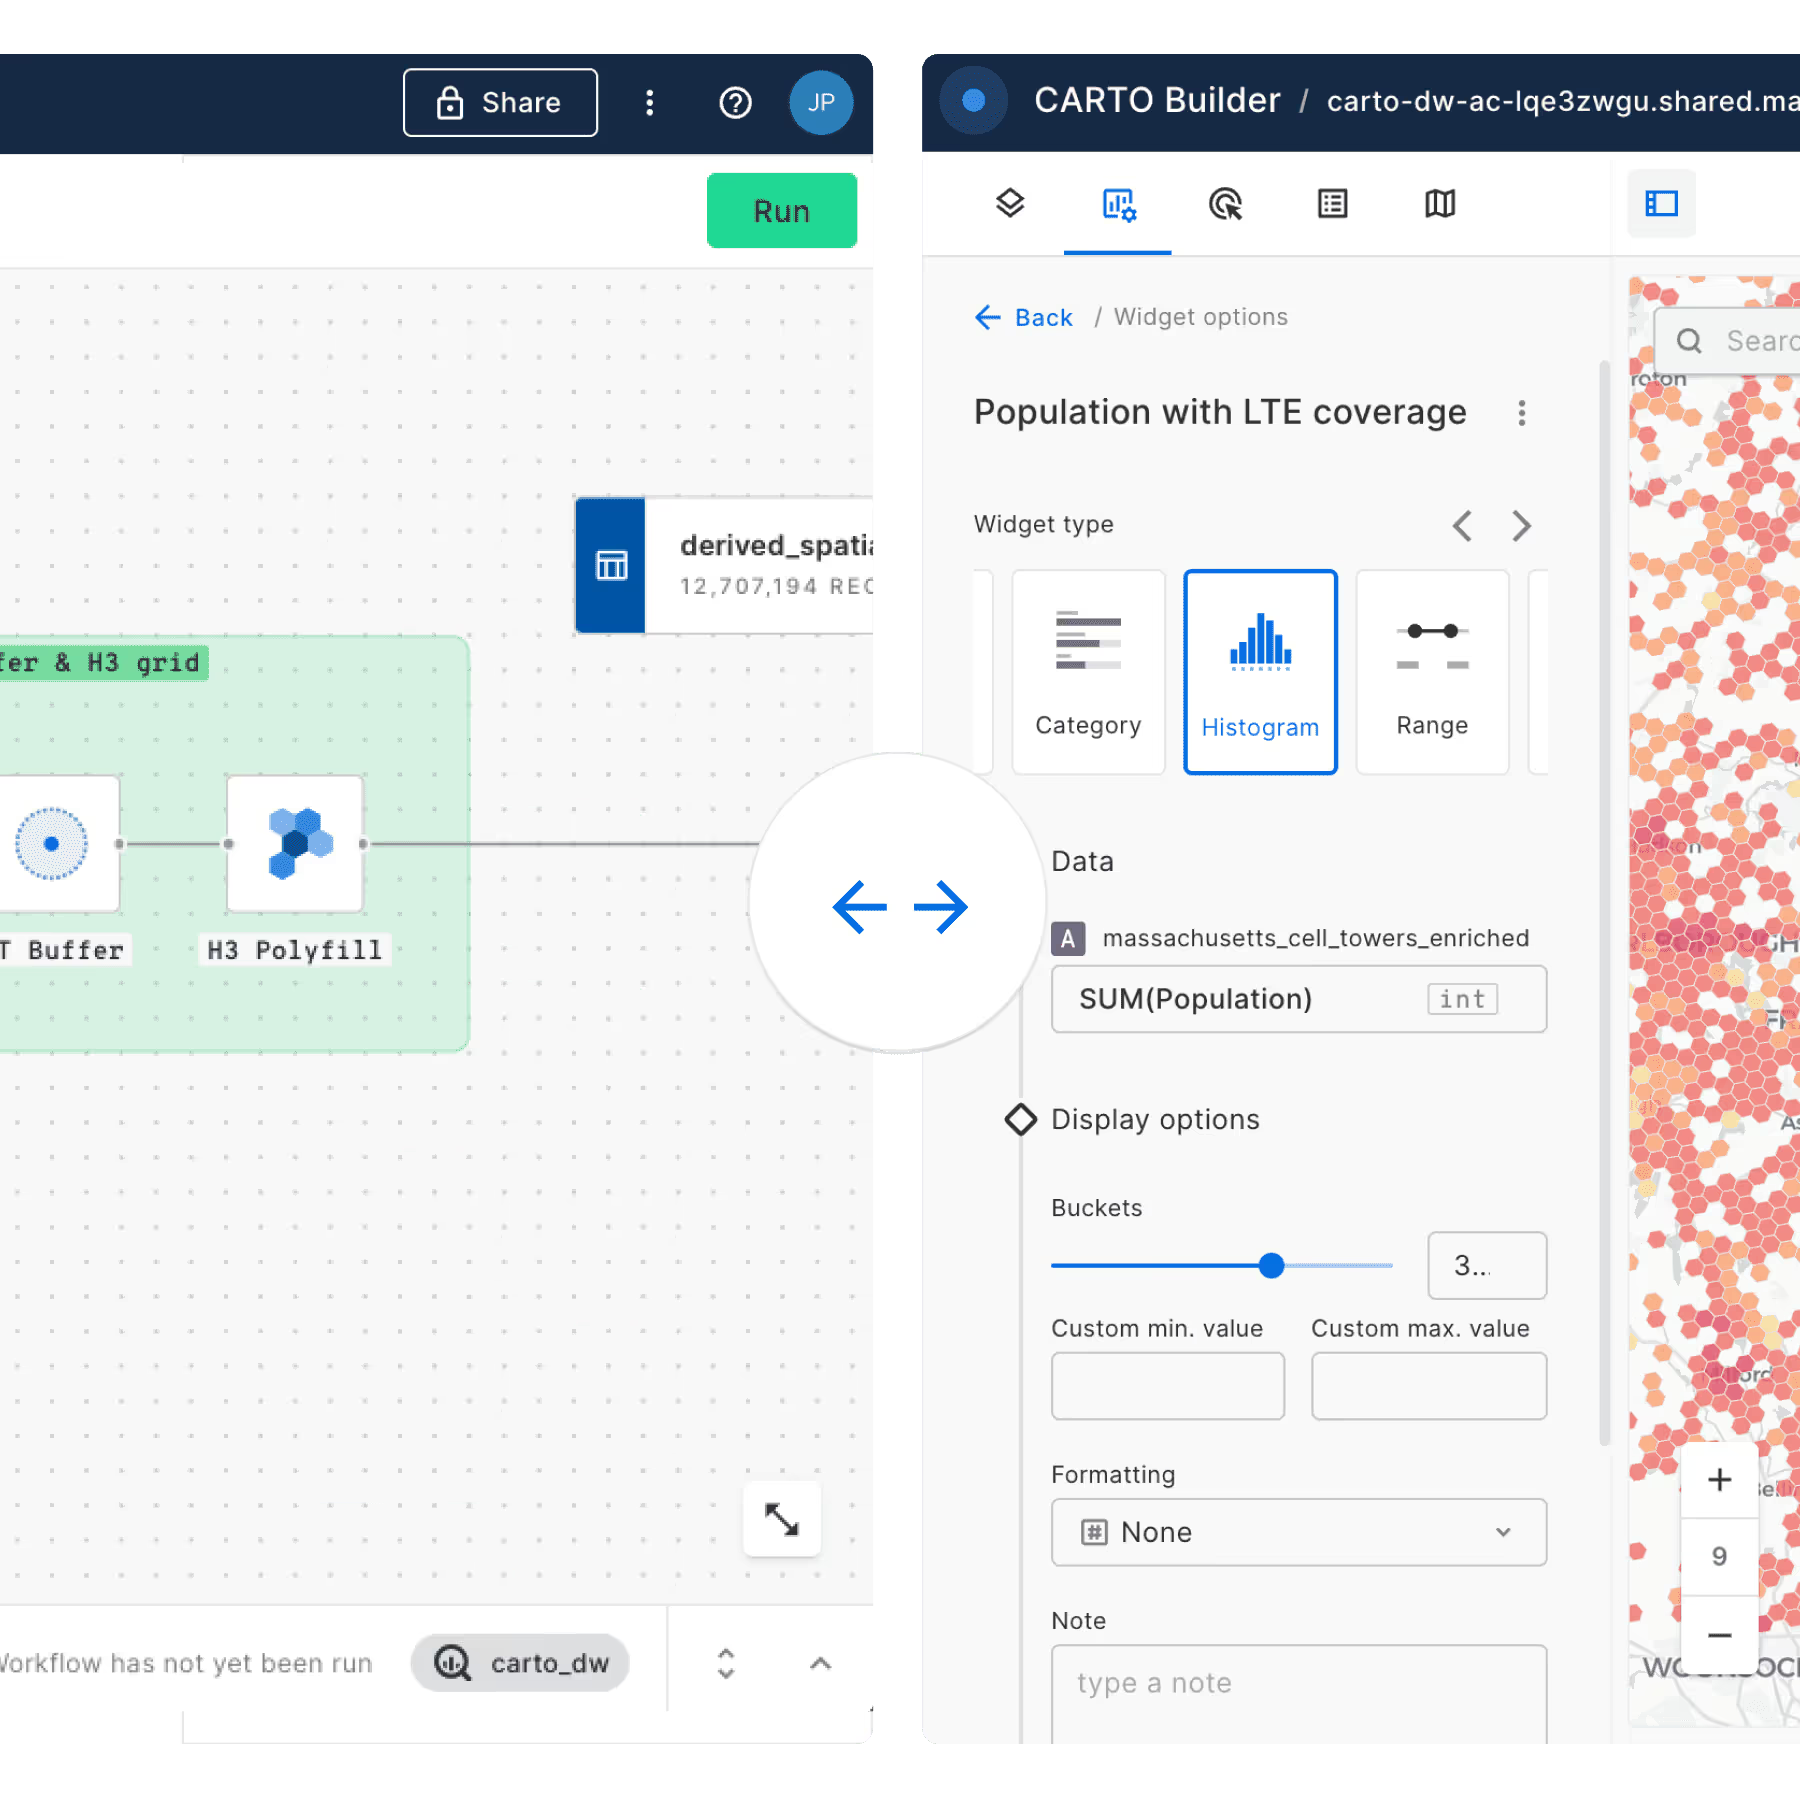
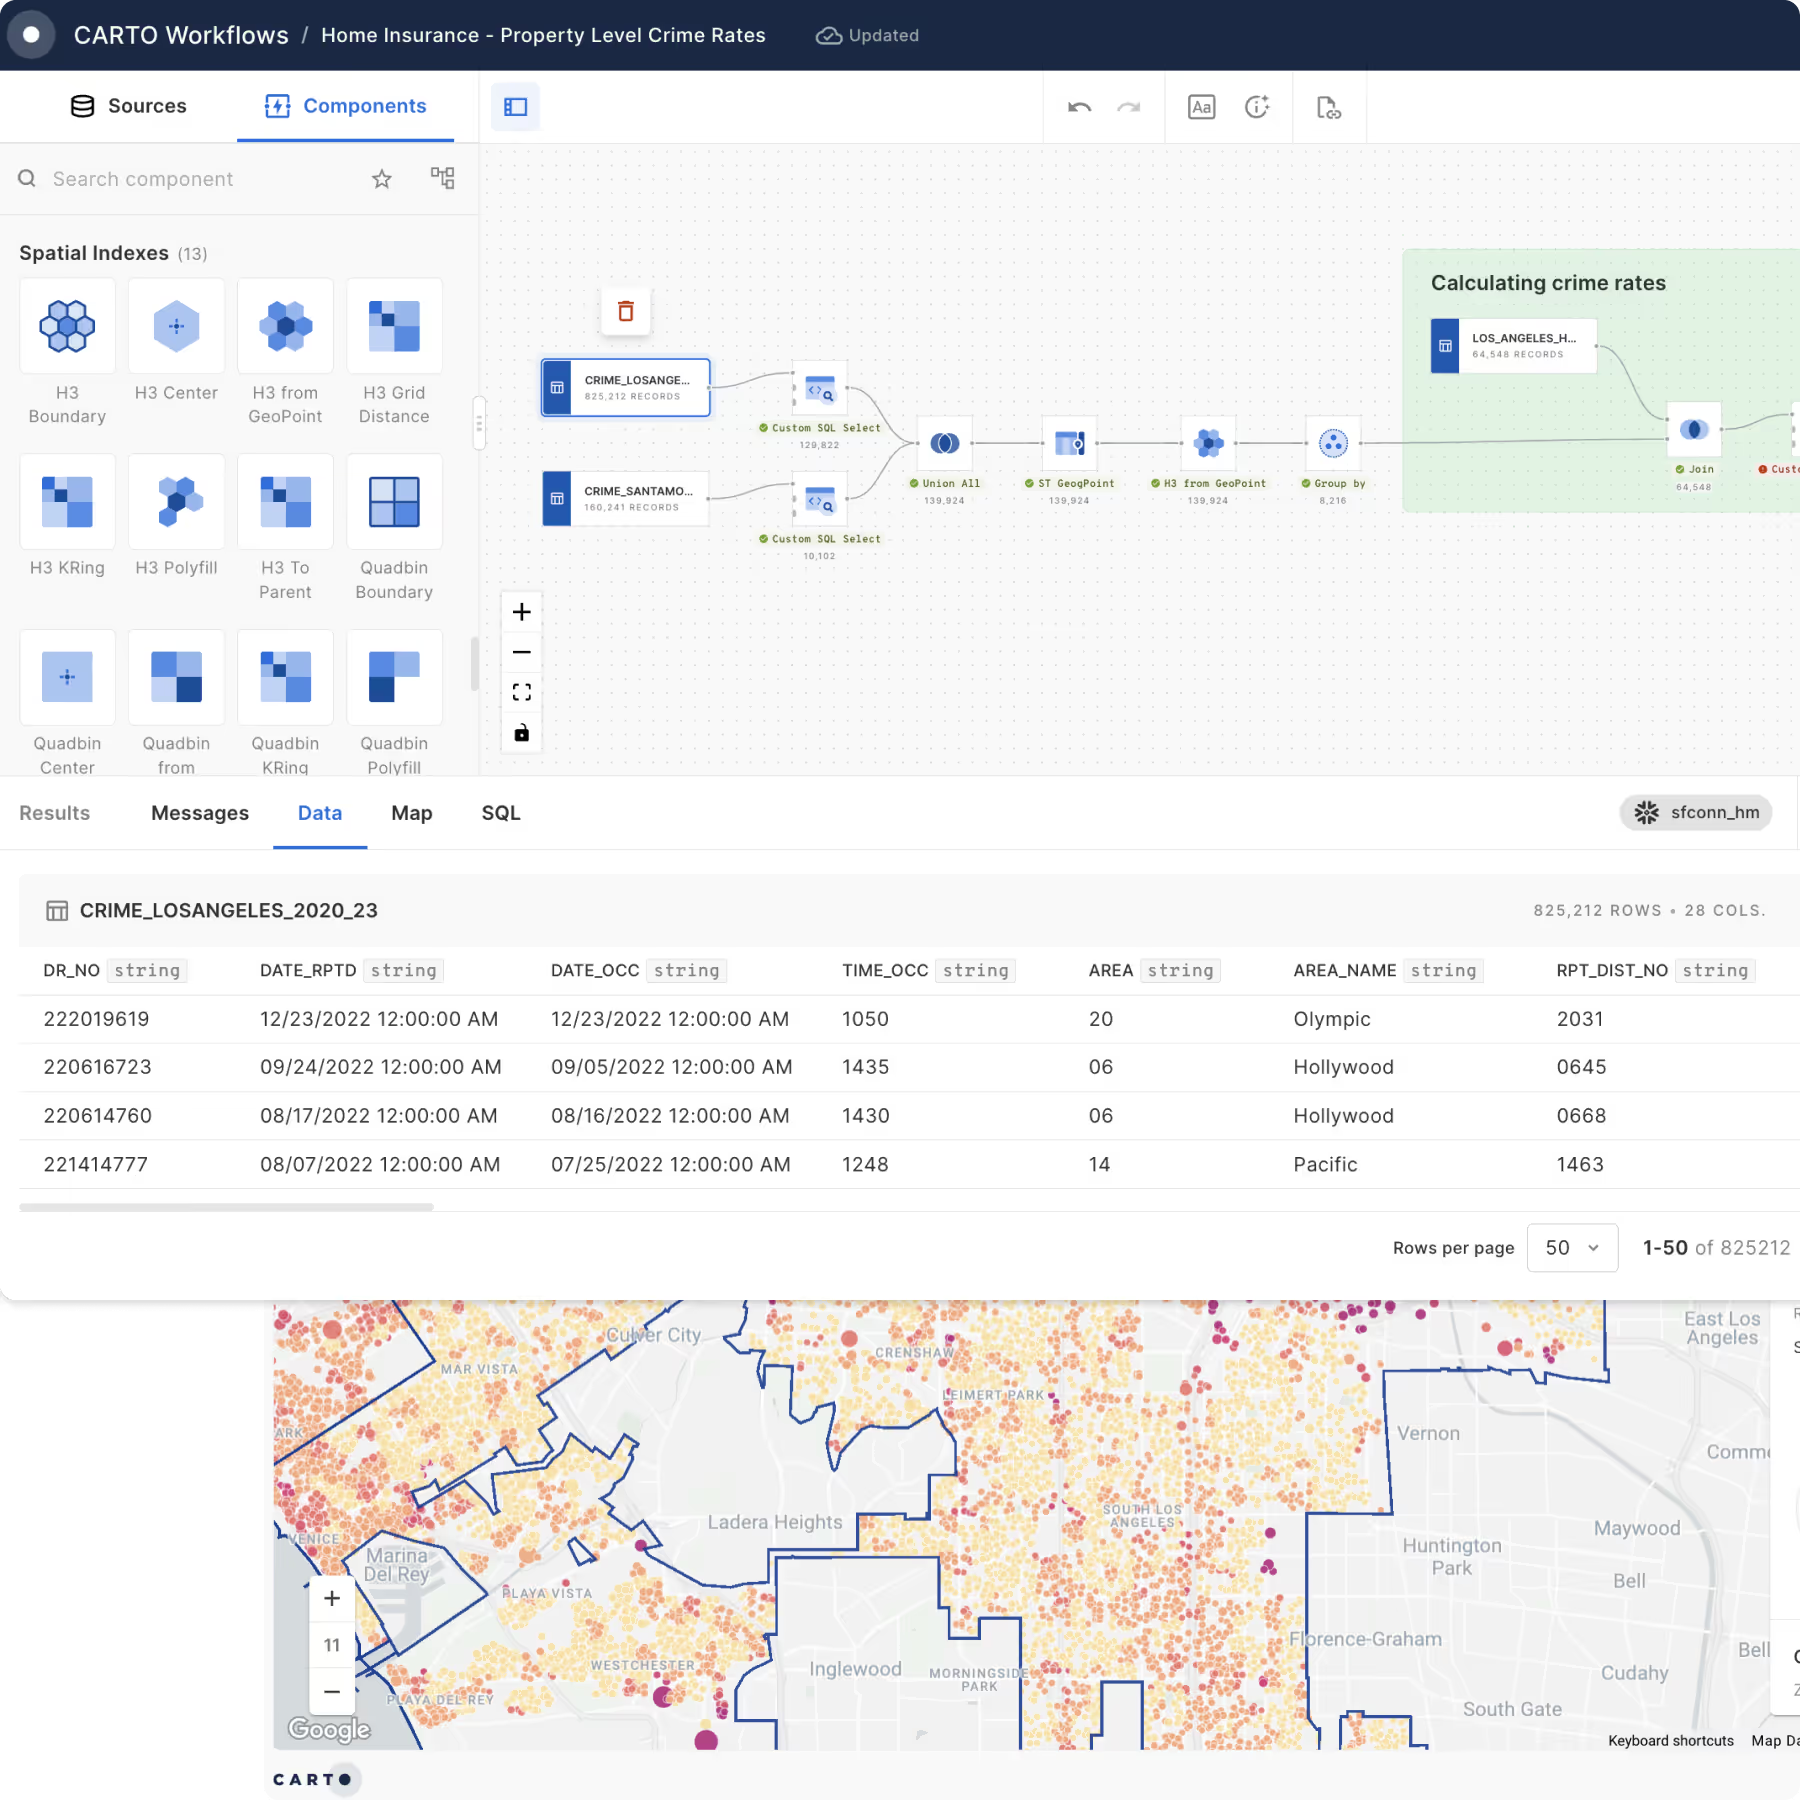
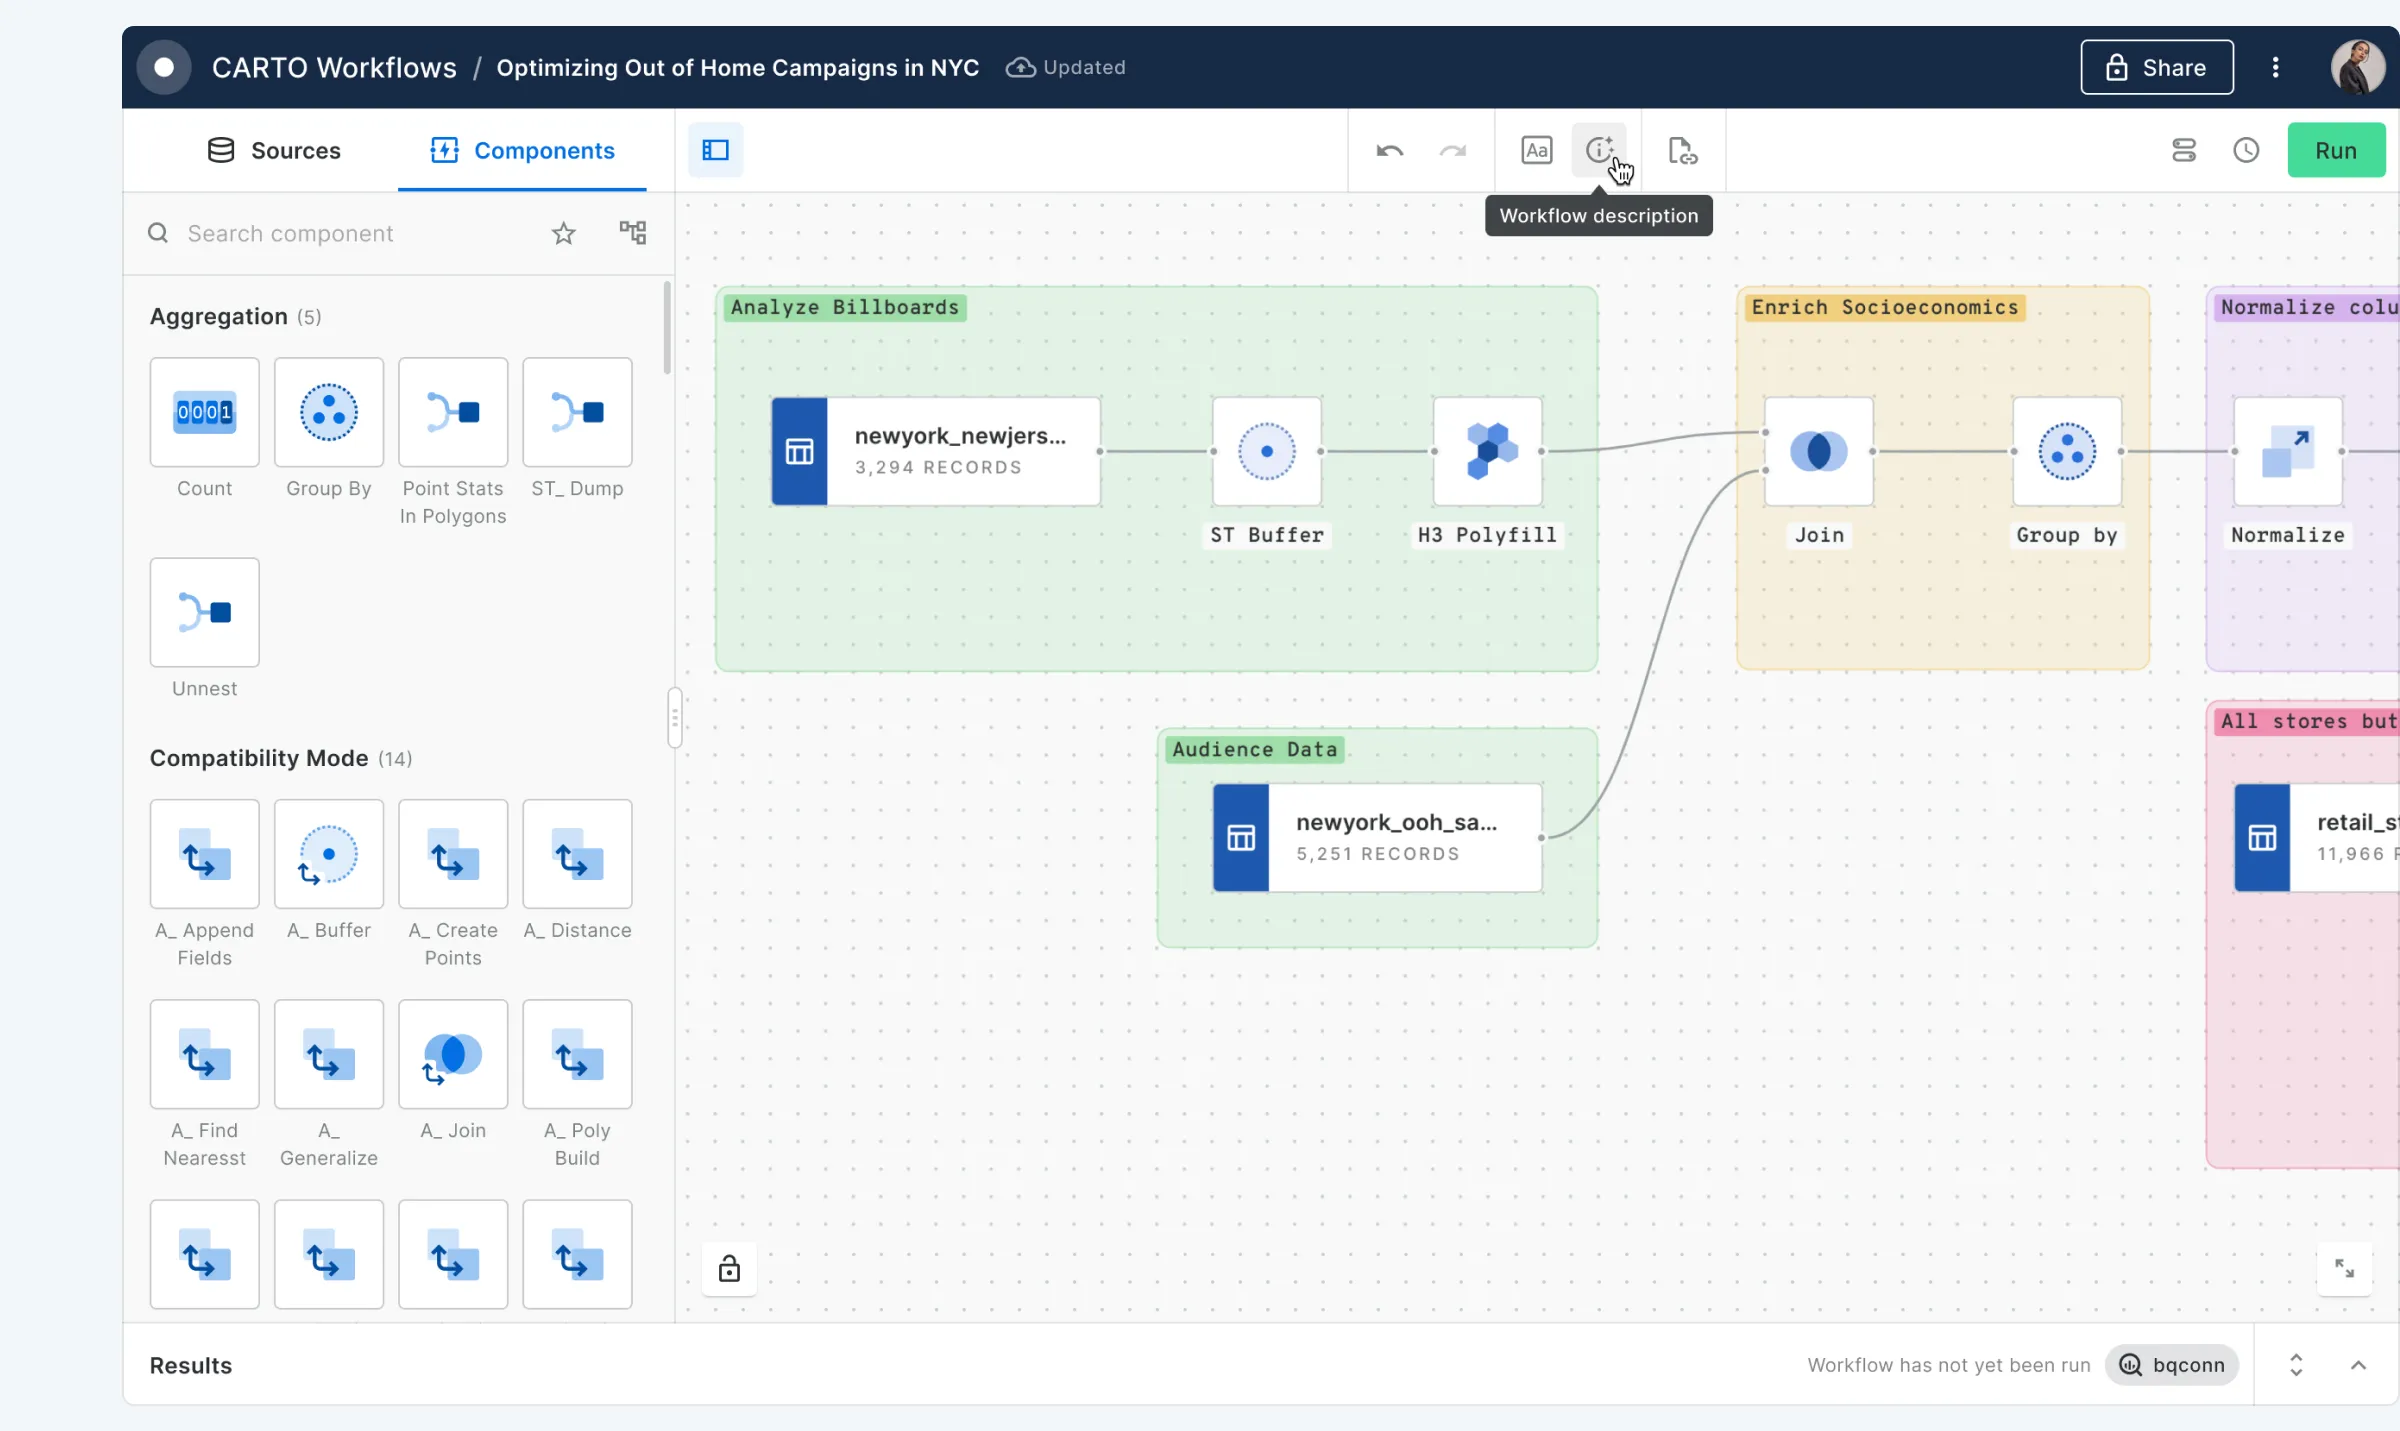
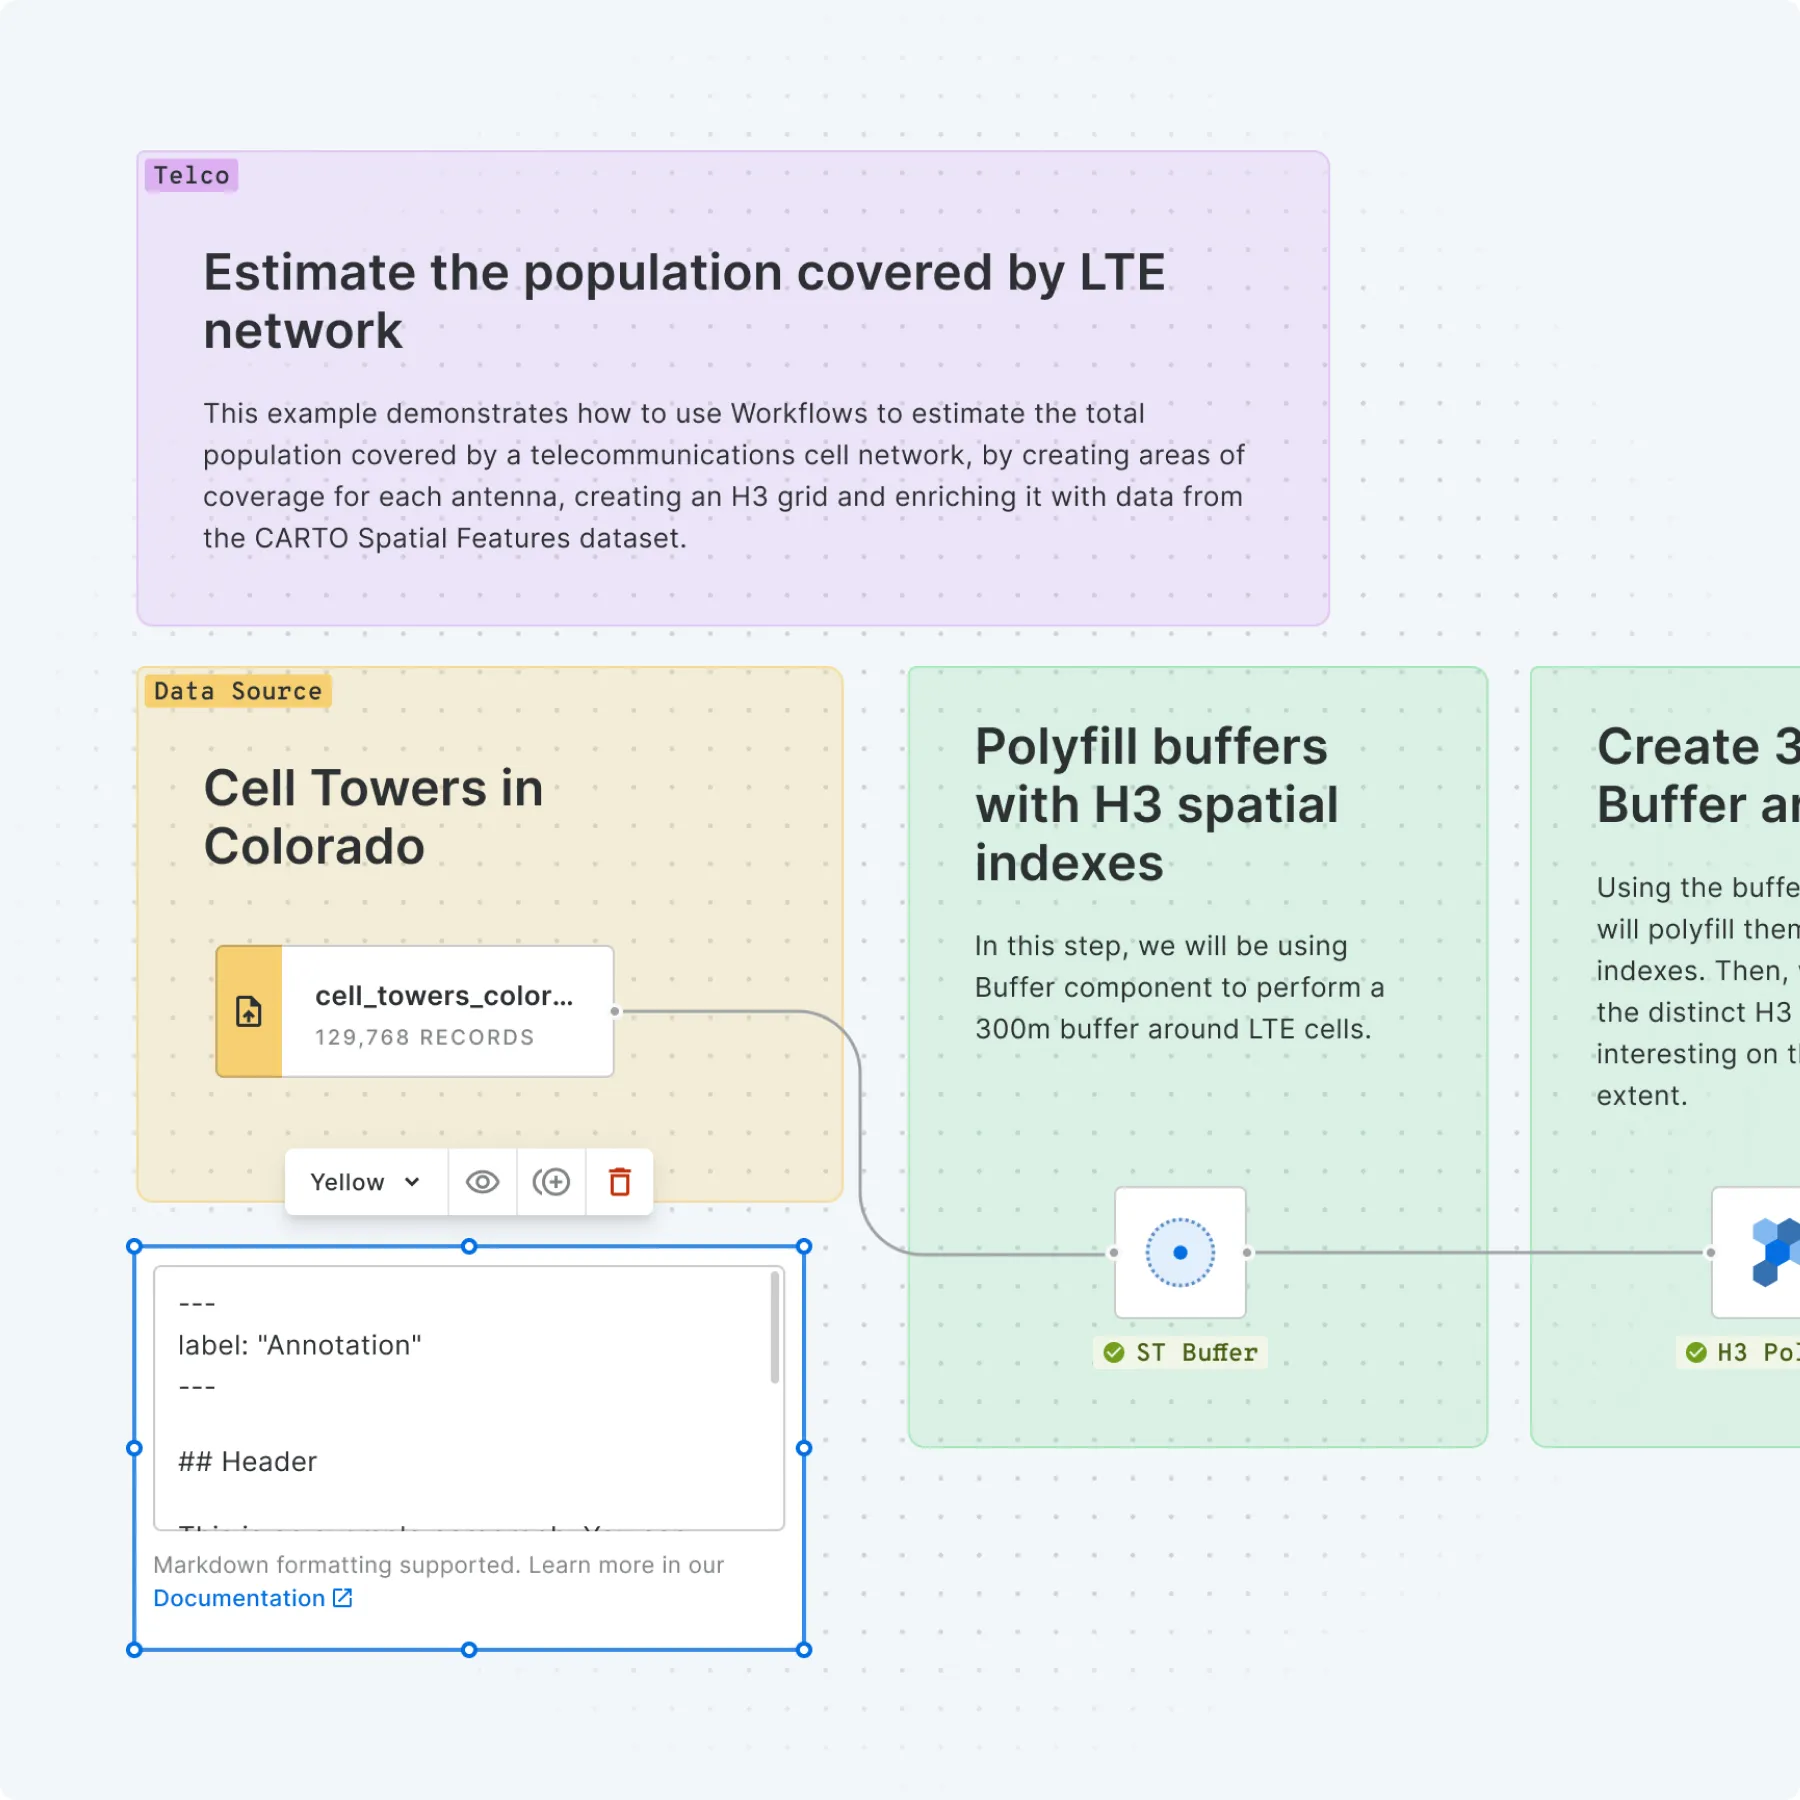
No-code data prep & analysis design tools
Simplify your analytics with Workflows, our drag-and-drop analysis design & automation tool. Configure, run & share analysis pipelines using a no-code visual interface. 100+ preconfigured components for any analytical use case, without the need for SQL knowledge.
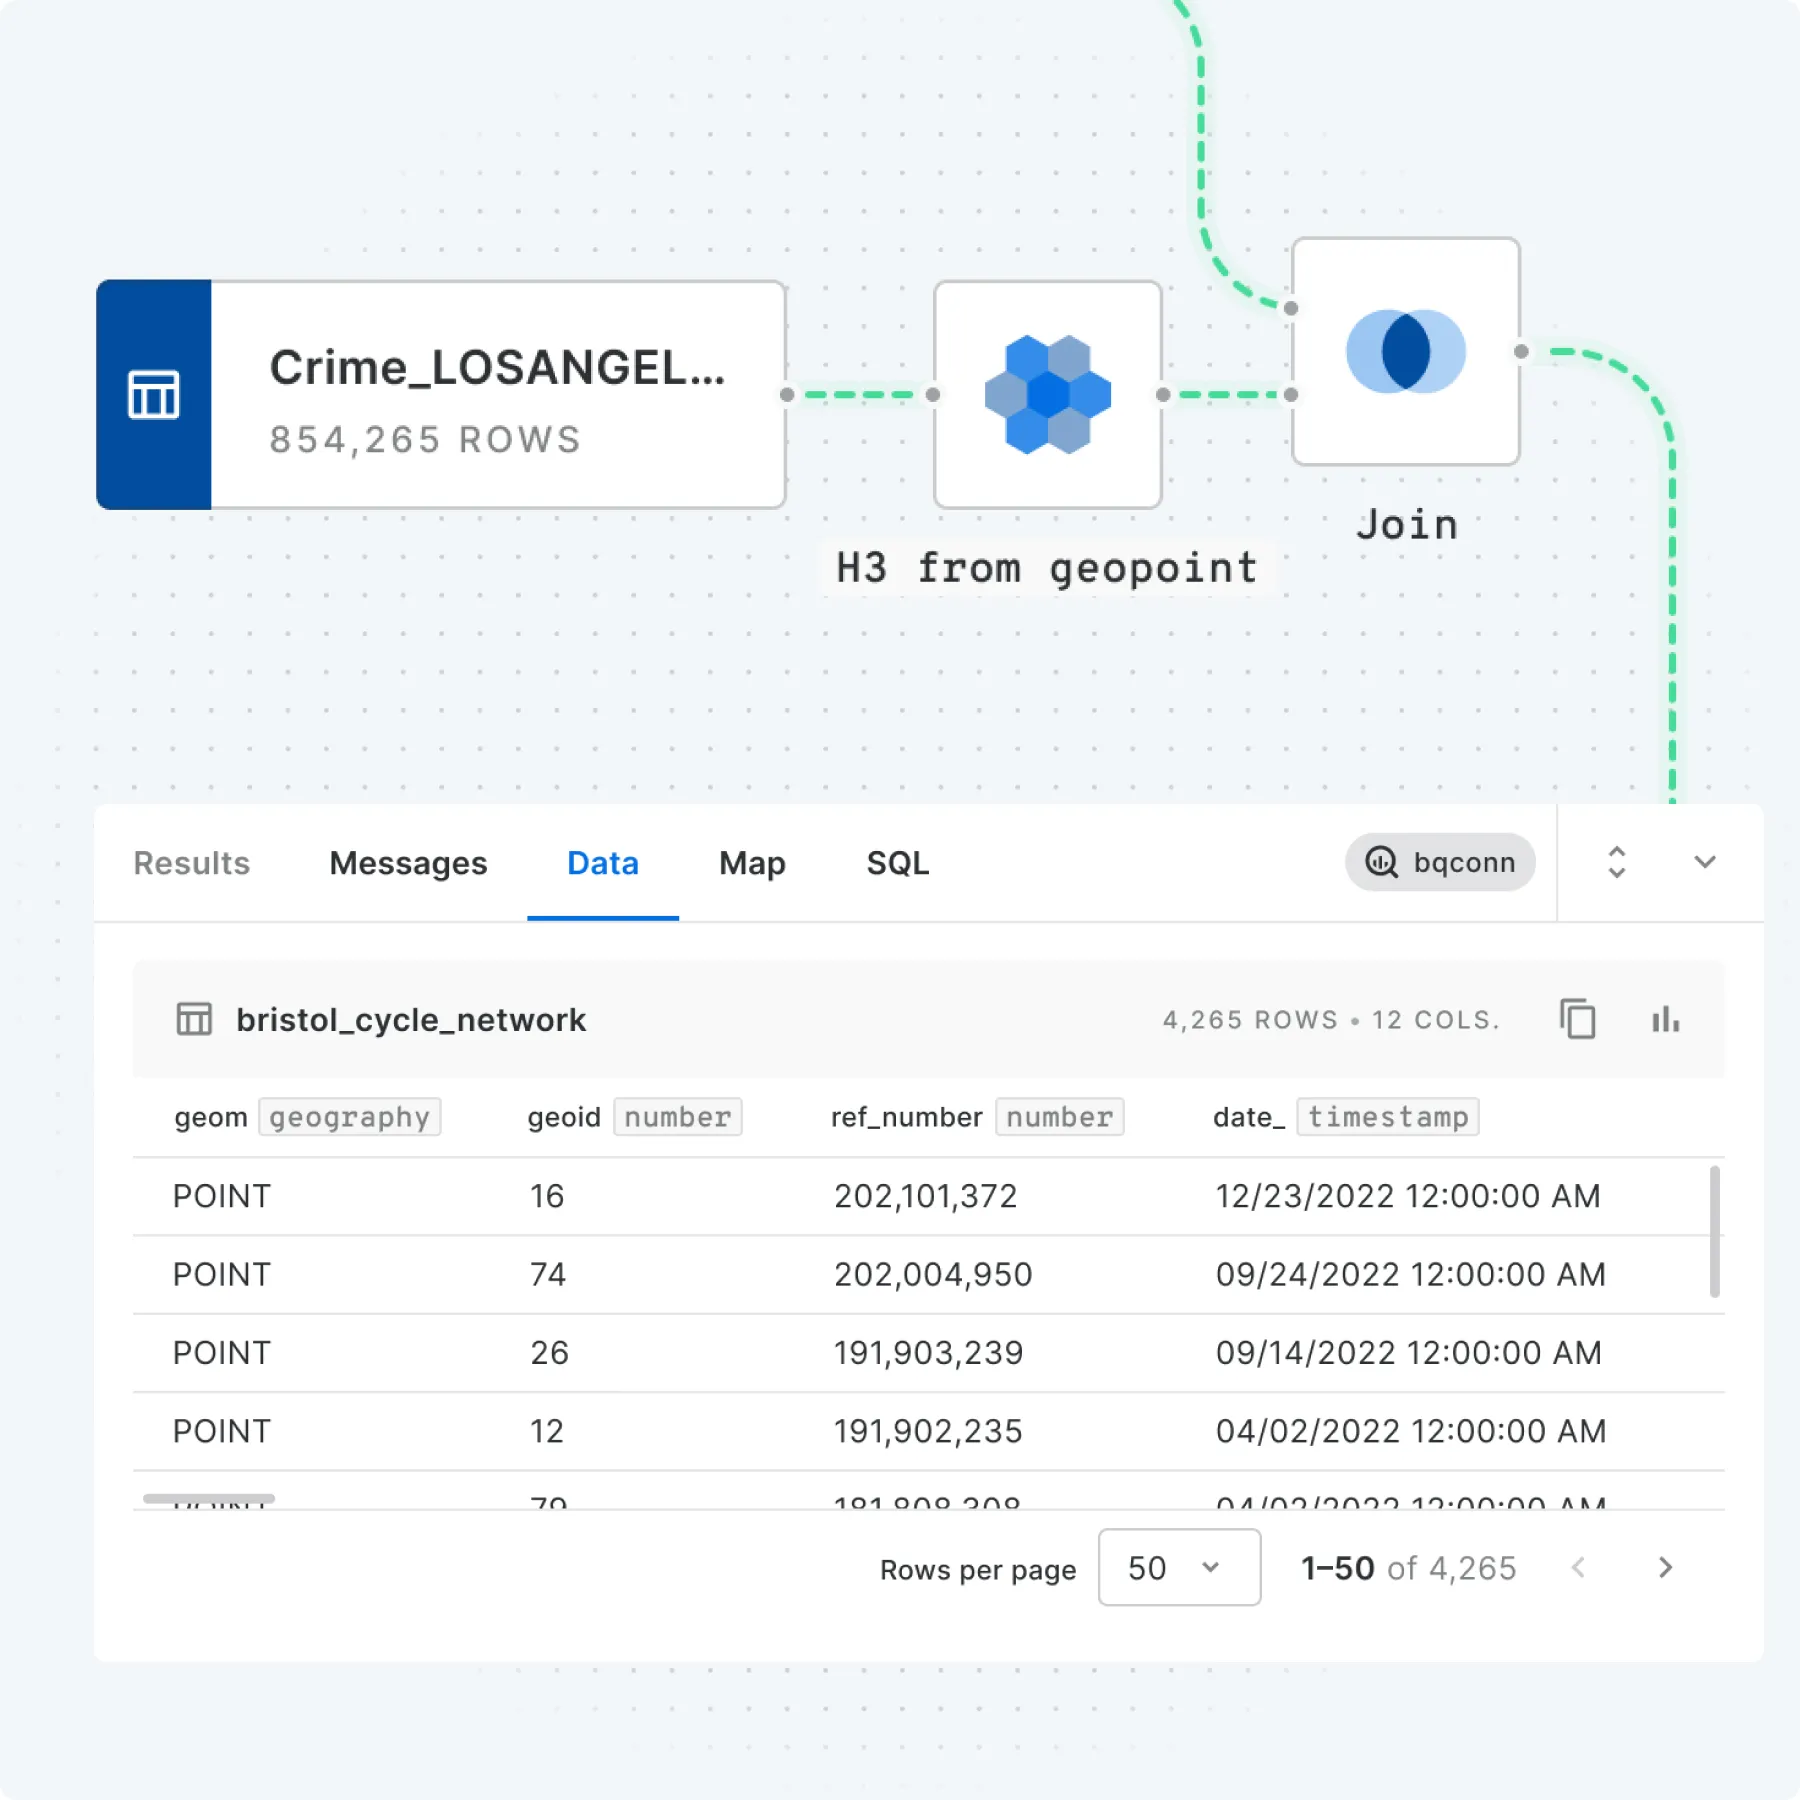
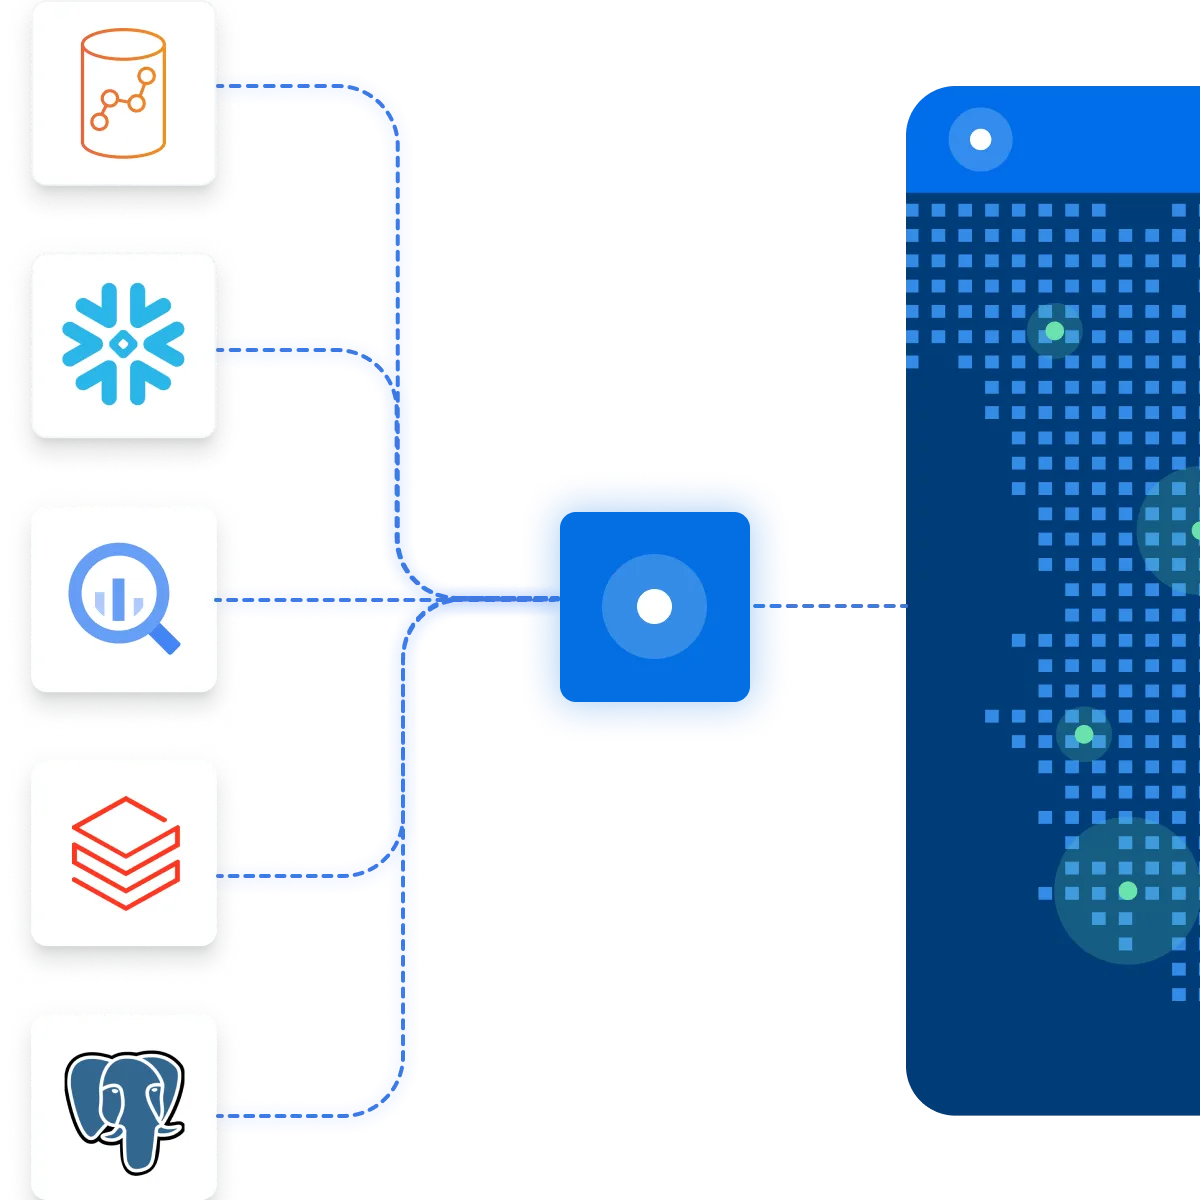
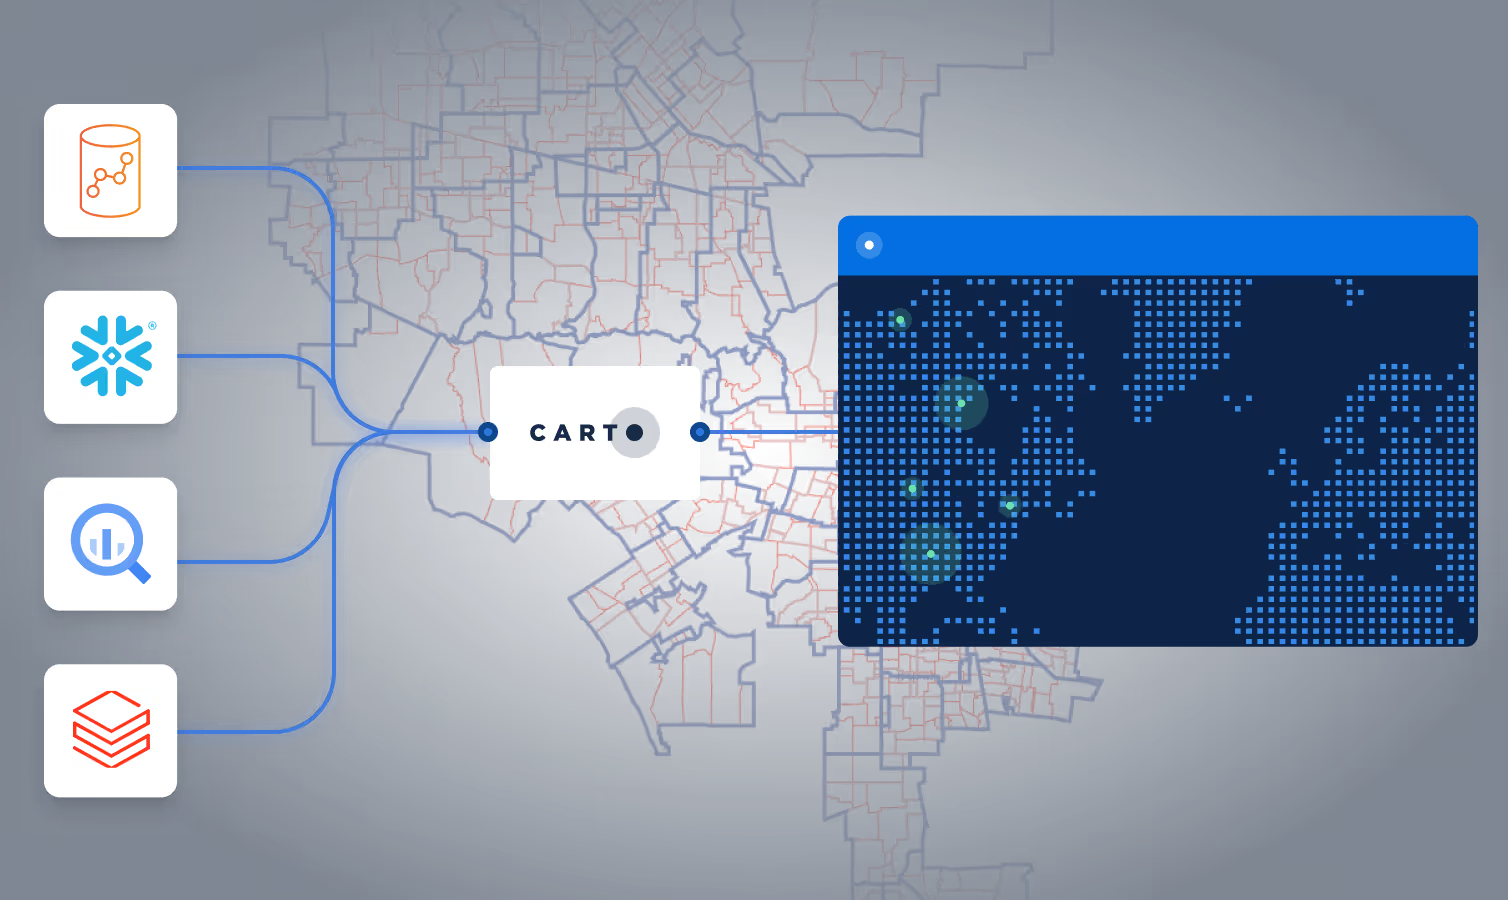
Cloud native geospatial analytics at scale
CARTO extends the analysis and visualization capabilities available in BigQuery, Snowflake, Redshift, Databricks, and more. No need to pull data into our platform, unlike other Business Intelligence or modeling tools. Access a single, secure source for all your data giving you speed and agility, with no limits on data scale.
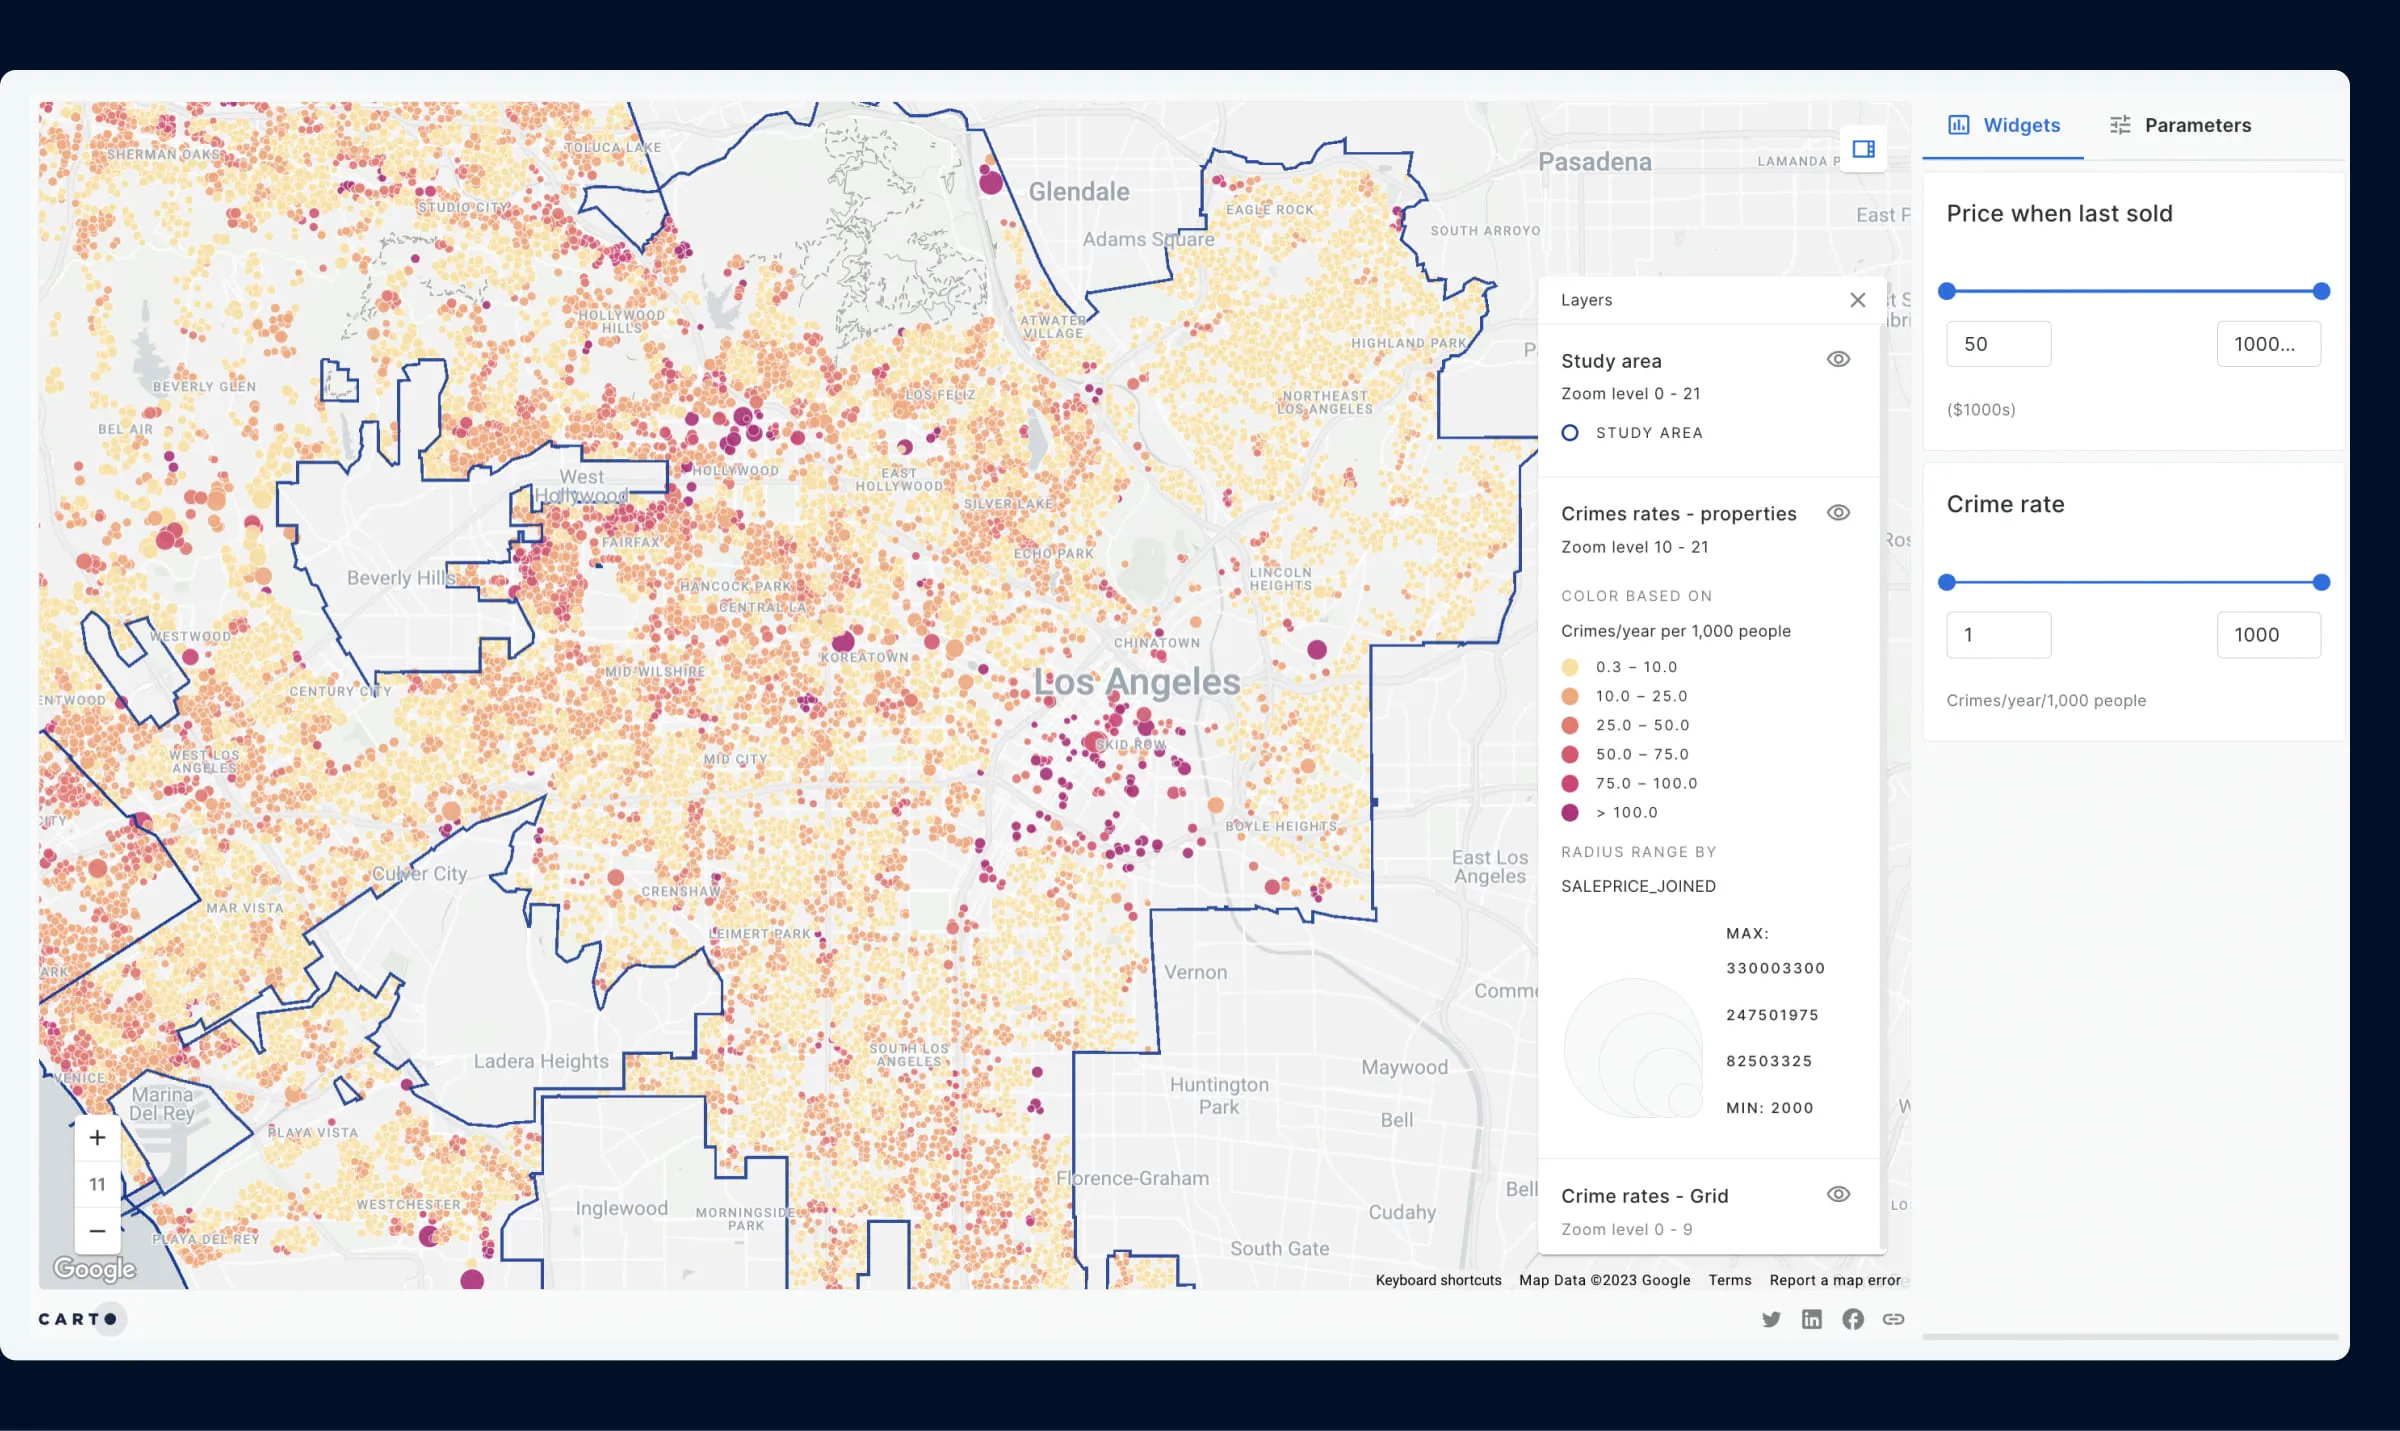
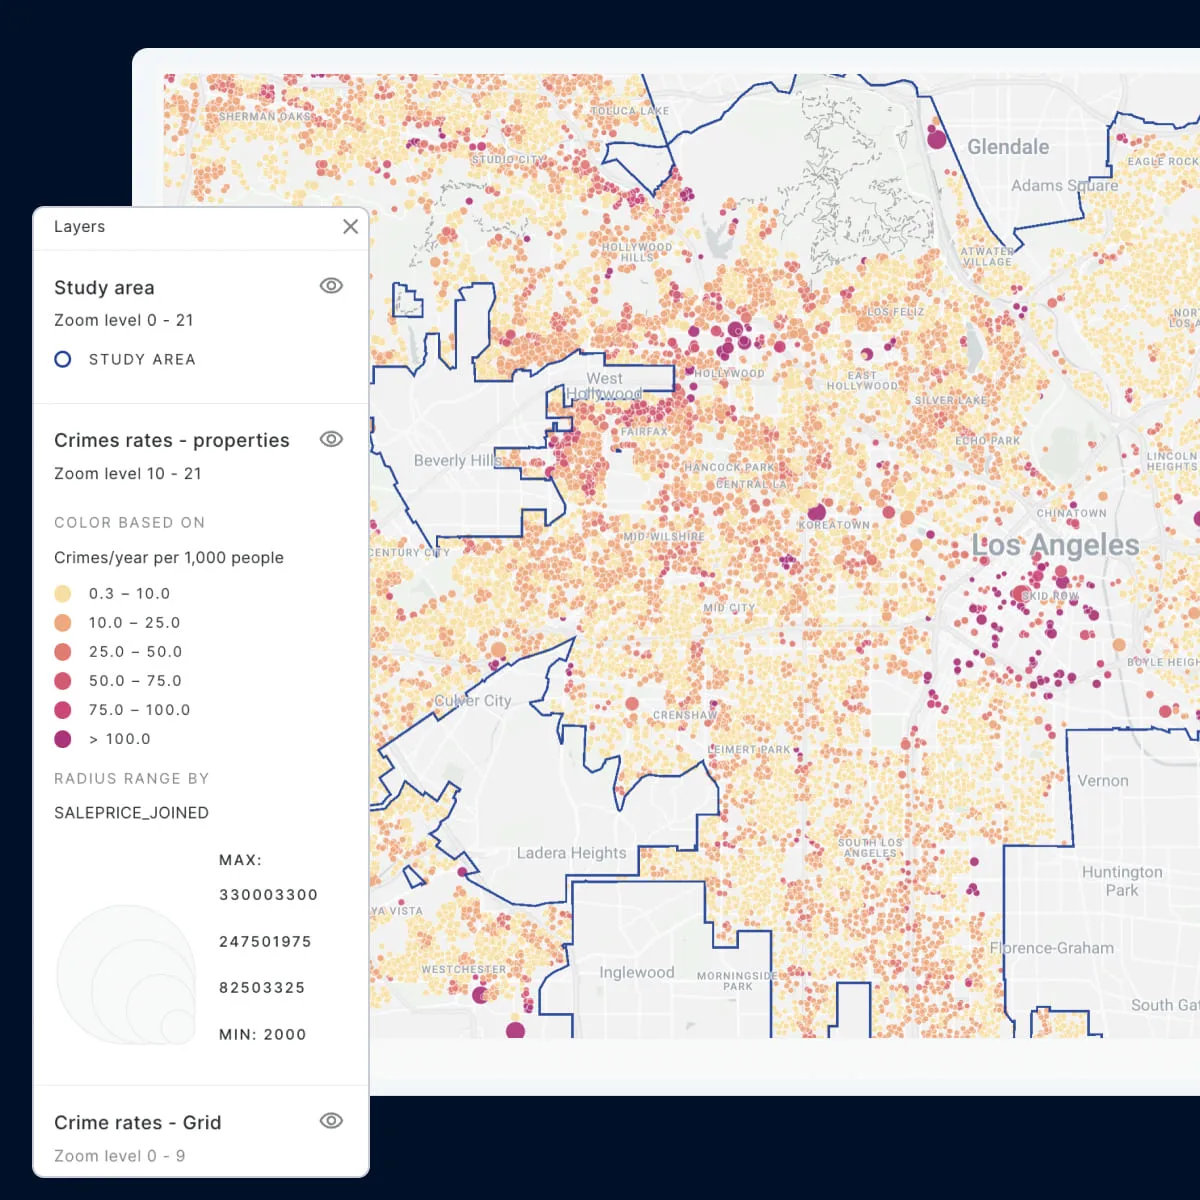
Unmatched data visualization capabilities
Build rich, dynamic data visualizations directly from your lakehouse with Builder. Visualize billions of data points with ease. Create and share interactive dashboards that take your data storytelling to the next level.
More than 12,000 datasets to enhance your analysis
Our Data Observatory gives you frictionless access to thousands of curated spatial datasets so you can enrich your own data, and deepen your analysis. Take away the pain of data discovery, evaluation & ETLing. Spend more time on the analysis that answers your most important business questions.


Truly enterprise-ready


Analysis built with CARTO
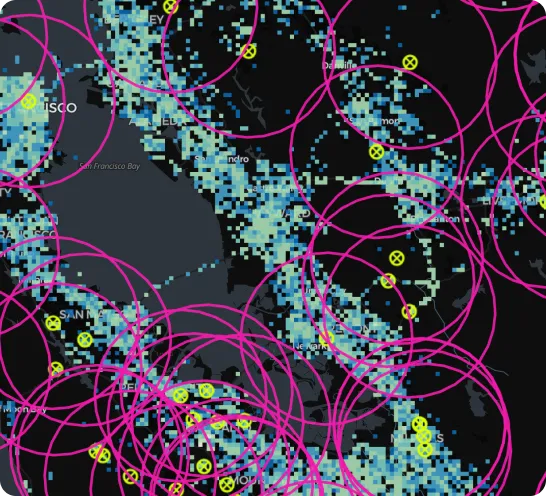
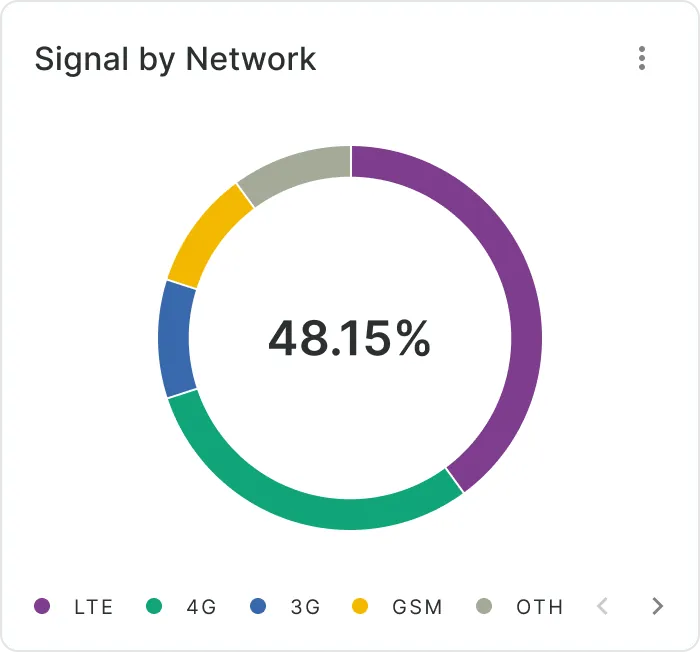
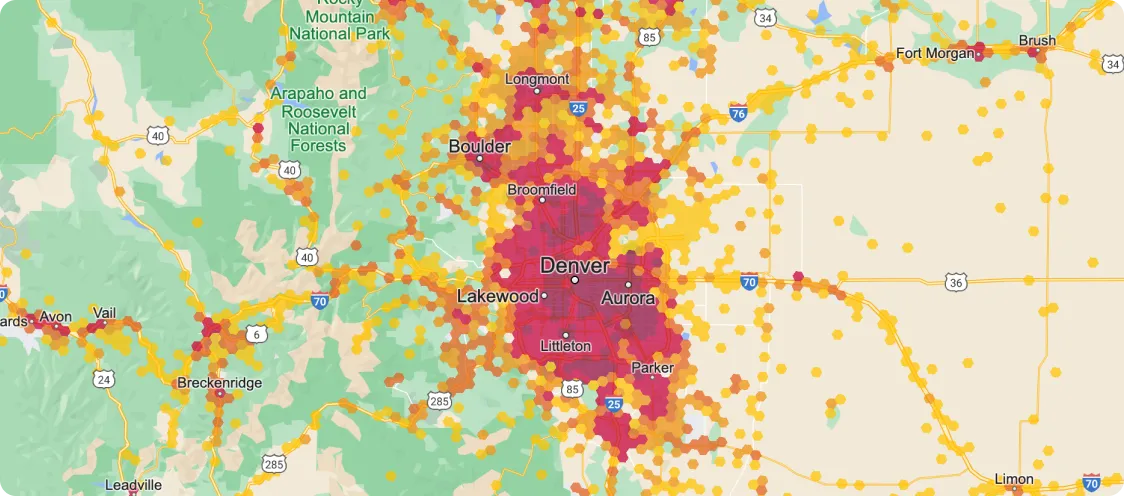
Mobile Provider Coverage Analysis
Explore map →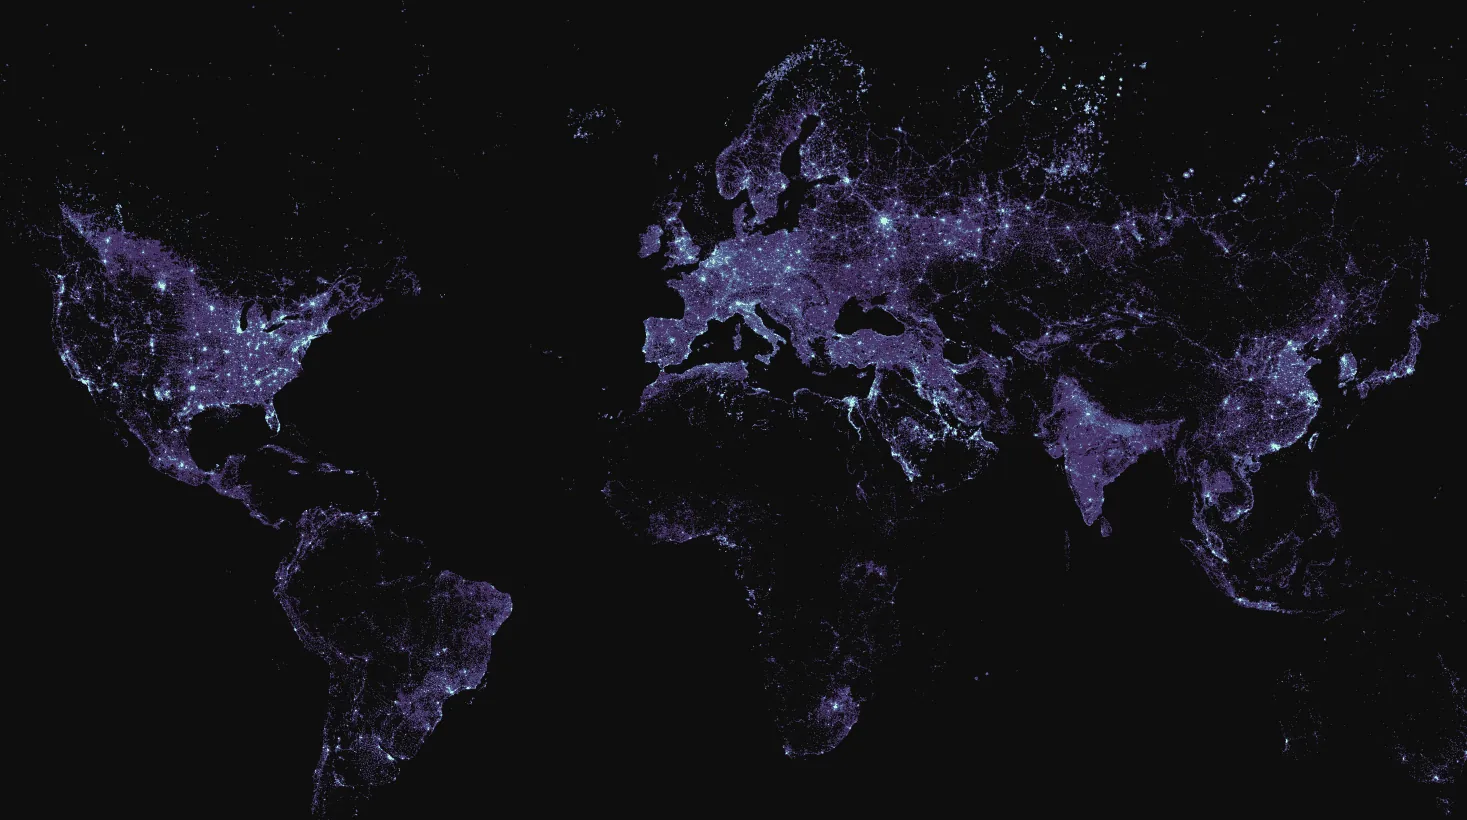
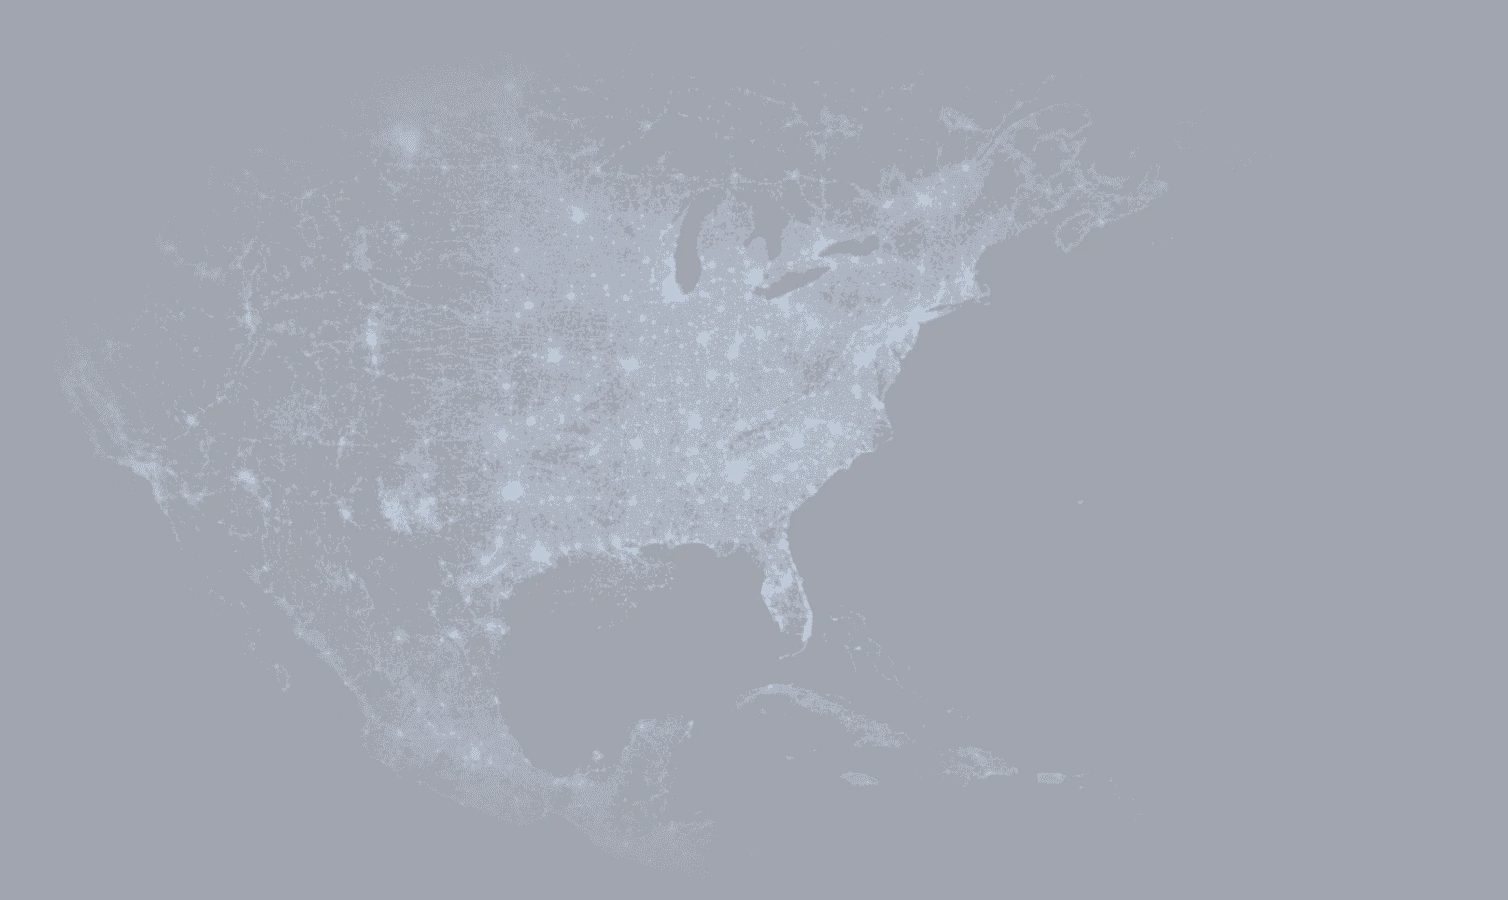
Visualization of Global Night Lights
Explore map →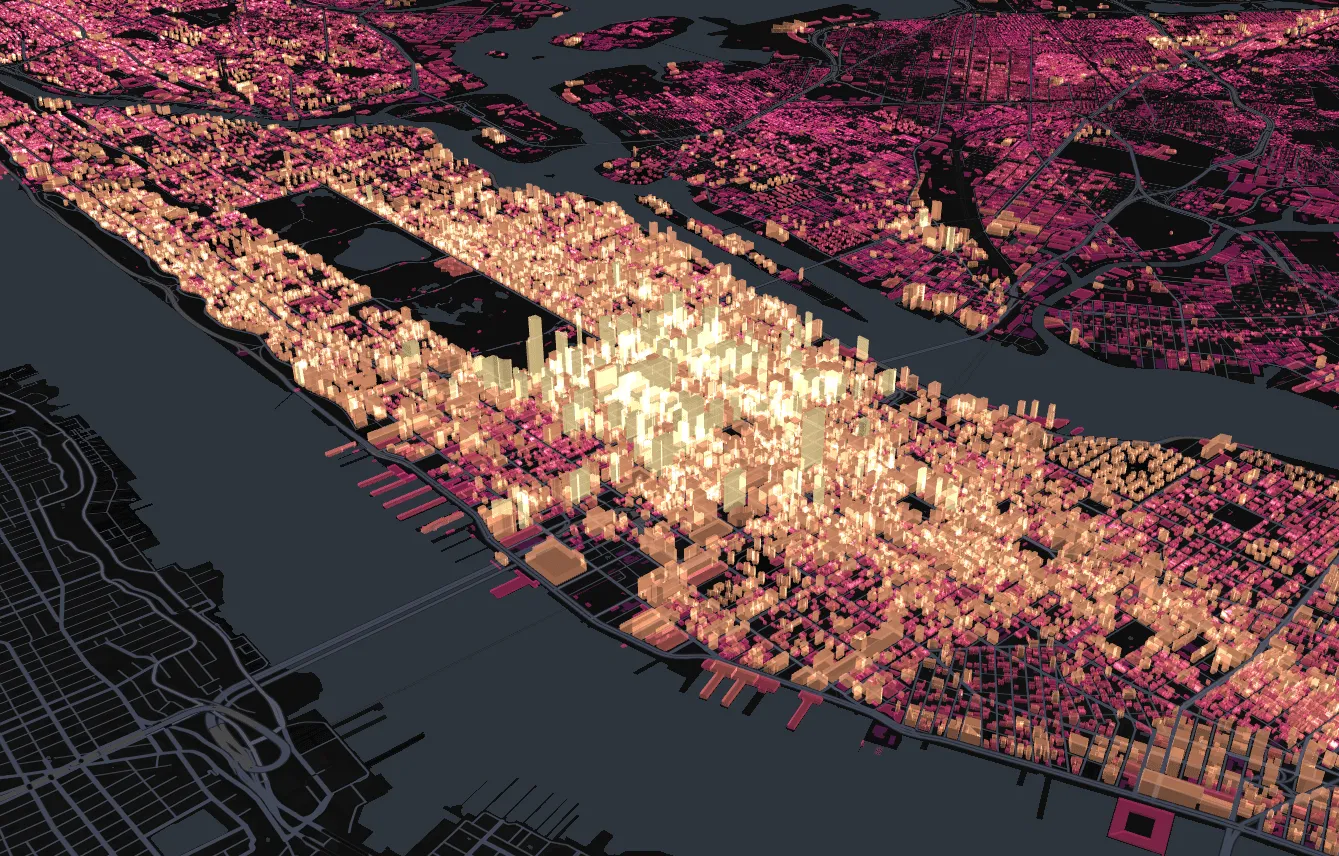
NYC building heights
Explore map →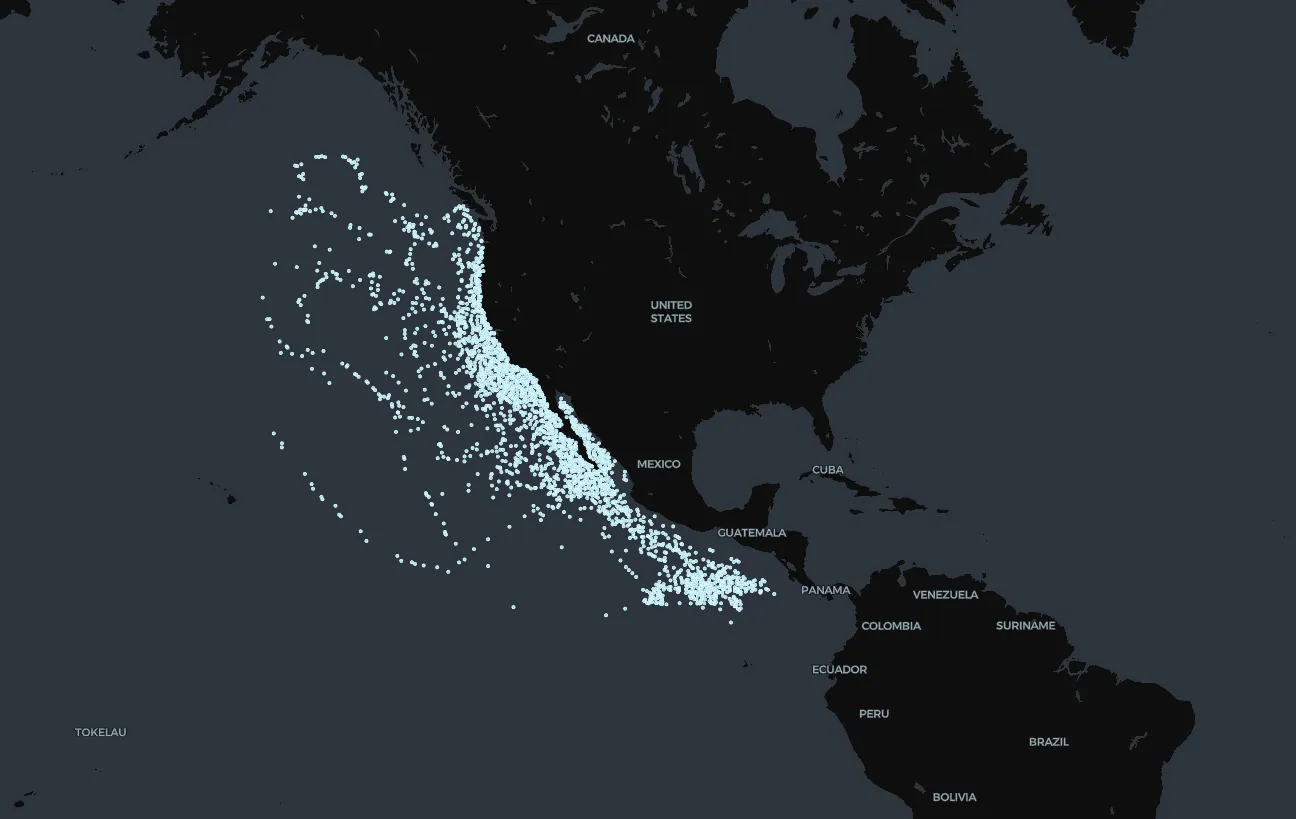
Blue Whales in Eastern Pacific
Explore map →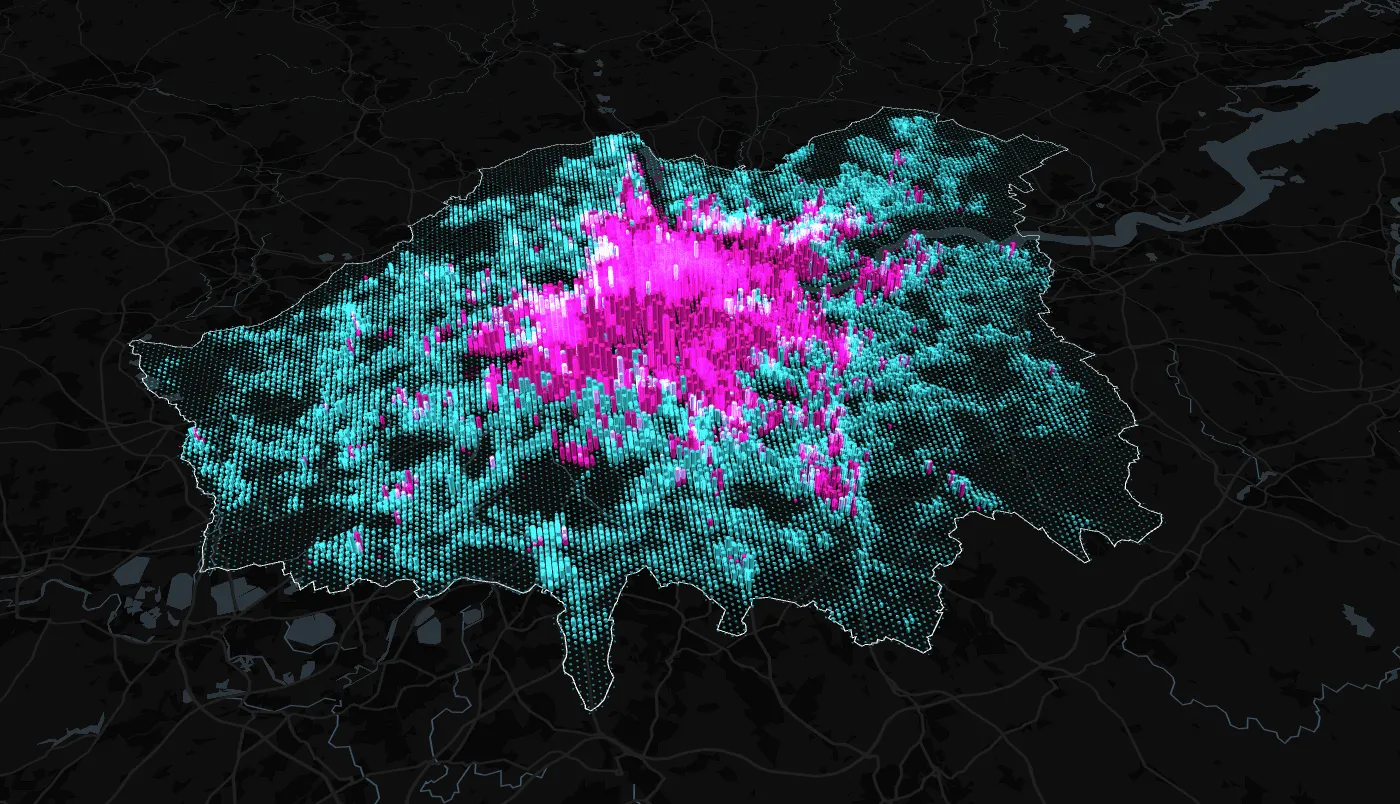
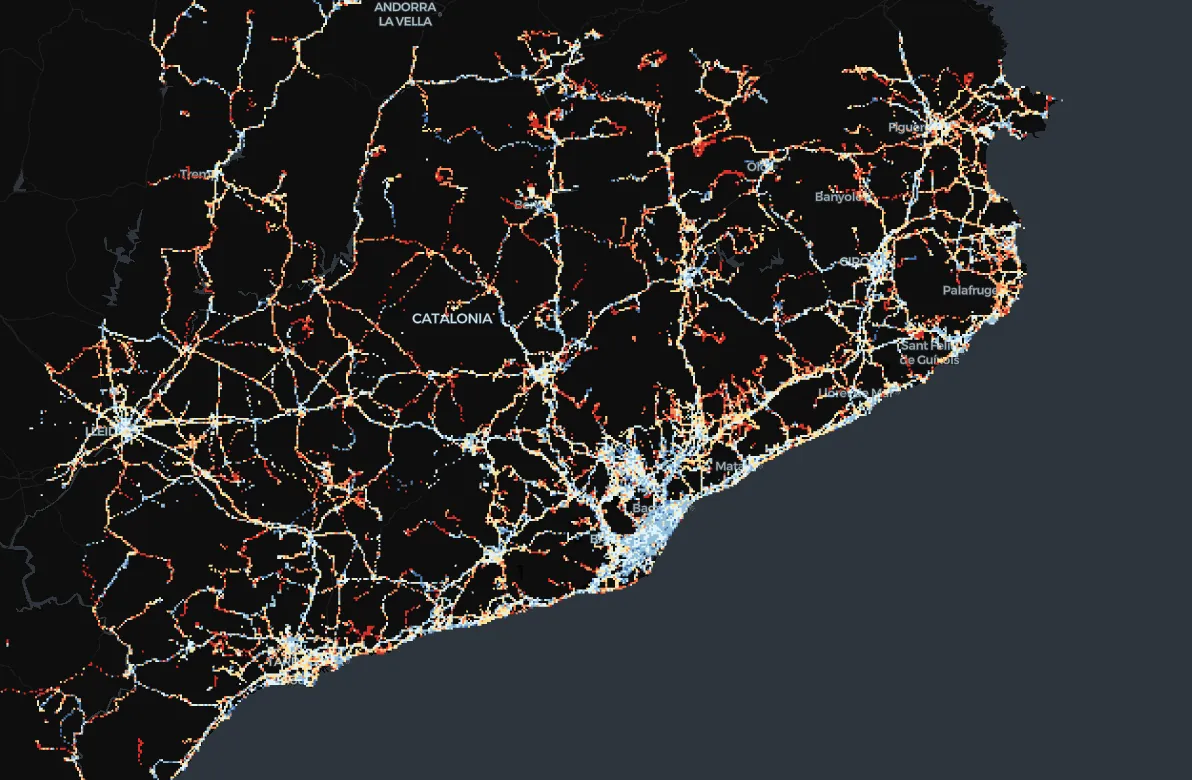
Vehicle Ownership in London
Explore map →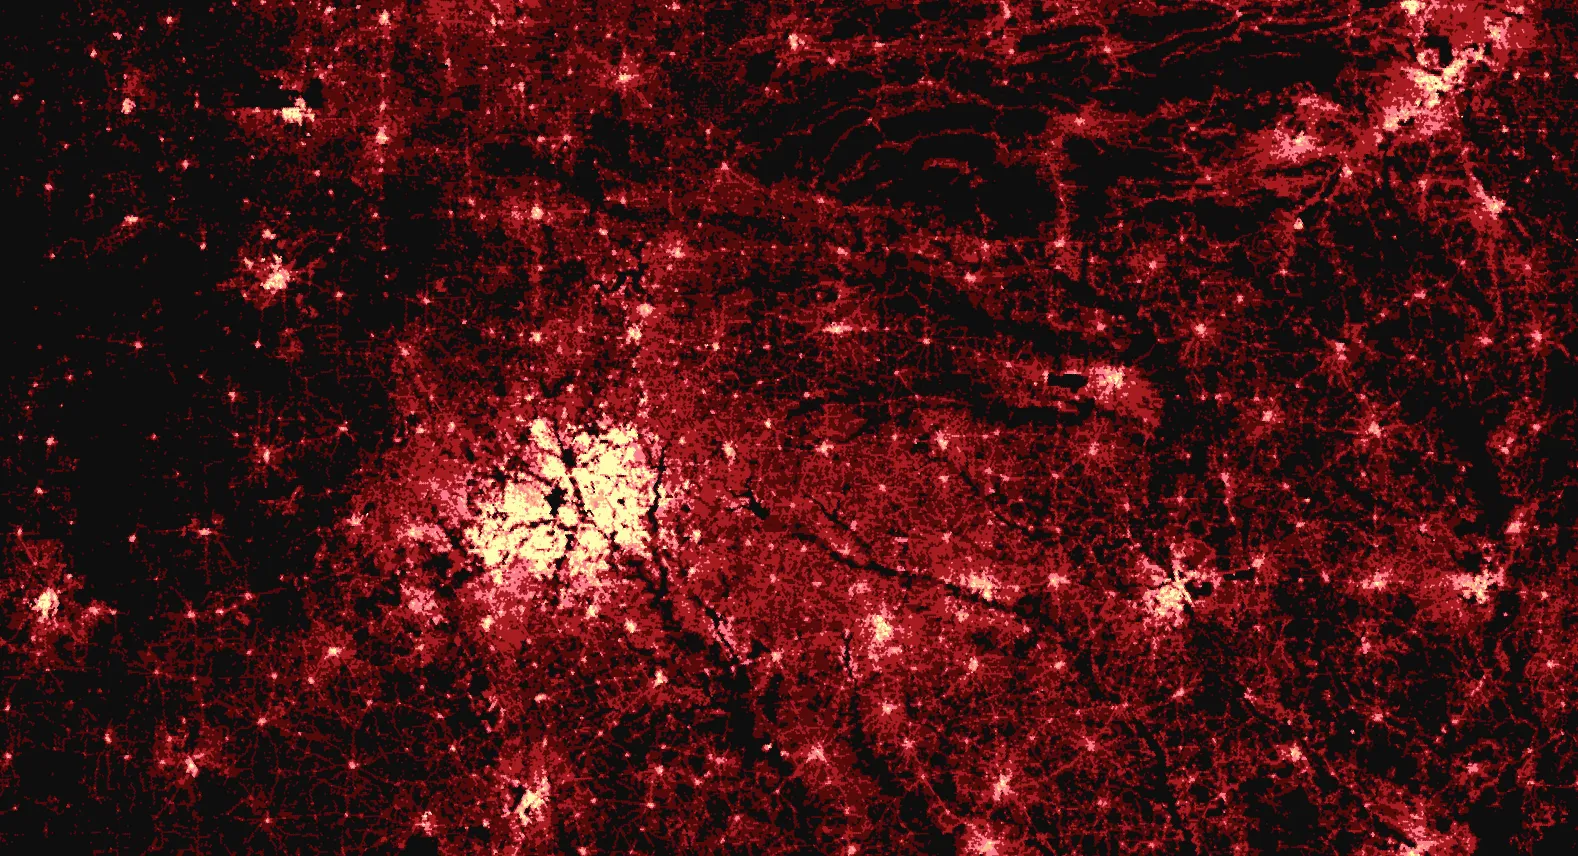
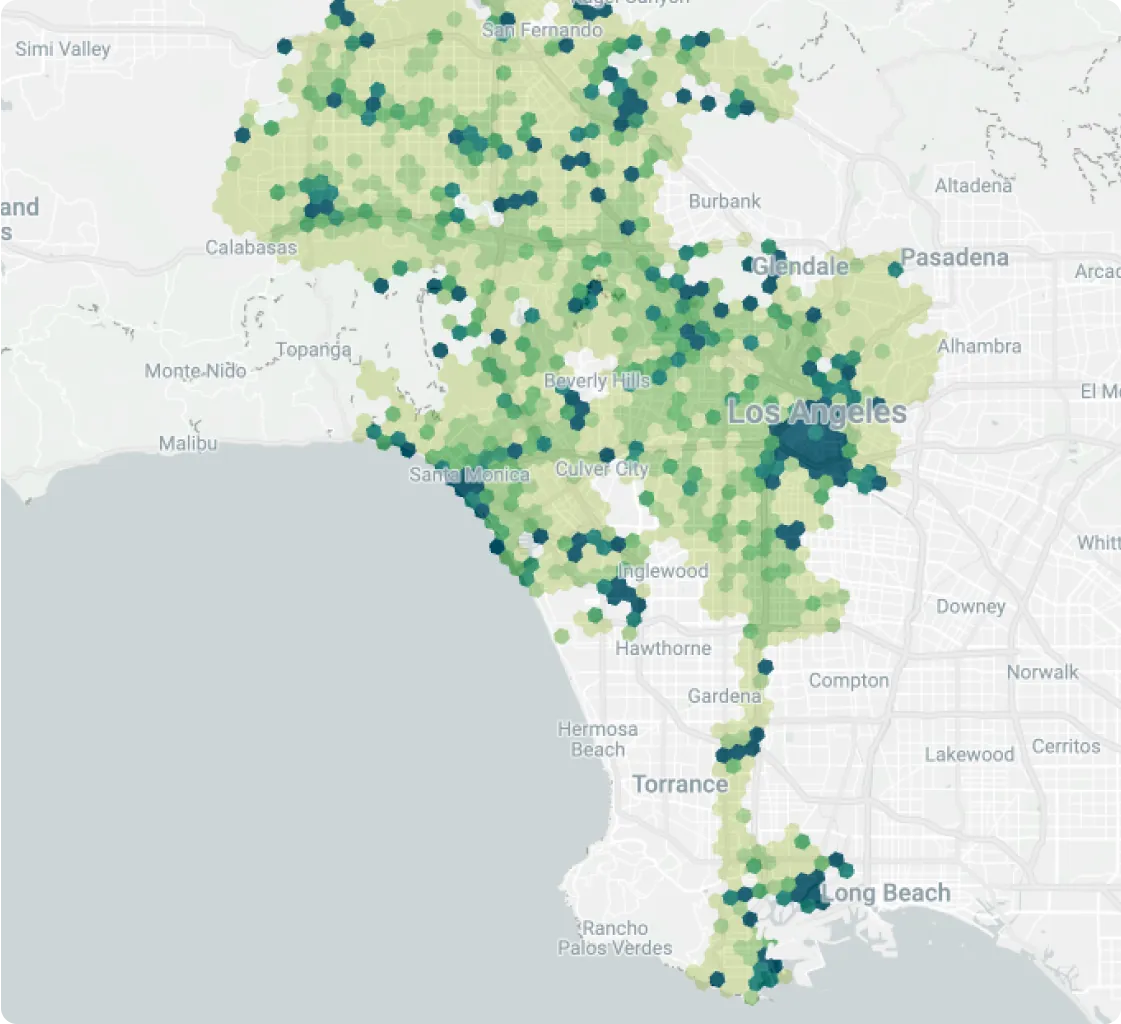
US Population - Spatial Indexes
Explore map →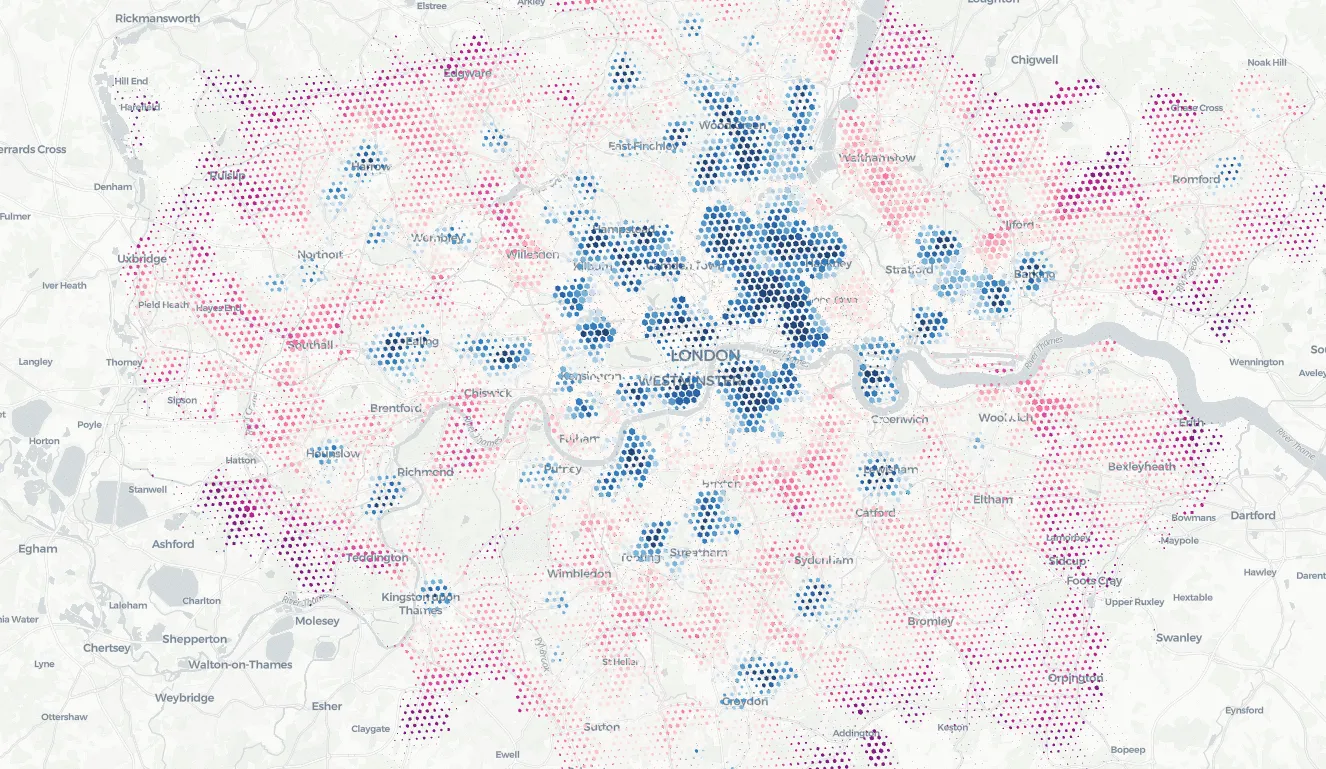
15 Minute Walkability in London
Explore map →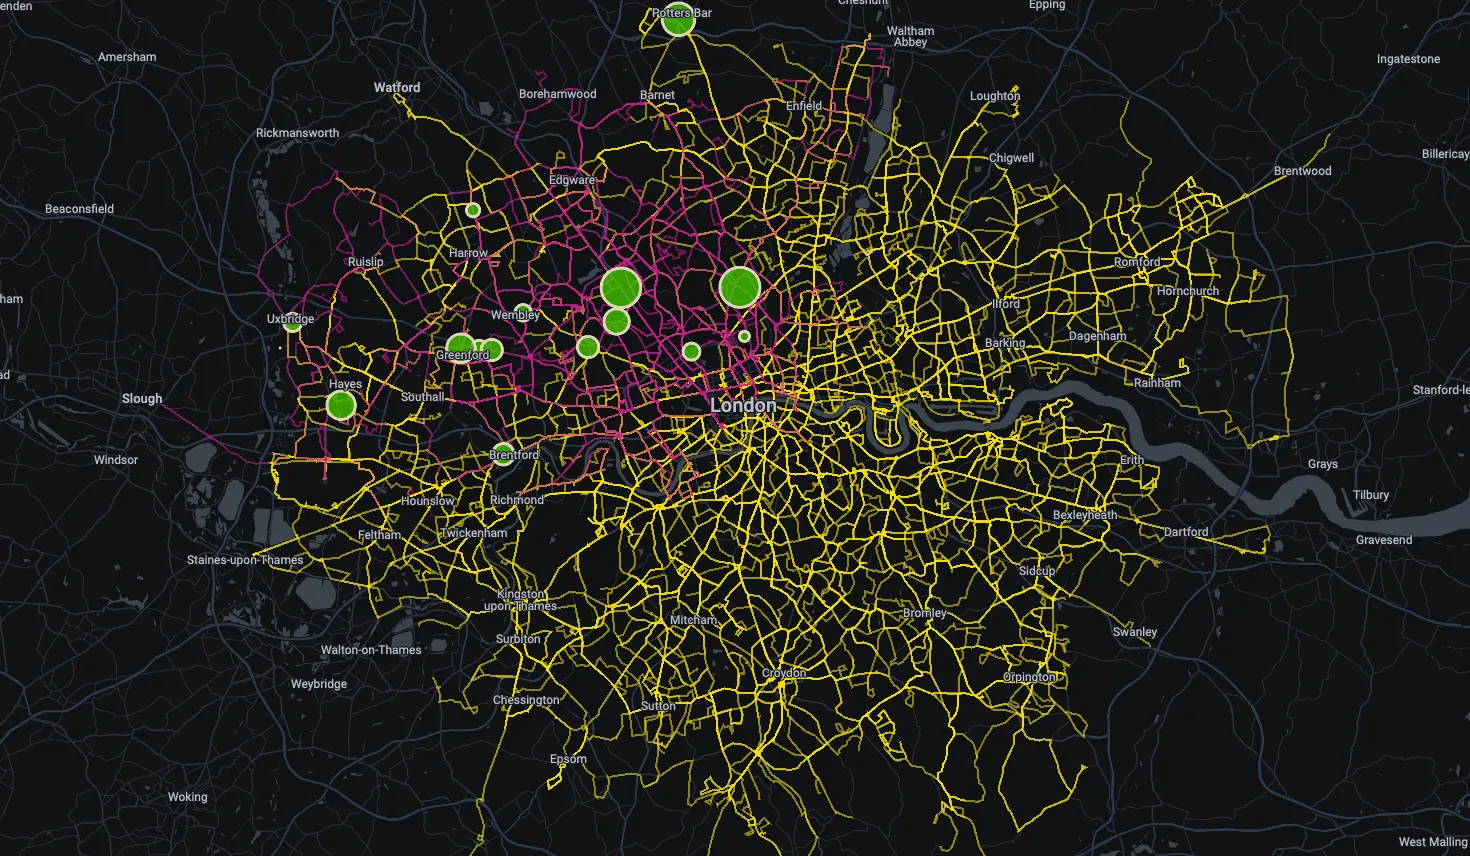
Public Transport Routes and Depots
Explore map →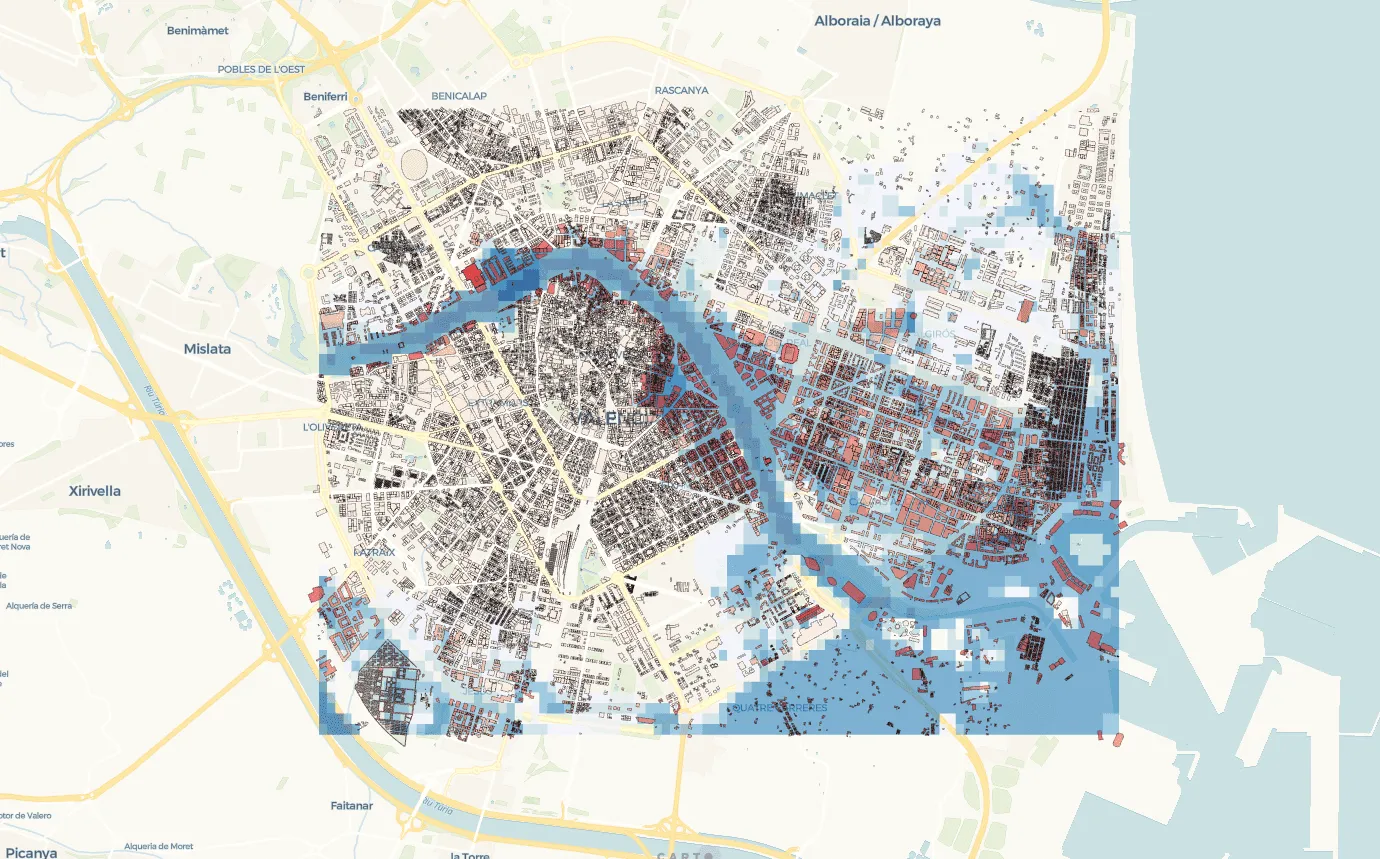
Predicting Flood Risk in Valencia
Explore map →