CARTO’s Analytics Toolbox is a set of user-defined functions (UDFs) and Stored Procedures to unlock Spatial Analytics directly on top of your cloud data warehouse platform. It includes two module types: core modules, which are native to each cloud data warehouse, and advanced modules exclusively available with a CARTO account.
The CARTO Analytics Toolbox has different modules available depending on which cloud data warehouse you are using. It includes over 100 sophisticated spatial functions categorized into distinct modules like tiler, geocoding, data, clustering, and statistics, among others.
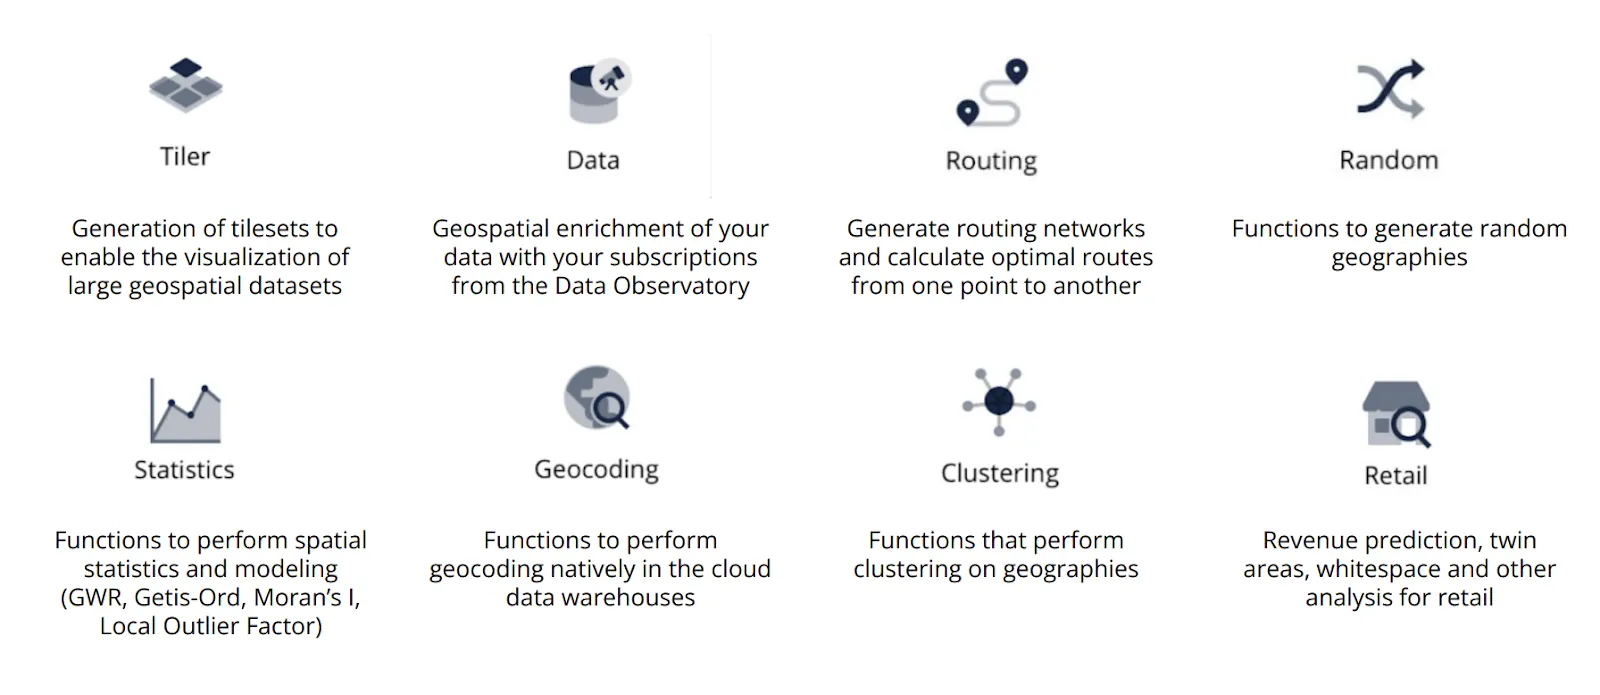
Some of the most relevant advanced functions within the Analytics Toolbox
Tiling using the Analytics Toolbox
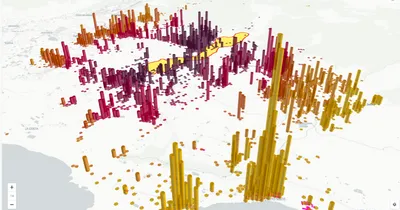
The Tiler function is used to generate tilesets that enable the visualization of large geospatial datasets. In general terms, the Tiler breaks down the geographic data into smaller tiles, usually based on a predefined grid system, and renders each tile into an image or graphical representation.
Tiling is relevant in geospatial data processing and visualization because it offers efficient storage, retrieval, and display of large geographical datasets. Tiling is used to dynamically load and display map data at different zoom levels. To deepen your knowledge on this topic, read the blog: Dynamic Tiling: The key to highly performant cloud-native maps.
If you host you data on BigQuery, Snowflake or Redshift, use our tutorials available at the CARTO Academy to get started.
For Bigquery, you can create simple tilesets, spatial indexes tileses and aggregation tilesets.
For Snowflake, you can start creating spatial index tilesets.
For Redshift, you can explore the creation of spatial index tilesets.
Geocoding using the Analytics Toolbox
The Geocoding function converts addresses or place names into geographic coordinates to precisely locate those addresses or places on a map. This process is relevant for various applications, including mapping, spatial analysis, and location-based services.
With the CARTO Analaytics Toolbox, one of the perks is that geocoding can be run natively in your cloud data warehouses. It matches the input addresses or place names against a database of known locations and their corresponding coordinates. You can start geocoding your address data with our tutorials on BigQuery, Snowflake and Redshift.
Data Enrichment using the Analytics Toolbox
CARTO acts as a layer on top of the cloud data warehouses tapping into its scalable storage and processing power, ensuring efficient handling of large volumes of data. Hence, one of the benefits of data enrichment through the Analytics Toolbox is that you can scale the volume of your data without compromising your speed or performance. Take a look at these tutorials on BigQuery and Snowflake to enrich your data with your subscriptions from the Data Observatory.
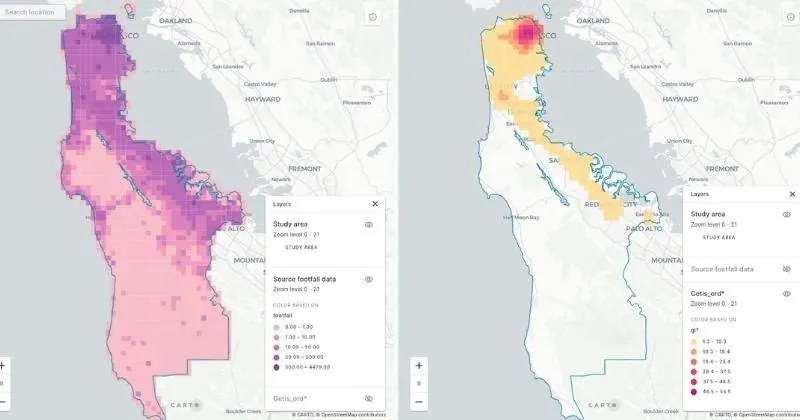
Statistics with the Analytics Toolbox
The Analytics Toolbox offers a set of components within the statistics module. With these components users can create among other things: spatial scores, also known as composite indicators or indexes, derived from a combination of different features; hotspot analysis, using a set of geostatistics functions to compute the Getis-Ord Gi* statistic and the Moran’s I spatial autocorrelation; and, more. You can visit the documentation to find the statistics components compatible with your cloud data warehouse.
Spatial Indexes: H3 and Quadbin
Spatial Indexes are hierarchical grid systems used for analysing large spatial datasets, especially when dealing with data sources in different spatial aggregations. These systems are based on geospatial indexes that provide a direct relationship between grid cells at different resolutions, enabling extremely performant spatial operations.
Quadbin and H3 are spatial indexes particularly relevant due to their unparalleled performance and analysis gains over traditional GIS approaches. Go to the documentation to learn more about the performance benefits of H3 and Quadbin for large volumes of spatial data.
Spatial Indexes are a fascinating topic, that’s why we launched a Spatial Indexes 101 Ebook covering what they are, why you should be using them and practical guides to get you started.
How to Access the Analytics Toolbox
Users can access the functions within the Analytics Toolbox in many ways including CARTO Workflows, CARTO Builder, SQL Notebooks, and directly within the console of their cloud data warehouse platform. Access the documentation for more information on the supported data warehouses.
Within CARTO Builder, the Analytics Toolbox functions can be integrated seamlessly into custom SQL queries, enhancing map creation and analysis.