Draw geometries on a CARTO.js map
Learn how to use the Leaflet.draw plugin or Google Maps drawing library to draw geometry on your map in order to filter its data.
Overview
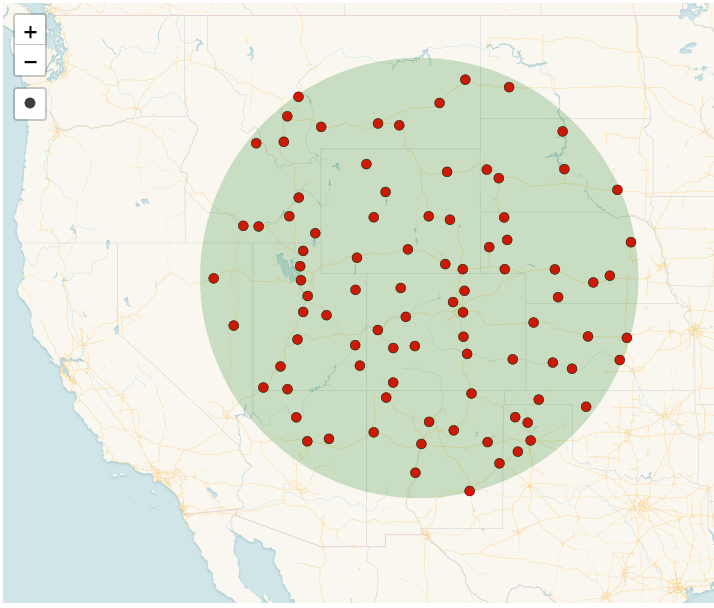
In this example from the CARTO Developer Center we created a map that uses a drawn circle to filter intersecting data.

Using the Leaflet.draw plugin or the Google Maps drawing library we can create a geometry on the map and use it to filter CARTO data. For this example, we’re using circle geometry as a tool to filter the CARTO dataset ne_10m_populated_places_simple.
In order to achieve this effect we follow the following steps:
- We create a CARTO.js map with one layer, as demonstrated in this example.
- We instantiate the drawing tool, specifying the circle option. We add it into the map.
- We create the function
circleCountPointsIntersect(radius, lat, lng). It will update the CARTO.js layer source with the data that intersects the circle we will draw. - We set an event that will get the radius and center coordinates of the circle we’ll draw.
- Once we have the values from step 4, we use them to call the function
circleCountPointsIntersect(radius, lat, lng). That function will modify the map, so only the data that intersects with the drawn circle will be displayed.
Differences between Leaflet and Google Maps approach
Because we are using two different libraries and plugins, the way in which the drawing tool is implemented is different. Let’s explore how it is set in both Leaflet and Google Maps.
Leaflet
In order to use the drawing tools with Leaflet, we need to load the plugin Leaflet Draw:
<script src="https://cdnjs.cloudflare.com/ajax/libs/leaflet.draw/0.4.13/leaflet.draw.js"></script>
<link rel="stylesheet" href="https://cdnjs.cloudflare.com/ajax/libs/leaflet.draw/0.4.13/leaflet.draw.css" />
Once we load the plugin into our HTML code, we can configure the Draw controller and instantiate it on the map. We recommend reading this section of the Leaflet Draw plugin web page to get a better understanding of the the Draw controller’s options.
let drawControl = new L.Control.Draw({
    draw: {
        polygon: false,
        polyline: false,
        line: false,
        marker: false,
        rectangle: false,
        circle: {
            shapeOptions: {
                color: 'green',
                weight: 0.1,
                opacity: 0.5
            }
        },
        circlemarker: false,
    },
    edit: false
});

// initialise the draw controls
map.addControl(drawControl);
Then we set a Leaflet Draw event to get the radius and center coordinates of the drawn circle. We use those to execute the function that changes the CARTO.js map’s source, so only points that intersect with the drawn circle are displayed.
// get radius and center of drawn circle and change source of the CARTO layer
map.on(L.Draw.Event.CREATED, function (e) {
    let layer = e.layer;
    map.addLayer(layer);
    let radius = layer.getRadius();
    let centerLat = layer.getLatLng().lat;
    let centerLng = layer.getLatLng().lng;
    circleCountPointsIntersect(radius, centerLat, centerLng)
});
Google Maps
In order to use the drawing tools with Google, we need to load the drawing library on the Google Maps script:
<script src="https://maps.googleapis.com/maps/api/js?key=AIzaSyAORE5iCjgLb4sMcWfmyRJgtP9VwfOrbJM&libraries=drawing&v=3.32"></script>
Once we load the library into our HTML code, we can configure the drawing controller and instantiate it on the map. We recommend reading this section of the Google Drawing library web page to find out more about the drawing controller’s options.
var drawingManager = new google.maps.drawing.DrawingManager({
    drawingControl: true,
    drawingControlOptions: {
    position: google.maps.ControlPosition.TOP_CENTER,
    drawingModes: ['circle']
    },
    circleOptions: {
    fillColor: 'green',
    fillOpacity: 0.5,
    strokeWeight: 0.1,
    clickable: false,
    editable: false,
    zIndex: 1
    }
});
drawingManager.setMap(map);
Then we set a Google Maps Drawing event to get the radius and center coordinates of the drawn circle. We use those to execute the function that changes the source of the CARTO.js map, so only points that intersect with the drawn circle are displayed.
// get radius and center of drawn circle and change source of the CARTO layer
google.maps.event.addListener(drawingManager, 'circlecomplete', function (circle) {
    let radius = circle.getRadius();
    let centerLat = circle.getCenter().lat();
    let centerLng = circle.getCenter().lng();
    circleCountPointsIntersect(radius, centerLat, centerLng)
});
Bonus: save drawn data into CARTO dataset
You can also draw geometry on the map and save it in your CARTO dataset. To do that you need to:
- Create a CARTO dataset to store the geometries. We will store them in a dataset named
insert_polygons, which contains empty cartodb_id and the_geom fields. - Create an API Key with
SQL INSERT permissionfor a CARTO dataset. This allows you to insert data from your map into the dataset. Remember that CARTO datasets only accept one type of geometry. If you draw a polygon you will only be able to add other polygons to that dataset, not lines or points. In this section of our Developer Center you can find detailed information about CARTO’s authentication options. - In the JavaScript code, you need to create a function that performs a
SQL INSERToperation once the geometry has been drawn. You can use the JavaScript Fetch API or an external library to make an HTTP request to CARTO using the CARTO SQL API.
For example, Using Leaflet draw plugin, you could use a similar block of code to store the geometries of the map in your CARTO datset:
map.on(L.Draw.Event.CREATED, function (e) {
    let layer = e.layer;
    map.addLayer(layer);
    let radius = layer.getRadius();
    let centerLat = layer.getLatLng().lat;
    let centerLng = layer.getLatLng().lng;
    circleCountPointsIntersect(radius, centerLat, centerLng)

    let layerAdded = JSON.stringify(layer.toGeoJSON().geometry)

    // use Fetch API to send request
    fetch(`https://cartojs-test.carto.com/api/v2/sql?q=
            INSERT INTO insert_polygons(the_geom)
            VALUES(
                St_SetSRID(
                    St_GeomFromGeoJSON('${layerAdded}'), 4326
                )
            )&api_key=XXXXX`,
            {
                headers: new Headers({
                    'Content-Type': 'application/json',
                    'Access-Control-Allow-Headers': 'Content-Type',
                    'Access-Control-Allow-Origin': '*'
                }),
                method: 'get',
                mode: 'no-cors'
            }
    ).then(function(response){
        console.log(response)
    }).catch(function(err){
        console.log(err)
    })

});