This content applies to a previous version of CARTO
In October 2021 we released a new version of our platform. You can find the latest documentation at docs.carto.com
Easy Builder animated map
You will need to import the following dataset/s into your account:
- A cycling race track from Mexico City
Import and create map
- Use the link above to download the dataset and import it to the account.
- Just drag and drop the file into the CARTO Dashboard and wait for the dataset to be imported. The map should be automatically created.
Change base map
- Select Dark Matter basemap
Animated map
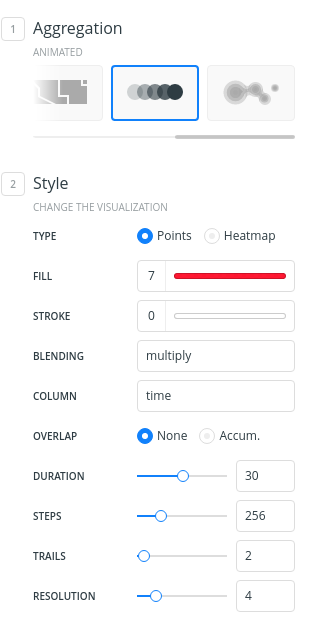
- Select the layer and move to the STYLE tab
- Scroll horizontally on the Aggregation section to find ANIMATED
- Select
timeon the COLUMN parameter in order to animate your map by the timestamp of the position - Experiment with the rest of the parameters and see how they affect your map visualization
- Point properties: FILL, STROKE and BLENDING
- DURATION
- NUMBER OF STEPS (what happens with just
1step?) - Accumulative or not?
- Number of TRAILS
- RESOLUTION (hint: make it really big)
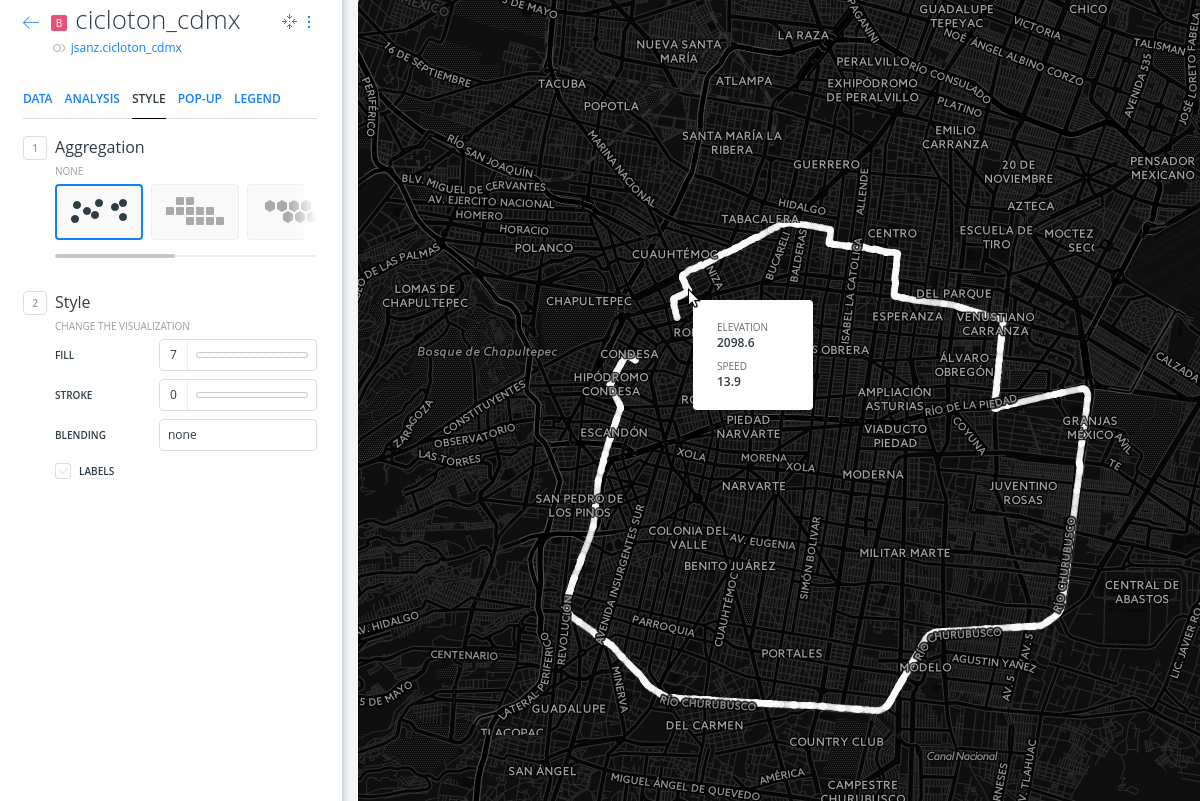
Positions layer
- Add again the dataset so you can have the track as a static image
- Style it in a way it’s easy to view. You probably want to remove the stroke, select a light color, etc.
- Add a pop up on hover to render speed and elevation.
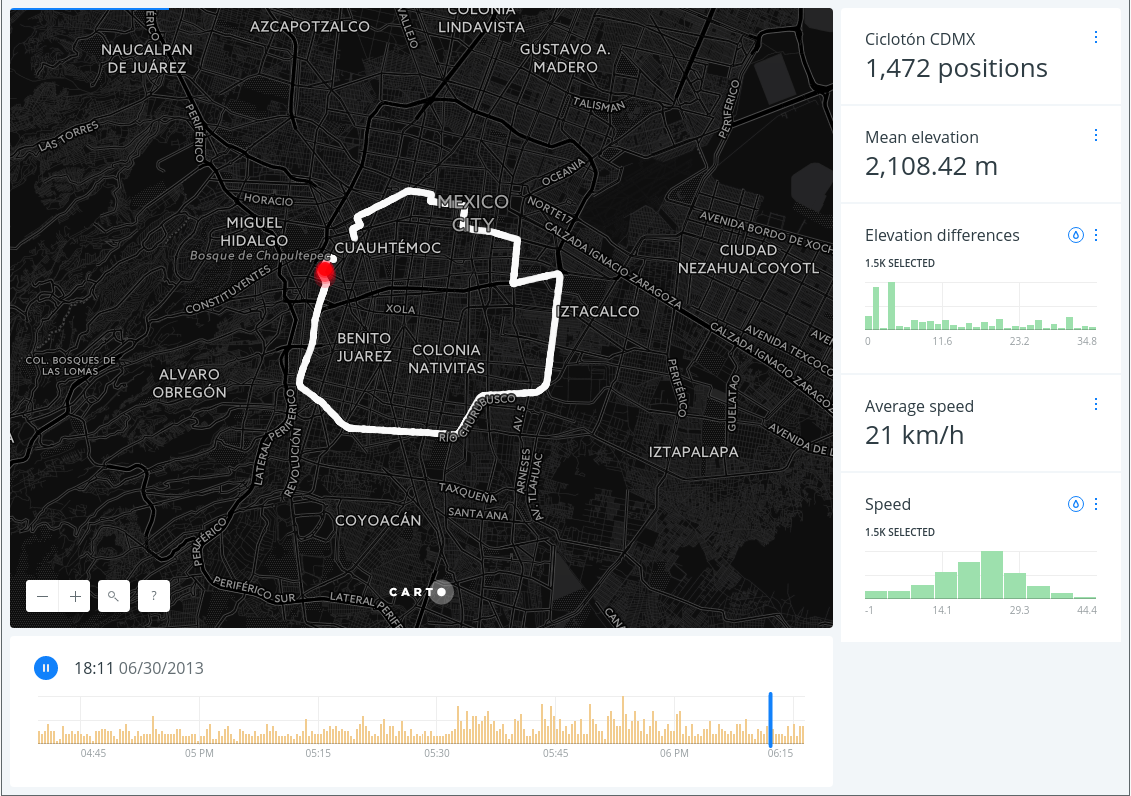
Widgets
Add the following widgets using the mentioned fields:
- Total number of positions (
cartodb_id) - Average speed (
speed_kmh) - Average elevation (
ele) - Speed histogram (
speed_kmh) - Elevation difference (
diff_ele)
Tweak the labels, suffixes, number of bins, etc so you get a nice map of the track.
Adding category style
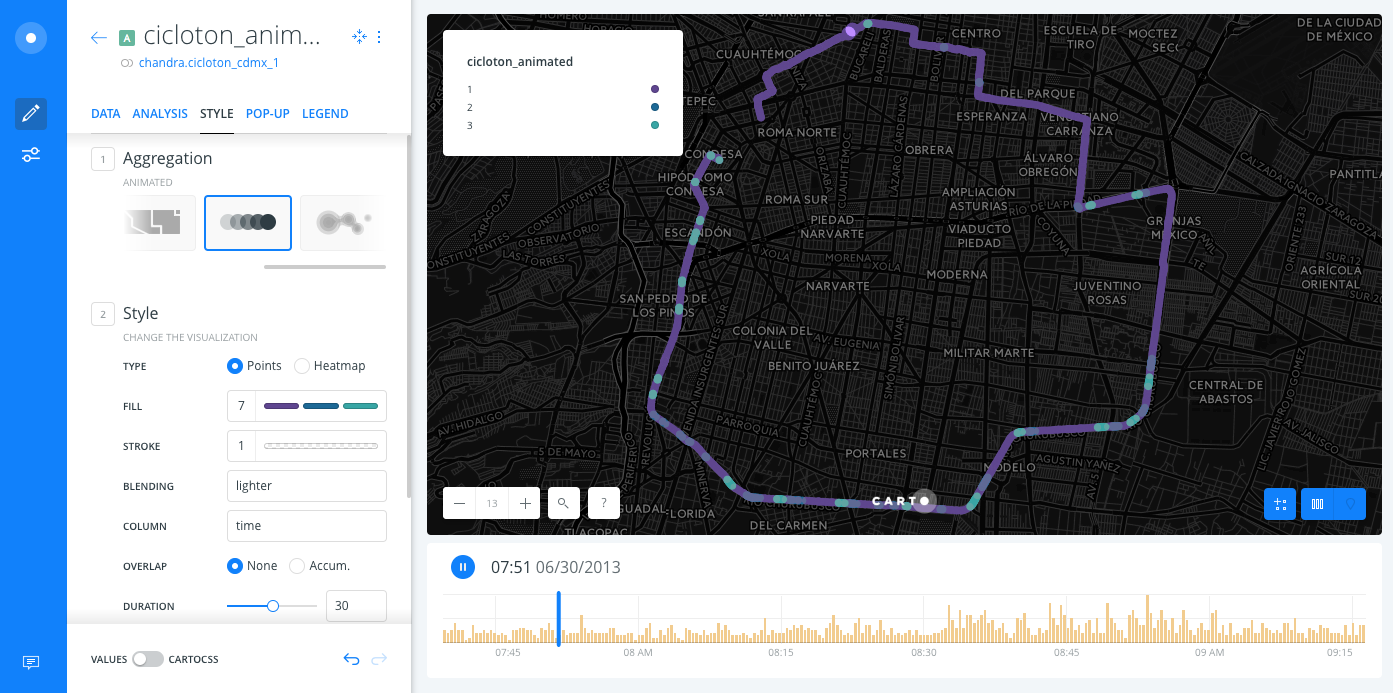
Besides styling data by a time field, you can also style data by a column value to create an animated category map. Download the cicloton category map .carto file. Import the map to your account. Open the map, and select the “cicloton_animated” layer in the LAYERS pane:
- Navigate to the STYLE tab
- Select on the Aggregation section, choose “ANIMATED” for the aggregation
- Click on the FILL color in the Style section
- In the upper left hand side of the color picker, select “BY VALUE” (not “SOLID”). Choose the “up_or_down” column from the column list that appears.
- To see your data values better, select the FILL color next to “STROKE” in the Style section. In the color picker, change the opacity from “1” (located in the lower right hand side) to “0”
- Set the “COLUMN” form option to the “time” column
- Play with the animated settings in the Style section. Try a longer or shorter duration, or longer or shorter steps.
- Set the “TRAILS” field to “0” remove the trailing markers